

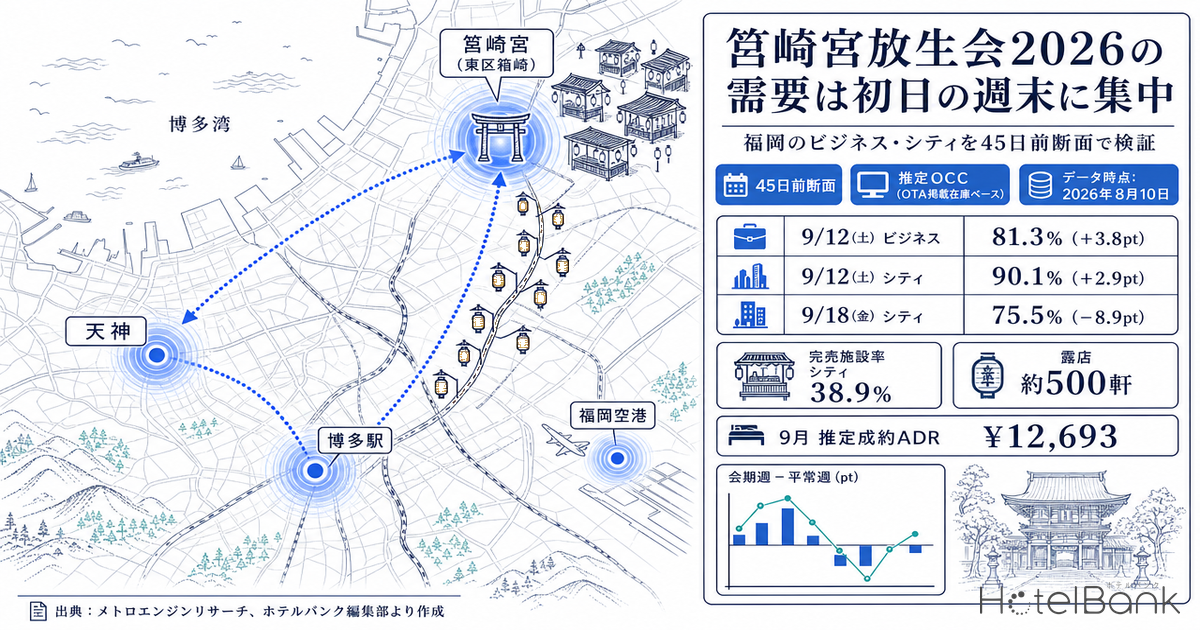
Hakozaki-gu Shrine’s mid-autumn grand festival, Hojoya (放生会), runs for seven days in 2026, from Saturday, September 12 through Friday, September 18. With roughly 500 stalls lining the approach, it is one of Hakata’s three great festivals and has long been treated as a signature annual event that moves accommodation demand across Fukuoka City. So where, and by how much, does demand for those seven days actually stand? Lining up estimated OCC (OTA-listed inventory basis) for business hotels in Fukuoka Prefecture (312–316 properties) and city hotels (36 properties) at the identical cross-section of 45 days before the stay date, the upside does not spread across the festival period. Saturday, September 12, the opening day, shows an estimated OCC of 81.3% for business hotels, 3.8pt above the 77.5% recorded for the preceding normal Saturday, September 5. City hotels stand at 90.1% against 87.2%, 2.9pt higher. Weekdays inside the festival period, however, sit lower: Tuesday, September 15 comes in at 69.6% for business hotels, 1.6pt below the 71.2% of the normal Tuesday, September 8. As of the 45-days-out cross-section, event demand is concentrated not in the “festival period” but in “the weekend containing the opening day.”
Coverage: business hotels in Fukuoka Prefecture, 312–316 properties, and city hotels, 36 properties (by stay date). The price metric in this article is estimated settled ADR (the transaction price level estimated from OTA and other sales data, pre-tax equivalent); occupancy is an estimate based on OTA-listed inventory. Definitions for both appear at the end of the article. Data as of August 10, 2026.
- — On the opening day, Saturday, September 12, estimated OCC (OTA-listed inventory basis) at the 45-days-out cross-section is 81.3% for business hotels and 90.1% for city hotels, +3.8pt / +2.9pt above the preceding normal Saturday, September 5.
- — The upside is confined to three days, Friday September 11 through Sunday September 13. Tuesday, September 15 is −1.6pt, Thursday, September 17 is −3.2pt, and the closing day, Friday, September 18, is −5.0pt: weekdays inside the festival period run below the normal week.
- — Thin inventory shows up as a layer of properties. The sellout rate for September 12 is 26.6% for business hotels (normal Saturday 18.0%) and 38.9% for city hotels (25.0%).
- — Weekdays inside the festival period are not “weak days” but “late days.” September 15 added +2.6pt over the six days from 45 to 37 days out, ahead of the +1.5pt of the normal Tuesday.
- — Hold the price yardstick at the market level. Estimated settled ADR for Fukuoka business hotels was ¥10,382 in the finalized month of July 2026 (+3.6% year on year), with September 2026 currently estimated at ¥12,693.
The upside concentrates on the opening weekend and is complete by Friday and Saturday
Start by pairing the festival week (September 12–18) with the immediately preceding normal week (September 4–10) by day of week, and comparing estimated OCC at the same cross-section of 45 days before the stay date. Aligning on 45 days out matters because the number of days remaining until today differs by stay date; simply lining up the latest values would mix in the obvious slope that “the nearer the stay date, the higher the number.” Cutting at the same remaining-days cross-section allows the strength of demand itself to be compared.
The result traces a clear gradient. For business hotels, Friday, September 11 — the eve of the festival — is +4.1pt, the opening day of Saturday, September 12 is +3.8pt, and Sunday, September 13 is +1.8pt: the upside sits on the weekend side. Monday, September 14, however, is +0.7pt, essentially erasing the difference, and from there Tuesday, September 15 is −1.6pt, Wednesday, September 16 is −2.1pt, and Thursday, September 17 is −3.2pt — the further the festival progresses, the further below the normal week it falls. The closing day, Friday, September 18, stands at 70.1%, 5.0pt below the 75.1% of the normal Friday, September 4. Even on the final day, when the children’s procession (稚児行列) is held, accommodation demand does not reach that of an ordinary Friday.
City hotels take the same shape. Saturday, September 12 is +2.9pt, Friday, September 11 is +1.5pt, and Sunday, September 13 is +1.7pt, lifting the weekend; weekdays inside the festival period sink, with Tuesday, September 15 at −3.1pt, Wednesday, September 16 at −2.4pt, and Thursday, September 17 at −2.8pt. The closing day, Friday, September 18, is 75.5%, 8.9pt below the 84.4% of the normal Friday, September 4. The swing is wider than for business hotels, but the city hotel universe is only 36 properties, and the number of observed properties per cross-section moves between 32 and 36. At that scale, a change in listing status at a single property can move the aggregate by several points, so the appropriate focus is not the fine differences in level but the agreement in direction — weekends up, festival-period weekdays down.
Source: Compiled by MetroEngines Research and the HotelBank Editorial Team.
Looking at the share of properties with no confirmable listed inventory (hereafter “sellout rate,” an estimate), the concentration on the weekend becomes sharper still. Business hotels on Saturday, September 12 stand at 26.6% at the 45-days-out cross-section, 8.6pt above the 18.0% of the normal Saturday, September 5. For city hotels, September 12 is 38.9%, 13.9pt above the normal Saturday’s 25.0%. In other words, even among Saturdays, the opening day carries a distinctly thicker layer of properties that already hold no inventory. By contrast, Tuesday, September 15 inside the festival period is 2.9% for business hotels (normal Tuesday 5.4%) and Wednesday, September 16 is 3.2% (5.1%) — thinner than the normal week. No sign of inventory drying up on festival-period weekdays is observed as of 45 days out. For where Fukuoka’s inventory absorption sits relative to the other prefectures of Kyushu, Obon T-7: Kyushu’s 31.7pt Gap — Fukuoka 73.0%, Kagoshima 41.3% organizes the picture from a near-term cross-section.
| Day | Normal week (stay date) |
Festival week (stay date) |
Business normal → festival (Δ) |
City normal → festival (Δ) |
|---|---|---|---|---|
| Fri | 9/4 | 9/11 | 75.1% → 79.2% (+4.1pt) | 84.4% → 85.9% (+1.5pt) |
| Sat (opening day) | 9/5 | 9/12 | 77.5% → 81.3% (+3.8pt) | 87.2% → 90.1% (+2.9pt) |
| Sun | 9/6 | 9/13 | 73.6% → 75.4% (+1.8pt) | 80.0% → 81.7% (+1.7pt) |
| Mon | 9/7 | 9/14 | 68.5% → 69.2% (+0.7pt) | 77.1% → 76.8% (−0.3pt) |
| Tue | 9/8 | 9/15 | 71.2% → 69.6% (−1.6pt) | 80.6% → 77.5% (−3.1pt) |
| Wed | 9/9 | 9/16 | 70.0% → 67.9% (−2.1pt) | 77.9% → 75.5% (−2.4pt) |
| Thu | 9/10 | 9/17 | 71.5% → 68.3% (−3.2pt) | 81.8% → 79.0% (−2.8pt) |
| Fri (closing day) | 9/4 | 9/18 | 75.1% → 70.1% (−5.0pt) | 84.4% → 75.5% (−8.9pt) |
Source: Compiled by MetroEngines Research and the HotelBank Editorial Team. Observed properties: 289–312 business hotels, 32–36 city hotels (varies by cross-section).
Source: Compiled by MetroEngines Research and the HotelBank Editorial Team.
Festival-period weekdays are “below on level, above on pace” — they are in catch-up
What is worth digging one layer deeper is not only the level at the cross-section but how the build accumulates from there. Cutting the booking curve (the cumulative path of estimated OCC by stay date) into the same remaining-days window, from 45 days out to the latest observation, changes how festival-period weekdays look.
For business hotels, Tuesday, September 15 built 2.6pt over six days, from 69.6% at 45 days out to 72.2% at 37 days out. Over the same “45 days out → 37 days out” window, the normal Tuesday, September 8 went from 71.2% to 72.7%, or 1.5pt. September 15 sits lower on level, but its recent pickup is 1.1pt larger. Likewise Wednesday, September 16 added 1.9pt (normal Wednesday 1.5pt) and Thursday, September 17 added 1.5pt (normal Thursday 1.2pt): festival-period weekdays are all filling at a faster pace than the normal week. The opening day of Saturday, September 12 also added 2.6pt over the 11 days from 45 to 34 days out, ahead of the 1.6pt of the normal Saturday, September 5 over the same window.
In short, the festival week still runs below the normal week on level for some days, yet bookings are coming in more strongly than in the normal week. Several readings of the background are possible — that the Hojoya schedule becomes widely recognized only in the near term, or that decisions on pilgrimage and sightseeing from outside the prefecture come late — but the single fact the data shows is this: festival-period weekdays have not yet caught up with the normal week, and they are moving to close the gap. Judging festival-period weekdays as “days of weak demand” from the look of the cross-section alone means missing the recent build.
Source: Compiled by MetroEngines Research and the HotelBank Editorial Team. Observed properties: 289–311 per series (varies by cross-section).
One more yardstick is worth holding: how to read the absolute level of the cross-section. For business hotels in Fukuoka Prefecture, the elapsed month of July 2026 recorded a monthly average estimated OCC of 91.8% (roughly 315 properties covered, daily observation coverage 97.5%). Averages by day of week were 95.9% on Saturday, 92.5% on Tuesday and Thursday, 92.2% on Wednesday and Friday, 88.7% on Sunday, and 88.1% on Monday. Against the level recently reached, the 81.3% at the 45-days-out cross-section for September 12 is still only a waypoint. The 3.8pt gap at 45 days out is not “the gap in final occupancy” but “the gap in accumulation at this point in time,” and should be read as a number that can shift in either direction depending on how the remaining 45 days are managed.
The market level in September — where Fukuoka sits on estimated settled ADR
With the shape of occupancy visible, check the price-side yardstick as well. Estimated settled ADR (pre-tax equivalent) for business hotels in Fukuoka Prefecture was ¥10,382 in July 2026, a finalized month (340 properties), up 3.6% against ¥10,023 in July 2025 (329 properties). June 2026 was ¥10,030 (340 properties), up 6.5% against ¥9,414 in the prior-year month (331 properties). For city hotels, July 2026 was ¥16,608 (40 properties), up 3.1% against ¥16,106 in the prior-year month (37 properties), and June 2026 was ¥16,011 (40 properties), up 1.2% year on year. Comparing finalized months with finalized months, Fukuoka’s transaction price level has been running somewhat ahead of the prior year. For the six-month year-on-year path in the first half and how to translate that level into a price range, Fukuoka Settled ADR +10.9% in H1 2026 While Osaka Falls 32.8% in June covers it in detail.
For September 2026, which contains the Hojoya period, the current estimates based on sales to date stand at ¥12,693 for business hotels (331 properties) and ¥19,046 for city hotels (40 properties). These are not finalized values and will move with sales going forward. It is tempting to line them up against the finalized values for the prior-year month (business ¥9,972, city ¥15,212), but a simple comparison between a finalized value and a current estimate does not hold, so a year-on-year assessment of September must wait for the month to close. What can be used here is the sense of level — that September is set as a market in a range above August (business hotels currently estimated at ¥11,646) — and the seasonal shape in which October and November are placed in a higher range still within the year.
Source: Compiled by MetroEngines Research and the HotelBank Editorial Team.
Viewed across years, estimated settled ADR for Fukuoka business hotels takes the shape of stepping up toward autumn in both 2025 and 2026. In 2025 it rose from ¥9,972 in September to ¥10,450 in October and ¥12,368 in November. In 2026, after finalized values for January through July all came in above the prior-year months, current estimates from August onward are placed in a higher range: ¥12,693 in September, ¥14,292 in October, and ¥14,362 in November. Hojoya can be seen as an event positioned at the entrance to this run-up section in which prices lift toward autumn.
For revenue managers running business and city hotels in Fukuoka — implications and an action plan
(1) A demand assumption that lumps the “seven-day festival period” together diverges from the actual market. At the 45-days-out cross-section, the days running above are the three of Friday September 11, Saturday September 12, and Sunday September 13, at +4.1pt / +3.8pt / +1.8pt for business hotels. From Monday, September 14 the difference disappears or reverses; Thursday, September 17 is −3.2pt, and the closing day of Friday, September 18 runs 5.0pt below the normal Friday. If your property applies a uniform demand assumption or a uniform floor price across the “Hojoya period,” there is room to break it back down by day against the fact that the market is pricing in three days: Friday, Saturday and Sunday.
(2) The weekend upside appears as the thickness of the layer of properties holding no inventory. The sellout rate for Saturday, September 12 is 26.6% for business hotels (normal Saturday 18.0%) and 38.9% for city hotels (25.0%). Market inventory for that day has built thinner than on a normal Saturday. If your property is tracking that same date at the same booking pace and the same pricing as a normal Saturday, it is worth checking whether you are failing to capture the differential the market is pricing in.
(3) Treat festival-period weekdays as “late days,” not “weak days.” Tuesday, September 15 sits 1.6pt below the normal Tuesday on level, but its build over the six days from 45 to 37 days out is 2.6pt against the normal Tuesday’s 1.5pt. Cutting price early on the basis of a low level alone means taking demand that is catching up at a discount. Judgments are better made on two axes: level and recent pickup.
(4) Hold the price yardstick at the market’s estimated settled ADR range. For the finalized month of July 2026, Fukuoka business hotels were at ¥10,400 (+3.6% year on year) and city hotels at ¥16,600 (+3.1%). September is currently estimated in a range of ¥12,700 for business hotels and ¥19,000 for city hotels. If your September settings remain well below that range, then before the question of event day or not, it is worth confirming consistency with the market level.
| Time frame | Action | Trigger (figures from this article) | Objective |
|---|---|---|---|
| Today – this week | Carve Friday September 11, Saturday September 12 and Sunday September 13 out of the “festival period” and review settings day by day as three independent dates | If the market’s business hotels run +4.1pt / +3.8pt / +1.8pt above on those three days while your property’s same three days remain at booking levels equal to a normal weekend | Concentrate operating resources on the three days where upside is confirmed |
| Today – this week | If a uniform event assumption is applied to September 14 (Mon) through September 18 (Fri), release it and return those dates to the same framework as the same weekdays in a normal week | If the market’s September 17 (Thu) is 3.2pt and September 18 (Fri) is 5.0pt below the normal equivalents while your property maintains a higher floor on festival treatment | Avoid losing opportunity on days where demand has not materialized |
| Within two weeks | Overlay your property’s remaining-inventory path for September 12 with the path for the normal Saturday, September 5 at the same remaining days | If the market’s business hotels built 2.6pt over the 11 days from 45 to 34 days out (normal Saturday 1.6pt over the same window) while your property’s build over the same period stays at normal-Saturday levels | Detect divergence from the market at an early stage |
| Within two weeks | Compare your property’s average September settings against the market’s estimated settled ADR range | If your September settings remain well below the market’s current estimates (business ¥12,700 / city ¥19,000) | Align the level for the month as a whole before addressing event days |
| Toward next month | Shift to managing prices for festival-period weekdays (September 15–17) on recent pickup rather than on level | If the two-axis divergence observed in the market — September 15 running 1.6pt below the normal Tuesday on level while leading on pickup at 2.6pt against 1.5pt — also appears at your property | Avoid taking late-arriving demand at a discount |
| Toward next month | Rather than closing September out on its own, position it as the starting point of a price-revision calendar running into October and November | If the market’s business hotel current estimates show the step-up shape of ¥12,693 in September → ¥14,292 in October → ¥14,362 in November | Use September as the run-up toward the autumn step-up in level |
Source: Compiled by MetroEngines Research and the HotelBank Editorial Team.
How large is the cross-section gap in money terms — reading it as a unit conversion
Up to this point, occupancy and price have been lined up separately. To place them on the same footing, and using only the values confirmed in the body text, apply the unit conversion exactly as defined: estimated RevPAR equivalent = estimated settled ADR × estimated OCC. This is not a forecast of where the month will land; it is nothing more than a restatement of two numbers already presented above, multiplied together. Because estimated OCC is on an OTA-listed inventory basis and runs higher than actual room occupancy, the amounts below should be read not as absolute levels but as a scale for relative comparison between cross-sections.
| Case | Assumption | Estimated OCC | Estimated RevPAR equivalent | vs. pessimistic | Source of the figure (body text) |
|---|---|---|---|---|---|
| Pessimistic | The level at the 45-days-out cross-section becomes the final level as is | 81.3% | ¥10,319 | — | Estimated OCC at the 45-days-out cross-section for the opening day, Saturday, September 12 |
| Mid | Landing at the monthly average level of the most recent elapsed month (July 2026) | 91.8% | ¥11,652 | +¥1,333 | Monthly average estimated OCC for Fukuoka Prefecture business hotels in July 2026 |
| Optimistic | Landing at the Saturday average level of the most recent elapsed month | 95.9% | ¥12,173 | +¥1,854 | Saturday average estimated OCC in July 2026 |
For Saturday, September 12, if estimated OCC stays at the 81.3% of the 45-days-out cross-section (September 12, 2026, 45 days before the stay date), the estimated RevPAR equivalent is ¥10,319. If it builds to the 91.8% monthly average of the most recent elapsed month, July 2026 (July 2026, Fukuoka Prefecture business hotels), it becomes ¥11,652; at that month’s Saturday average of 95.9% (July 2026, Saturday average), ¥12,173. The gap between the 45-days-out cross-section and the recently achieved level is 10.5pt, or ¥1,333 in money terms — far larger than the opening-day upside (+3.8pt, equivalent to ¥482). The 3.8pt at 45 days out is not “a settled gap” but merely “a gap in progress at this point” — the reading advanced in the body text holds up in money terms as well.
| Estimated settled ADR \ Estimated OCC | 77.5% Normal Sat 9/5, 45 days out | 81.3% Opening day 9/12, 45 days out | 88.1% July 2026 Monday average | 91.8% July 2026 monthly average | 95.9% July 2026 Saturday average |
|---|---|---|---|---|---|
| ¥10,382 July 2026, finalized | ¥8,046 | ¥8,441 | ¥9,147 | ¥9,531 | ¥9,956 |
| ¥11,646 August 2026, current estimate | ¥9,026 | ¥9,468 | ¥10,260 | ¥10,691 | ¥11,169 |
| ¥12,693 September 2026, current estimate | ¥9,837 | ¥10,319 | ¥11,183 | ¥11,652 | ¥12,173 |
| ¥14,292 October 2026, current estimate | ¥11,076 | ¥11,619 | ¥12,591 | ¥13,120 | ¥13,706 |
| ¥14,362 November 2026, current estimate | ¥11,131 | ¥11,676 | ¥12,653 | ¥13,184 | ¥13,773 |
It can also be read in reverse. The September current estimate of ¥12,693 is 22.3% above the ¥10,382 of the finalized month of July 2026. To cancel out that price differential on the occupancy side alone would require giving up 18.1pt from the 81.3% at the 45-days-out cross-section (September 12, 2026, 45 days before the stay date) — roughly 4.8 times the 3.8pt opening-day upside. Capturing in full the upside the market is pricing into the three days of September 11–13 therefore returns more per unit of effort than pulling the price range well below the market level in order to build volume. Note that Tables 3 and 4 are composed solely of multiplications of figures already stated in the body text and contain no new measurements or forecasts.
Summary — three yardsticks for measuring event demand
What examining Hojoya 2026 at the 45-days-out cross-section yields is three yardsticks that can be reused well beyond this particular festival.
First, measure by “day-of-week pairs,” not by “festival period.” Line up a day in the festival week against the same weekday in the immediately preceding normal week, both at the same remaining-days cross-section. Without this step, day-of-week effects and event effects mix together, producing the misreading that all seven days carry demand. For Fukuoka business hotels, upside was confirmed on only three days — Friday, Saturday and Sunday — while Thursday ran 3.2pt below. As an example of the same procedure applied to a different festival, Yamagata Hanagasa 2026: Demand Settled 45 Days Out, +9.6pt vs Normal is also worth consulting.
Second, separate level from pickup. The height of the cross-section shows “how much has come in so far”; pickup shows “whether it is coming in now.” Festival-period weekdays trailed the normal week on the former and led on the latter. Holding these two axes avoids the decision to cut price purely on the basis of a low level.
Third, read thin inventory as a layer of properties. The sellout rate for Saturday, September 12 was 26.6% for business hotels and 38.9% for city hotels — a thicker layer holding no inventory than on a normal Saturday. When an average occupancy rate moves by a few points, the right response differs depending on whether the composition is “all properties filled a little” or “some properties ran out of inventory.”
Note that this article is based on observations from 45 days before the stay date through the most recent reading; stay dates from September 19 onward fall outside the observation window and are not covered. Demand for the week after the festival will need to be checked once those dates enter the observation window.
About the data
| Item | Detail |
|---|---|
| Definition of estimated OCC | OTA-listed inventory-based occupancy = 100 − 100 × OTA-listed remaining rooms ÷ total rooms. It is an estimate based on how listed inventory is absorbed on OTAs, and differs in definition from actual room occupancy (it runs higher). This article denotes it as “estimated OCC (OTA-listed inventory basis).” Months covered: September 2026 (by stay date) and July 2026 (elapsed-month actuals). |
| Booking curve | Based on observations from 45 days before the stay date through the most recent reading. The cumulative path is referred to as the “booking curve.” |
| Definition of estimated settled ADR | The transaction price level (pre-tax equivalent) estimated from OTA and other sales data (lowest-plan level × category coefficient, ensembled across multiple channels). Past months are finalized values; the current and future months are estimates based on sales to date. Median error against published operating results is 6.6%. |
| Sellout rate | The share of properties for which no listed inventory can be confirmed on OTAs and similar channels; an estimate. |
| Breakdown of N | Estimated OCC: Fukuoka Prefecture business hotels N=312–316 properties (by stay date; total rooms 42,402–43,412), of which observed properties per cross-section number 289–312. City hotels N=36 properties (total rooms 6,595), of which observed properties per cross-section number 32–36. Estimated settled ADR: business hotels N=329–341 properties, city hotels N=36–41 properties (by month). The July 2026 elapsed-month actuals cover roughly 315 properties with daily observation coverage of 97.5%. |
| Data date | Data as of August 10, 2026. Sales and inventory move daily, so the figures in this article are a snapshot at the time of retrieval. |
Source: Compiled by MetroEngines Research and the HotelBank Editorial Team.
References and sources
| Source | Referenced content |
|---|---|
| Hakozaki-gu Shrine, “Notice on the observance of the mid-autumn grand festival Hojoya” | The 2026 festival period (September 12–18), events during the period, approximately 500 stalls |
| Hakozaki-gu Shrine, “Hojoya” | The standing of Hojoya (one of Hakata’s three great festivals) |
| Kyushu Tabinet, “Hakozaki-gu Hojoya” | Event overview and venue (Hakozaki, Higashi-ku, Fukuoka City) |
■ Data sources
Estimated OCC, sellout rates and booking curves are aggregated from OTA-listed inventory data collected by MetroEngines Research & Consulting (Fukuoka Prefecture; 312–316 business hotels / 36 city hotels, by stay date). Estimated settled ADR is that firm’s sales-data estimate (monthly, January 2025 – December 2026; 301–341 business hotels / 36–41 city hotels). The festival period, events and stall count come from Hakozaki-gu Shrine’s official announcements, and the event overview from publicly available information from the Kyushu Tourism Organization. Data as of August 10, 2026.
■ Calculation assumptions
Event effects are measured with a day-of-week pairing method that compares “stay dates in the festival week” against “the same weekday in the immediately preceding normal week,” both at the same cross-section of 45 days before the stay date. This is a procedure for isolating the event effect after removing day-of-week effects and remaining-days effects; it is not proof of causation. The estimated RevPAR equivalents in Tables 3 and 4 are unit conversions following the definition “estimated settled ADR × estimated OCC” only, and the values on both axes are measured figures stated in the body text. No landing forecasts or scenario probabilities are assumed.
■ Limitations and caveats
Estimated OCC is an estimate on an OTA-listed inventory basis; it differs in definition from actual room occupancy and runs higher. Direct bookings, corporate contracts and inventory not listed on OTAs are excluded. City hotels cover only 36 properties, with 32–36 observed per cross-section, a small base in which a change in listing status at a single property can move the aggregate by several points, so the figures should be read on directional agreement rather than fine differences in level. Estimated OCC edges up retrospectively as observations accumulate, so the values here are a snapshot as of August 10, 2026. Stay dates from September 19 onward fall outside the 45-days-out observation window and are not covered. Estimated settled ADR for September 2026 is not a finalized value, and a simple comparison against the finalized value for the prior-year month does not hold.
Related Reading
- Obon T-7: Kyushu’s 31.7pt Gap — Fukuoka 73.0%, Kagoshima 41.3%
- Fukuoka Settled ADR +10.9% in H1 2026 While Osaka Falls 32.8% in June
- Fukuoka Hotel Supply 2026-2028: ~1,000 Rooms/Year in Hakata & Tenjin
- Yamagata Hanagasa 2026: Demand Settled 45 Days Out, +9.6pt vs Normal
- Aomori Nebuta 2026: 97.4% Sold 45 Days Out, Post-Festival +14pt
- Owara Kaze no Bon 2026: 85.0% OCC on 3 Weekdays, 45 Days Out
- Awaodori 2026: 98.8% Sold 45 Days Out — 39.4pt Over Normal Weekends