

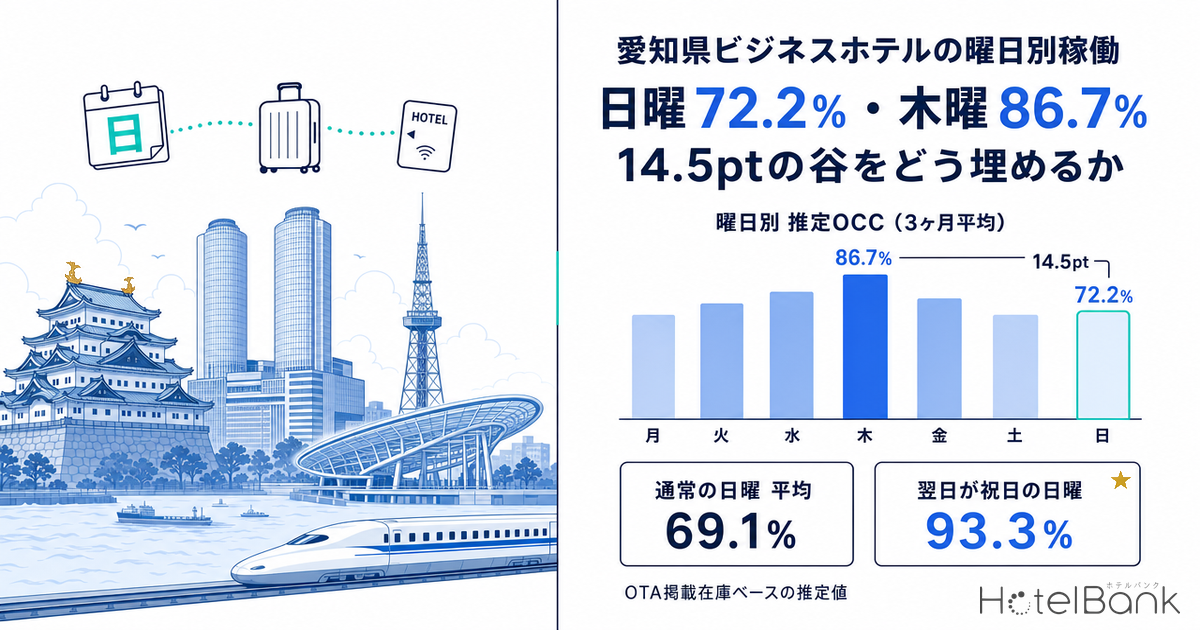
Averaging the estimated occupancy of business hotels in Aichi Prefecture (based on OTA-listed inventory) by day of week, using observations taken just before each stay date, gives 86.7% on Thursdays versus 72.2% on Sundays across June–August 2026 — a gap of 14.5pt. Breaking the 13 Sundays down one by one, the “ordinary Sundays” followed by a working day average just 69.1%, while July 19, whose following Monday was a public holiday, reached 93.3%, the highest of any day of the week. Sunday is not inherently weak; Sunday is strong only in weeks that give guests a reason to stay that night. This article extracts the day-of-week pattern from daily data on 165–175 business hotels in Aichi and turns demand creation for Sunday and Monday nights into a practical revenue management (RM) playbook.
Scope: Aichi Prefecture, business hotels, N=165–175 properties (25,340–26,025 rooms, based on listings on major booking sites). Price figures in this article are Estimated Settled ADR (the estimated transaction price level derived from OTA and other sales data, tax-excluded equivalent); occupancy figures are estimates based on OTA-listed inventory. Definitions are at the end of the article. Data as of September 15, 2026.
- — Thursday 86.7%, Sunday 72.2%: a 14.5pt gap: Day-of-week averages of lead-time-1-day observations across the 92 days of June–August 2026 (N=165–175 properties). Tuesday–Thursday average 85.0%, and the trough is concentrated on Sunday.
- — There is more than one kind of Sunday: The 11 “ordinary Sundays” followed by a weekday averaged 69.1%; the 2 Sundays followed by a day off averaged 89.2%, a 20.1pt spread. July 19 (the day before Marine Day) hit 93.3%, the highest of any day of the week.
- — Sunday is not a day to fight over with price cuts: The sold-out property rate was 23.3% on Saturdays versus 11.5% on Sundays (7.5% on ordinary Sundays). Few properties in the market sell out, so there is little share to take in the first place.
- — Holiday weekends do not fill the Monday trough: Monday, July 20 — a public holiday — came in at 73.5%, below the three-month Monday average of 77.3%. Long weekends lift Sunday but not Monday.
- — Rates are running below last year: Finalized Estimated Settled ADR was −0.1% YoY in June, −1.2% in July and −3.6% in August. In our illustrative case, a 10% Sunday rate cut needs +8.0pt of occupancy just to hold RevPAR.
Estimated OCC by Day of Week — Thursday 86.7%, Sunday 72.2%, a 14.5pt Gap
First, the ground rules. What we examine here is estimated OCC (based on OTA-listed inventory) observed the day before each stay date (lead time of 1 day) — the snapshot closest to each night’s final sales position. The period covers June, July and August 2026 (92 days in total). We do not compute year-over-year comparisons: the daily series for this category and area has less than two years of history, so like-for-like prior-year values are not available. This article is therefore not about “how this year compares with last year” but about the pattern of which days of the week leave inventory unsold.
The three-month day-of-week averages rank as follows: Thursday 86.7% → Wednesday 85.2% → Saturday 84.0% → Tuesday 83.2% → Friday 82.1% → Monday 77.3% → Sunday 72.2%. Aichi’s business hotel market concentrates demand on the three midweek days (Tuesday–Thursday average 85.0%), eases on Friday, recovers on Saturday and falls to its lowest point on Sunday. This is a typical shape for a market driven by business travel, but the notable detail is that Friday (82.1%) is lower than Saturday (84.0%). Rather than a uniformly strong two-day weekend, it is in effect a “Saturday-only weekend.” This shape, in which Friday never fully joins the weekend, has been observed in other prefectures too — in Kagoshima business hotels, for example, occupancy drops 8.1pt from 74.9% on Thursday to 66.8% on Friday.
Source: Compiled by HotelBank Editorial Team from MetroEngines Research
By month, August posted the highest monthly average of the three at 82.5%, a period that includes Obon (August 8–16). Isolating the nine days of Obon week alone gives an average of 82.0% — surprisingly, not much different from the month as a whole. In fact, the 22 days excluding Obon week averaged 82.7%, slightly above the full-month figure. In other words, August’s strength came not from an Obon boost but from strong weekdays. Excluding Obon week, August Wednesdays reached 89.0% and Thursdays 88.9%, both above the same weekdays in June and July.
| Day | Jun | Jul | Aug | Aug (excl. Obon week) |
3-month avg. | Sold-out rate (3-month avg.) |
|---|---|---|---|---|---|---|
| Mon | 75.4% | 77.0% | 79.4% | 78.1% | 77.3% | 10.7% |
| Tue | 80.9% | 82.8% | 86.6% | 87.2% | 83.2% | 15.1% |
| Wed | 84.4% | 83.7% | 87.9% | 89.0% | 85.2% | 18.0% |
| Thu | 86.5% | 85.7% | 87.9% | 88.9% | 86.7% | 20.4% |
| Fri | 82.7% | 81.4% | 82.4% | 81.8% | 82.1% | 14.4% |
| Sat | 84.5% | 85.1% | 82.7% | 83.6% | 84.0% | 23.3% |
| Sun | 67.5% | 75.4% | 73.5% | 71.7% | 72.2% | 11.5% |
| Monthly avg. | 80.1% | 81.8% | 82.5% | 82.7% | 81.5% | — |
Scope: Aichi Prefecture, business hotels, N=165–175 properties. Sold-out property rate = share of properties with no listed inventory visible on OTAs and other channels for that date (estimated). Source: Compiled by HotelBank Editorial Team from MetroEngines Research
Look at the sold-out rate column as well. On Saturdays (23.3%) and Thursdays (20.4%), around one in five properties sells through its inventory, whereas Sundays reach only 11.5% and Mondays 10.7%. On Sundays and Mondays the market is not only thin overall — very few properties sell out at all. Sunday vacancies, in other words, are not the result of a handful of strong hotels absorbing demand; demand itself is shrinking across the whole area. The fact that both numbers are low at the same time tells us that price cuts aimed at stealing share from competitors have little traction on these days.
Breaking Down 13 Sundays One by One — Ordinary Sundays 69.1%, Sundays Before a Day Off 89.2%
Day-of-week averages are convenient, but some information disappears the moment you average. Laying out the 13 Sundays from June 7 to August 30 individually makes it clear that Sunday is not uniformly weak.
Source: Compiled by HotelBank Editorial Team from MetroEngines Research
Eleven of the 13 were “ordinary Sundays” followed by a normal working Monday; these 11 averaged 69.1%, with an average sold-out rate of 7.5%. The low was 63.4% on July 5. The other two days were different. July 19 was the middle day of a three-day weekend, with July 20 being Marine Day (the third Monday of July), and reached 93.3%; August 9, at the start of the Obon period, reached 85.2%. These two days averaged 89.2%, a gap of 20.1pt over ordinary Sundays. The sold-out rate was 49.7% on July 19 and 18.2% on August 9 — inventory cleared in an entirely different way from ordinary Sundays (7.5%).
The interpretation is simple: in Aichi’s business hotel market, Sunday demand is largely determined by whether the next day is a day off. A Sunday before a working day is the eve before business travel starts and also the day leisure travelers head home, so both troughs overlap. When the next day is a day off, Sunday functions as the second night of a weekend stay and rises above even Thursday and Saturday levels. Sunday is not structurally weak; rather, a rational reason to stay on a Sunday night arises only a few times a year. Separately, a cross-section of Aichi covering May–July 2026, aggregated from actual results for completed months across a broader population (N=272–298 properties), showed business hotels at 96.5% on Sundays before a public holiday versus 77.5% on ordinary Sundays, a 19.0pt gap (see Aichi Day-of-Week OCC: Sunday 12.6pt Below Saturday on 92-Day Data). Because the population and observation basis differ, the levels cannot be compared directly, but splitting Sundays into two types leads to the same conclusion.
Monday is easier to understand through the same lens. Its three-month average of 77.3% is the second lowest after Sunday, but interestingly, Monday, July 20 (Marine Day, a public holiday) came in at 73.5%, actually below the Monday average. The last day of a long weekend is a “going home” day, not a “staying” day. In contrast to the preceding Sunday’s 93.3%, three-day weekends add demand on Sunday but not on Monday. The Monday trough, then, cannot be filled by public holidays. Monday, August 31 (73.0%) and Monday, June 1 (70.9%) were at similar levels, showing that Monday weakness is consistent regardless of whether it falls at the start or end of the month. Sunday and Monday dipping on consecutive days is not unique to Aichi: business hotels in Toyama show the same sequence of back-to-back troughs, at 73.9% on Sunday and 79.1% on Monday.
The Latest Two Weeks (September 1–14) Show the Same Day-of-Week Order
To check whether this is a summer-specific pattern, we applied the same method to the most recent two weeks with complete observations, September 1–14 (two of each weekday). The overall average was 84.8%, higher than June–August, with Thursday 87.8%, Saturday 87.4%, Wednesday 86.3%, Monday 85.7%, Tuesday 83.7%, Friday 82.8% and Sunday 79.5%. Levels are higher across the board, but Sunday remains the lowest day of the week. Its gap to the overall average is 5.3pt, narrower than in June–August (Sunday 72.2% versus a three-month average of 81.5%, a 9.3pt gap). However, with only two days per weekday, the sample is too small to absorb event effects on individual dates, so this should be read with caution.
Rate Environment — Summer Estimated Settled ADR Below the Prior Year in All Three Months
Before turning the day-of-week findings into action, let us check price levels in the same market. Because Estimated Settled ADR is canonical at the monthly level, we do not break it down by day of week here and look only at year-over-year changes between finalized values. Finalized Estimated Settled ADR for Aichi business hotels was ¥7,330 in June 2026 (N=324 properties), ¥7,491 in July (N=323) and ¥7,852 in August (N=319). The prior-year figures were ¥7,339 (N=327), ¥7,584 (N=327) and ¥8,149 (N=324) respectively, giving YoY changes of −0.1% in June, −1.2% in July and −3.6% in August.
Estimated Settled ADR (tax-excluded equivalent, finalized values). For 2026, months through August are finalized. Source: Compiled by HotelBank Editorial Team from MetroEngines Research
| Stay month | 2025 Est. Settled ADR |
N | 2026 Est. Settled ADR |
N | YoY |
|---|---|---|---|---|---|
| June | ¥7,339 | 327 | ¥7,330 | 324 | −0.1% |
| July | ¥7,584 | 327 | ¥7,491 | 323 | −1.2% |
| August | ¥8,149 | 324 | ¥7,852 | 319 | −3.6% |
Scope: Aichi Prefecture, business hotels. N = number of properties included in the Estimated Settled ADR calculation. Comparisons are between finalized months. Source: Compiled by HotelBank Editorial Team from MetroEngines Research
The annual shape is also worth noting. In 2025, Estimated Settled ADR bottomed at ¥6,924 in January and had three peaks — ¥8,035 in May, ¥8,149 in August and ¥8,416 in November — with troughs in June (¥7,339) and December (¥7,681). 2026 is tracing the same shape, with ¥7,774 in January, ¥8,087 in March and ¥8,192 in May. In short, the seasonal shape is the same as last year; only the level has slipped slightly below the prior year heading into summer. It is worth noting that August is where the days with surplus inventory by day of week and the month with below-prior-year rates overlap.
For Revenue Managers of Business Hotels in Aichi — Implications and Action Plan
1. The Sunday trough is a day to “bring in demand,” not a day to “fight over share with discounts”
The Sunday sold-out rate averaged 11.5% over three months, and just 7.5% on ordinary Sundays. When fewer than one in ten properties in the market sells out, cutting rates leaves little share in the market to capture. Treat Sunday as a day to ask first whether you can create a reason to stay that night, rather than trying to win guests from other hotels on price.
2. Redefine “Sunday is weak” as “Sunday before a weekday is weak”
Ordinary Sundays averaged 69.1%, while Sundays before a day off averaged 89.2% (July 19: 93.3%; August 9: 85.2%), a 20.1pt spread. If your budget or forecast applies a uniform day-of-week factor, simply splitting Sundays into two types based on whether the next day is a day off will change both accuracy and the priority of your actions. Only a handful of such dates appear on the calendar each year, which makes them worth preparing for separately.
3. Public holidays do not fill the Monday trough
Monday, July 20, a public holiday, came in at 73.5%, below the three-month Monday average of 77.3%. Long weekends lift Sunday but not Monday. Monday inventory should be built not on long weekends but either on extended stays from Sunday or on the start of the business-travel week. Conversely, the fact that Sunday (72.2%) and Monday (77.3%) form back-to-back troughs means this is the only stretch of the week where a two-night package can be designed.
4. Decide “where to recover” in light of the rate environment
Finalized Estimated Settled ADR was −0.1% in June, −1.2% in July and −3.6% in August, with the shortfall versus the prior year widening into summer. Meanwhile, Tuesday–Thursday averaged 85.0% occupancy with a 17.8% sold-out rate, so demand is solid. Make the division of roles explicit in your weekly rate calendar: protect rate on the strong midweek days, and pursue occupancy and length of stay on the thin Sundays and Mondays.
| Sunday rate | OCC unchanged | OCC +3pt | OCC +6pt | OCC +9pt | OCC +12pt | OCC increase needed for RevPAR-neutral |
|---|---|---|---|---|---|---|
| Unchanged | ¥5,669 Baseline | ¥5,905 +236 | ¥6,140 +471 | ¥6,376 +707 | ¥6,611 +942 | — |
| −5% | ¥5,386 −283 | ¥5,609 −60 | ¥5,833 +164 | ¥6,057 +388 | ¥6,281 +612 | +3.8pt |
| −10% | ¥5,102 −567 | ¥5,314 −355 | ¥5,526 −143 | ¥5,738 +69 | ¥5,950 +281 | +8.0pt |
| −15% | ¥4,819 −850 | ¥5,019 −650 | ¥5,219 −450 | ¥5,419 −250 | ¥5,620 −49 | +12.7pt |
[Illustrative case] Starting point uses market values (Sunday estimated OCC three-month average 72.2%; Estimated Settled ADR, finalized August 2026, ¥7,852, tax-excluded equivalent). RevPAR = simple product of Estimated Settled ADR × estimated OCC; your own costs, channel mix and room mix are not considered. No results are guaranteed. Source: Compiled by HotelBank Editorial Team from MetroEngines Research
The right-hand column of this table is what matters in practice. Cutting the Sunday rate by 5% requires an additional +3.8pt of occupancy to maintain RevPAR; a 10% cut requires +8.0pt, and a 15% cut +12.7pt. Put differently, a cut of 10% or more only pays off if Sunday’s 72.2% is pushed toward Thursday’s 86.7%. Yet only 11.5% of properties in the market sell out on Sundays (7.5% on ordinary Sundays). On a day when there is almost no inventory left in the market to win through discounts, generating +8pt through price alone is unrealistic. This asymmetry is the rationale for shifting Sunday tactics away from price and toward extended-stay design and demand creation.
The action plan below maps these implications onto a timeline. Each decision trigger is tied to figures presented in this article. No results are guaranteed; please use it as a reference and select actions in light of your own property’s circumstances.
| Timeframe | Action | Decision trigger | Objective |
|---|---|---|---|
| Today to this week | Re-sort your property’s last three months of results by day of week and re-aggregate Sundays into two series: “next day is a weekday” and “next day is a day off” | If your Sundays are managed with a uniform day-of-week factor | Visualize the gap between the market pattern (ordinary Sundays 69.1% / before a day off 89.2%) and your property |
| Today to this week | Review how Sunday and Monday inventory is released, and confirm that weekday-type plans are not dropping off listings on Sundays | If your Sunday occupancy is below the market’s 72.2% and you had no sold-out days in the month | Separate missed sales and inventory-design issues from pricing issues |
| Within two weeks | Design a Sunday check-in, two-night (Tuesday check-out) extended-stay product and sell it together with the Monday trough | If Sunday (market 72.2%) and Monday (market 77.3%) are also back-to-back troughs at your property | Fill the only stretch of the week where a two-night design works more efficiently than stacking single nights |
| Within two weeks | Benchmark your Tuesday–Thursday rates against the market’s Estimated Settled ADR (finalized August ¥7,852, tax-excluded equivalent) and your own price band | If your weekday rates remain below the market’s Estimated Settled ADR level while occupancy is around the market’s 85.0% | Reduce rate leakage on the three days with the strongest demand |
| Toward next month | Identify on the calendar the Sundays followed by a day off and set inventory and pricing for them in advance, separately from ordinary Sundays | If your pickup for those dates is only keeping pace with ordinary Sundays | Avoid selling out the few 89.2%-level days a year at ordinary Sunday rates |
| Toward next month | Rebuild your annual rate-change calendar around the monthly seasonal shape (January trough; May, August and November peaks) | If your annual rates do not move in line with the monthly peaks and troughs | Set things up so you can verify, with next year’s finalized same-month values, whether the summer shortfall versus the prior year (August −3.6%) is a structural price erosion or a seasonal factor |
Source: Compiled by HotelBank Editorial Team from MetroEngines Research
Summary — Three Yardsticks for Reading Day-of-Week Data
The day-of-week pattern drawn from Aichi’s business hotel market can be reproduced for other areas using the same method. There are three yardsticks to take away.
First, read day-of-week averages together with the sold-out property rate. Even if occupancy is low, a high sold-out rate means there is room for share to shift within the market. On a day like Sunday, when both are low — 72.2% occupancy and an 11.5% sold-out rate — there is no real arena for competing on price. Second, split days of the week by whether the next day is a day off. The single label “Sunday” contains both 69.1% days and 89.2% days. The moment you average them, you risk selling out the few high-demand days each year at ordinary rates. Third, long weekends lift Sunday but not Monday. The holiday Monday’s 73.5% was below the Monday average of 77.3%. The Monday trough is not filled as a by-product of long weekends; it has to be pursued separately through extended-stay design or the start-of-week business travel ramp-up.
Applying these three yardsticks to your own day-of-week results should reveal that the days you lumped together as “weak days” actually split into days to compete on price and days to bring in demand.
About the Data
• Definition of estimated OCC (based on OTA-listed inventory): OTA-listed-inventory occupancy = 100 − 100 × OTA-listed remaining rooms ÷ total rooms. Covers a fixed cohort of properties that list at least 30% of their total rooms on OTAs (the same set of properties for each stay date; the property count is stated in this article). It is an estimate based on the sell-through of inventory sold on OTAs and differs in definition from actual room occupancy (rooms not listed are counted as sold, so it tends to run higher).
• Observation window: Booking curves are based on observations from 45 days before the stay date up to the most recent date. The day-of-week figures in this article use only the values observed one day before the stay date (lead time of 1 day). The period covers June, July and August 2026 (92 days in total), plus September 1–14, 2026 (14 days) as a supplement. Observation coverage is 100% for all dates.
• Sold-out property rate: The share of properties with no listed inventory visible on OTAs and other channels for the stay date (estimated).
• Definition of Estimated Settled ADR: The transaction price level (tax-excluded equivalent) estimated from OTA and other sales data (lowest-plan price level × segment-specific factor, ensembled across multiple channels). Past months are finalized values; current and future months are estimates based on the current sales position. Median error against published operating results is 6.6%. This article only uses YoY comparisons between finalized values.
• Breakdown of N: Estimated OCC covers Aichi Prefecture business hotels, N=165–175 properties (25,340–26,025 rooms, based on listings on major booking sites; the number of properties in the fixed cohort varies by stay date). Estimated Settled ADR covers Aichi Prefecture business hotels, N=319–327 properties (varies by month). YoY comparisons are not made for estimated OCC because the daily series for this category and area has less than two years of history.
• Data as of September 15, 2026. Sales positions and inventory change daily, so the figures in this article are a snapshot as of the retrieval date.
References and Sources
• Cabinet Office, Government of Japan, “About National Holidays” (国民の祝日について) https://www8.cao.go.jp/chosei/shukujitsu/gaiyou.html (used to confirm July 20, 2026 = Marine Day and August 11 = Mountain Day)