

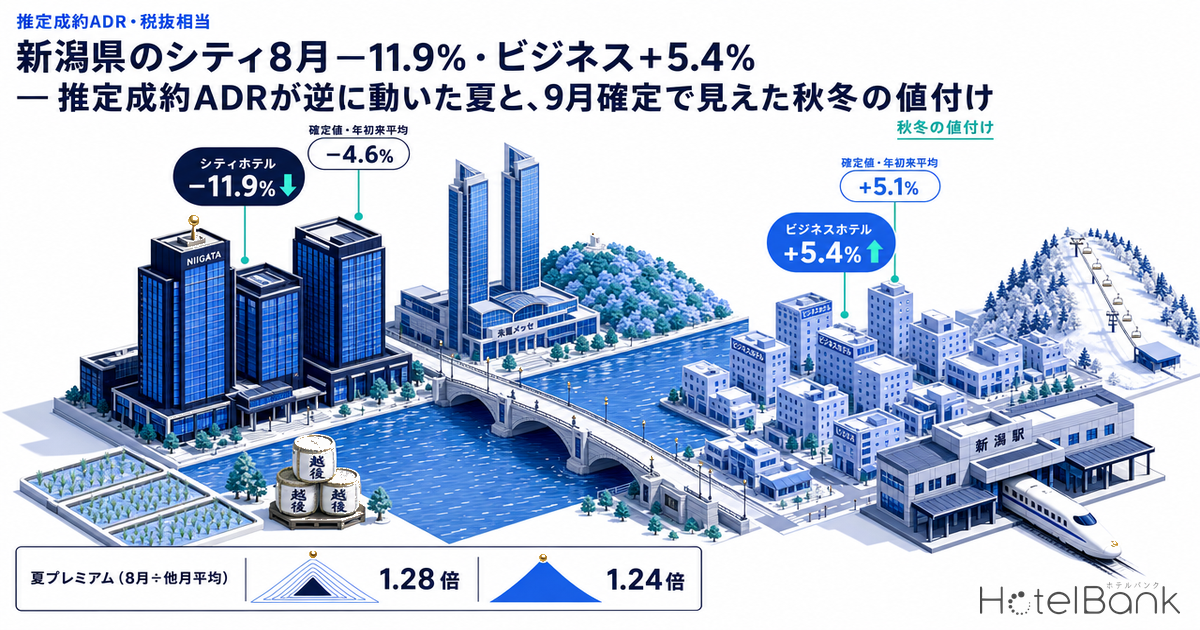
Comparing confirmed months year on year, the settled ADR estimate (tax-excluded equivalent) for city hotels and business hotels in Niigata Prefecture split in opposite directions in August 2026: city hotels came in at ¥10,400, down 11.9% YoY, while business hotels came in at ¥8,400, up 5.4% — same prefecture, same summer, opposite signs. The divergence is not an August-only event. Across the nine confirmed months of January–September 2026, business hotels were up in eight months (January–September average +5.1%) and city hotels were down in eight (average −4.6%), a pattern that has held since the start of the year. This article reads those nine months of confirmed data by hotel type, then uses the change in the height of the August peak and the inventory sell-through over the September five-day holiday to set out, by hotel type, what to review in pricing for the autumn foliage, ski and year-end/New Year seasons.
About the data — Coverage: city hotels in Niigata Prefecture N=18 properties; business hotels N=124–135 properties (varies by month). The price metric in this article is the settled ADR estimate (the transacted price level estimated from OTA and other sales data, tax-excluded equivalent); occupancy is an estimate based on OTA-listed inventory. Both are defined at the end of the article. Data as of: October 14, 2026.
- — Niigata Prefecture’s settled ADR estimate (tax-excluded equivalent, confirmed values) averaged +5.1% for business hotels and −4.6% for city hotels over January–September 2026. August split the same way: business ¥8,383 (+5.4%), city ¥10,355 (−11.9%).
- — The summer premium (August ÷ average of other months) held at 1.24x for business hotels but narrowed from 1.41x to 1.28x for city hotels. With only N=18 city hotels, read the direction by quarter (April–June −7.0%, July–September −7.1%) rather than by single month.
- — Estimated business-hotel OCC for Saturday, November 21 — the first day of the three-day weekend — stood at 67.4% with 39 days to go (as of October 13, 2026), about 6pt above a regular Saturday. A price calendar that separates the first day from the middle and later days is the effective approach.
Nine Confirmed Months YoY — Business Hotels Gained from January, City Hotels Slipped from April
First, the month-by-month YoY comparison of confirmed months. The settled ADR estimate for business hotels opened the year above the prior year — January ¥6,200 (+4.9%), February ¥6,400 (+4.7%), March ¥6,500 (+4.0%) — eased slightly in April ¥6,600 (+1.9%) and May ¥7,200 (+3.2%), then reached double-digit growth in June at ¥6,800 (+10.8%). July at ¥6,700 (−1.1%) was the only negative month of the nine, but August recovered to ¥8,400 (+5.4%) and September posted the largest gain of the nine months at ¥7,500 (+12.6%). By quarter, growth was +4.5% in January–March, +5.2% in April–June and +5.5% in July–September, edging slightly higher as the year progressed.
City hotels moved the other way. They started with small declines in January ¥7,500 (−0.8%) and February ¥7,500 (−3.1%); March at ¥8,500 (+8.1%) was the only positive month of the nine. From April onward they fell below the prior year for six consecutive months: April ¥8,400 (−10.0%), May ¥8,700 (−3.3%), June ¥7,700 (−7.6%), July ¥8,000 (−5.3%), August ¥10,400 (−11.9%) and September ¥8,500 (−2.2%). By quarter, January–March was +1.4% against −7.0% in April–June and −7.1% in July–September — the level appears to have stepped down a notch from spring onward. This divergence was already visible in the first half; we confirmed the same pattern using January–July confirmed data in Niigata Settled ADR H1 2026: Business +10.8% in June, City −7.6%.
| Stay month | Business 2025 | Business 2026 | YoY | City 2025 | City 2026 | YoY |
|---|---|---|---|---|---|---|
| Jan | ¥5,958 | ¥6,247 | +4.9% | ¥7,559 | ¥7,496 | −0.8% |
| Feb | ¥6,096 | ¥6,384 | +4.7% | ¥7,708 | ¥7,472 | −3.1% |
| Mar | ¥6,248 | ¥6,498 | +4.0% | ¥7,844 | ¥8,478 | +8.1% |
| Apr | ¥6,429 | ¥6,554 | +1.9% | ¥9,387 | ¥8,444 | −10.0% |
| May | ¥6,954 | ¥7,180 | +3.2% | ¥8,982 | ¥8,686 | −3.3% |
| Jun | ¥6,182 | ¥6,849 | +10.8% | ¥8,327 | ¥7,694 | −7.6% |
| Jul | ¥6,818 | ¥6,740 | −1.1% | ¥8,444 | ¥7,993 | −5.3% |
| Aug | ¥7,956 | ¥8,383 | +5.4% | ¥11,759 | ¥10,355 | −11.9% |
| Sep | ¥6,626 | ¥7,462 | +12.6% | ¥8,666 | ¥8,474 | −2.2% |
| Jan–Sep average | ¥6,585 | ¥6,922 | +5.1% | ¥8,742 | ¥8,344 | −4.6% |
Settled ADR estimate (tax-excluded equivalent, confirmed values). Business N=124–135 properties, city N=18 properties. Source: MetroEngines Research; compiled by HotelBank Editorial Team
Plotted year over year, the 2026 business-hotel line runs almost entirely above the 2025 line from January through September, with the August peak also higher than last year. For city hotels, the 2026 line runs below 2025 in every month except March, with the widest gaps in April and August. The dotted lines from October onward are estimates based on current sales and provisional values reflecting the listing status of inventory still on sale, so their level will move once the months are confirmed. A straight comparison with prior-year confirmed values has to wait for month-end confirmation, and this article does not use the October-onward estimates in any YoY discussion.
Settled ADR estimate (tax-excluded equivalent) for business hotels in Niigata Prefecture, year over year. Solid = confirmed values; dotted = estimate based on current sales (subject to change). N=118–135 properties. Source: MetroEngines Research; compiled by HotelBank Editorial Team
Settled ADR estimate (tax-excluded equivalent) for city hotels in Niigata Prefecture, year over year. Solid = confirmed values; dotted = estimate based on current sales (subject to change). N=18 properties. Source: MetroEngines Research; compiled by HotelBank Editorial Team
One point that must be kept in mind is the small sample behind the city-hotel series: N=18. The settled ADR estimate is the area median, and a median across 18 properties moves easily with the composition of a few properties (renovation closures, the presence or absence of conferences and groups, shifts in sales policy). A swing from +8.1% in March to −10.0% in April is better read as including compositional effects rather than as a market-wide price change, and month-level moves of a few percent should not be used as standalone decision inputs. It is fair to read that the quarterly direction (April–June −7.0%, July–September −7.1%) is consistently downward, but the size of August’s −11.9% should not be equated with the market’s actual price cut. Business hotels, at N=124–135, show little month-to-month noise, so their monthly YoY figures can be used as a yardstick as they are.
The Height of the August Peak — City Summer Premium Fell from 1.41x to 1.28x; Business Held at 1.24x
We cannot state with certainty why the two types diverged, but looking at the height of the August peak relative to other months brings the difference between hotel types into numerical shape. Define the summer premium as August’s settled ADR estimate divided by the average of the same year’s eight other confirmed months (January–July and September). Business hotels held exactly the same peak height: 1.24x in 2025 and 1.24x in 2026. The jump from July to August actually steepened, from 1.17x to 1.24x. City hotels, by contrast, saw the summer premium shrink from 1.41x in 2025 to 1.28x in 2026, and the July-to-August jump soften from 1.39x to 1.30x. One reading is that the city-hotel YoY decline reflects both a full-year step-down in level and a smaller uplift in the peak summer month, which is why it showed up most strongly in August.
That said, August remains the highest month of the year for both types. The 2026 city figure of ¥10,400 is 1.24x the January–September average of ¥8,300, and the business figure of ¥8,400 is 1.21x its average of ¥6,900 — the summer peak still clearly exists. The question is whether the peak height can be assumed to be the same as last year. For city hotels, the fact that “pricing anchored on last August’s rate” ended up landing at a double-digit YoY decline is a lesson worth carrying into next summer. The same split — city hotels below the prior year and business hotels above it in the peak summer month — has also been observed in Hokkaido, which suggests the pattern is not unique to Niigata.
Turning to September, the business-hotel gain of +12.6% was the largest of the nine months. Behind it was the five-day holiday from Saturday, September 19 to Wednesday, September 23. Estimated OCC for business hotels in Niigata Prefecture (based on OTA-listed inventory; 43–52 properties, 5,511–6,159 rooms) reached 98.7% on Saturday the 19th, 99.0% on Sunday the 20th and 98.7% on Monday the 21st — the first three days of the holiday took the top three spots for the month. The September monthly average of 88.8% was almost the same as August’s 89.4%, but the cluster of days on which inventory nearly sold out likely pushed up the monthly transacted rate. City hotels, on the other hand, came in at ¥8,500 (−2.2%) in September, slightly below the prior year despite the same five-day holiday. Estimated OCC for city hotels is not calculated because the fixed cohort has fewer than 10 properties, so this cannot be corroborated from the occupancy side here.
By day of week, business hotels in August were highest on Wednesday (93.2%), Saturday (92.9%) and Thursday (92.5%), and lowest on Sunday (80.8%) and Monday (85.5%). In September, Saturday (94.7%), Thursday (93.1%) and Friday (91.0%) were highest, and Sunday (82.0%) and Wednesday (85.3%) were lowest. August’s lowest days were Sunday, August 16 (68.1%), Sunday, August 30 (69.8%) and Monday, August 31 (69.5%); September’s lowest were Sunday, September 27 (69.1%) and Wednesday, September 23 (69.9%), the day the holiday ended. In both months, inventory tended to remain on the Sunday–Monday after the Obon holidays and after the long weekend.
Average estimated OCC by day of week for business hotels in Niigata Prefecture (based on OTA-listed inventory). August 2026: 27–45 properties, 3,925–5,634 rooms; September: 43–52 properties, 5,511–6,159 rooms (varies by day). Source: MetroEngines Research; compiled by HotelBank Editorial Team
Yardsticks for Autumn and Winter — Last Year’s Confirmed Values and November Booking Pace
The first reference point for setting autumn and winter prices is last year’s confirmed values. The 2025 settled ADR estimate for October–December was ¥9,700 in October, ¥8,300 in November and ¥7,400 in December for city hotels; October was 1.12x September and the second-highest month of the year after August. In other words, October — when autumn foliage, leisure travel and autumn events overlap — was the second peak for city hotels. Business hotels were at ¥6,600 in October, ¥6,700 in November and ¥6,400 in December: roughly September’s level (¥6,600) carried through November before dipping slightly in December. January, which includes the New Year holidays, stood at ¥7,600 for city hotels and ¥6,000 for business hotels in 2025 — both on the low side of the year. Because ski demand is mainly captured by resort and ryokan-type properties in areas such as Yuzawa and Myoko, last year’s confirmed values indicate that winter rates for city and business hotels sit close to the annual floor.
So how is autumn 2026 moving? Because the October-onward settled ADR estimates are current-sales estimates and cannot be used for YoY comparison, we instead check the booking pace for November stay dates at business hotels (53–54 properties, 6,267–6,282 rooms), using observations from 45 days out to the most recent point. Saturday, November 21 is the first day of the three-day weekend that includes Labor Thanksgiving Day; its estimated OCC was 64.0% at 45 days out (as of October 7, 2026) and 67.4% at 39 days out (as of October 13), the highest of the four dates observed. Saturday, November 14, a regular Saturday, rose from 55.3% at 45 days out to 61.5% at 32 days out, +6.2pt — the largest pickup in the period. Wednesday, November 18, a weekday, went from 48.3% at 45 days out to 50.0% at 36 days out, and Sunday, November 22, the middle day of the long weekend, went from 55.9% at 45 days out to 57.6% at 40 days out — both +1.7pt, a gentle pace.
| Stay date | Day type | Est. OCC at 45 days out | Latest observation (days out) | Pickup |
|---|---|---|---|---|
| Sat, Nov 14 | Regular Saturday | 55.3% | 61.5% (32 days out) | +6.2pt |
| Wed, Nov 18 | Weekday | 48.3% | 50.0% (36 days out) | +1.7pt |
| Sat, Nov 21 | First day of 3-day weekend | 64.0% | 67.4% (39 days out) | +3.4pt |
| Sun, Nov 22 | Middle day of 3-day weekend | 55.9% | 57.6% (40 days out) | +1.7pt |
Estimated OCC for business hotels in Niigata Prefecture (based on OTA-listed inventory). 53–54 properties, 6,267–6,282 rooms. Observations from 45 days before the stay date to the most recent point (October 13, 2026). Source: MetroEngines Research; compiled by HotelBank Editorial Team
What these four dates show is the current state: the first day of the November three-day weekend already sits about 6pt above a regular Saturday, the middle day is at roughly the same level as a regular Saturday, and half of weekday inventory remains. Given that the first half of the September five-day holiday sold through to 98–99%, a heavy last-minute pickup for November 21 is a scenario worth preparing for. However, a sellout cannot be asserted for stay dates more than 30 days out, so here we only record the current relative positions. The same pattern — booking pace diverging by day within a long weekend — was also observed when tracking Niigata’s October three-day weekend from 45 days out, where ryokan filled up on the Saturday first.
For Revenue Managers at City and Business Hotels in Niigata Prefecture — Implications and Action Plan
1. Overlay your own YoY on the hotel-type yardstick. The market median moved +5.1% for business hotels and −4.6% for city hotels on the nine-confirmed-month average. If your property’s transacted rate over the same period moved in the same direction and by a similar amount, your pricing is in line with the market. If a business hotel is falling short of the market’s +5%, or a city hotel has sunk deeper than the market, identify the start of the gap by quarter rather than by month, and there is room to review what changed at that time (allocations, plan mix, minimum length of stay, etc.).
2. Manage the August peak by its “height,” measured YoY. The summer premium (August ÷ average of other months) held at 1.24x for business hotels and shrank from 1.41x to 1.28x for city hotels. Calculate your own August rate divided by your other-month average in the same way and set it alongside the market multiple; the starting point for next summer’s pricing then shifts from last year’s absolute rate to “other-month level × peak height.” City hotels whose multiple was well above the market’s 1.28x should check whether peak-season pricing cost them occupancy.
3. Long weekends are decided by the “first three days.” Over the September five-day holiday, estimated business-hotel OCC reached 98–99% from Saturday the 19th to Monday the 21st, then dropped to 69.9% on Wednesday the 23rd as the holiday ended. For the November three-day weekend, too, the first day — Saturday the 21st — is ahead at 67.4% with 39 days to go. Holding a separate price calendar for each day — heavier pricing on the first and middle days, and on the premise that inventory will remain on the final day and the weekday after — is an effective approach.
4. For city hotels, do not take monthly figures at face value. The market’s city-hotel series is N=18, and monthly signs flip easily. As a benchmark for your property, using the quarterly direction (April–June −7.0%, July–September −7.1%) and last year’s seasonal shape, in which October was the second peak (October ¥9,700 at 1.12x September), makes misjudgment less likely than relying on single-month YoY.
| Timeframe | Action | Decision trigger (tied to figures in this article) | Aim |
|---|---|---|---|
| Today to this week | Move the price tier for Saturday, November 21 up one step | If your booking rate for November 21 is above the market’s 67.4% (as of 39 days out) | Capture the last-minute pickup on the first day of the long weekend through rate |
| Today to this week | Price Sunday, November 22 and Monday, November 23 separately from the 21st | Given the current market position of 57.6% on the 22nd, 10pt below the first day | Fill remaining inventory on the middle and final days early |
| Within 2 weeks | Widen multi-night and early-booking allocations on November weekdays (e.g., Wednesday the 18th) | If your booking rate for November weekdays is below the market’s 50.0% (36 days out) | Protect the denominator of the monthly rate by lifting weekdays |
| Within 2 weeks | Calculate your own January–September YoY by quarter and set it beside the market | If the gap between your property and the market average (+5.1% business, −4.6% city) is 5pt or more | Identify the quarter in which the gap began |
| Next month to year-end/New Year | Set December and January base prices to match the shape of last year’s confirmed values | Last year, city December ¥7,438 / January ¥7,559 and business December ¥6,374 / January ¥5,958 were on the low side of the year | Secure a price band that does not lose occupancy at the winter floor |
| Next month to year-end/New Year | Provisionally set next August’s price as “other-month average × peak height” | If your summer premium was well above the market’s (business 1.24x, city 1.28x) | Manage peak-season pricing on a YoY basis |
Action plan based on the figures in this article. Results are not guaranteed.
Summary — Three Yardsticks for Autumn and Winter Pricing
First, the direction over the nine confirmed months. In Niigata Prefecture, the settled ADR estimate for business hotels averaged +5.1% over January–September, positive in eight of nine months, while city hotels averaged −4.6%, negative in eight — the two types entered autumn still moving in opposite directions within the same prefecture. Because city hotels (N=18) produce noisy monthly figures, read them by quarterly direction. Second, the height of the peak. The summer premium (August ÷ average of other months) held at 1.24x for business hotels and shrank from 1.41x to 1.28x for city hotels; next summer’s pricing is better managed by the multiple than by last year’s absolute rate. Third, last year’s seasonal shape. Anchor winter base prices on the confirmed values: for city hotels, October ¥9,700 was the second peak and December ¥7,400 and January ¥7,600 were the floor; for business hotels, October–November held at September’s level, with December ¥6,400 and January ¥6,000 the floor. On that basis, for the November three-day weekend — with the first day, Saturday the 21st, ahead at 67.4% with 39 days to go — there is room to approach it with a price calendar that separates the first day from the middle and later days.
About the Data
| Item | Details |
|---|---|
| Settled ADR estimate | Transacted price level (tax-excluded equivalent) estimated from OTA and other sales data (lowest-plan level × hotel-type coefficient, ensemble of multiple channels). Past months are confirmed values; current and future months are estimates based on current sales. Median error of 6.6% when checked against published operating results. YoY was calculated only between confirmed months (the same month in 2025 and 2026). |
| Estimated OCC | Occupancy based on OTA-listed inventory = 100 − 100 × OTA-listed rooms remaining ÷ total rooms. Covers a fixed cohort of properties listing at least 30% of total rooms on OTAs (the same set of properties for each stay date). This is an estimate based on the sell-through of inventory sold on OTAs and differs in definition from actual room occupancy (rooms not listed are counted as sold, so it reads high). Covered months: August and September 2026 (actuals for elapsed months) and stay dates in November 2026 (booking pace). |
| Booking curve | Based on observations from 45 days before the stay date to the most recent point. |
| Coverage | Niigata Prefecture. Settled ADR estimate: city hotels N=18 properties (confirmed months), business hotels N=124–135 properties (confirmed months, varies by month). Estimated OCC covers business hotels only: August 2026, 27–45 properties / 3,925–5,634 rooms; September, 43–52 properties / 5,511–6,159 rooms; November stay dates, 53–54 properties / 6,267–6,282 rooms. Estimated OCC for city hotels is not calculated because the fixed cohort has fewer than 10 properties. |
| Data as of | Data as of: October 14, 2026. Sales status and inventory change daily, so the figures in this article are a snapshot at the time of retrieval. |
| Source | Source: MetroEngines Research; compiled by HotelBank Editorial Team |
■ Data Sources
MetroEngines Research monthly aggregates for the Niigata Prefecture area (settled ADR estimate; city hotels N=18 properties, business hotels N=124–135 properties), and estimated OCC based on OTA-listed inventory for business hotels (daily for August and September 2026; observations from 45 days out for November 2026 stay dates). Data as of October 14, 2026.
■ Calculation Assumptions
YoY is calculated between confirmed months of 2025 and 2026; current estimates for October 2026 onward are not used for YoY. Quarterly and January–September changes are ratios of simple averages of each month’s settled ADR estimate. The summer premium is August’s settled ADR estimate divided by the simple average of the same year’s eight other confirmed months (January–July and September).
■ Limitations and Caveats
The settled ADR estimate is the area median; the city-hotel sample is small at N=18 properties, and monthly values can swing significantly with compositional changes in a few properties. Estimated OCC is based on the sell-through of OTA-listed inventory and differs in definition from actual room occupancy; it is not calculated for city hotels because the fixed cohort has fewer than 10 properties. This article does not identify the factors behind the divergence between hotel types.