

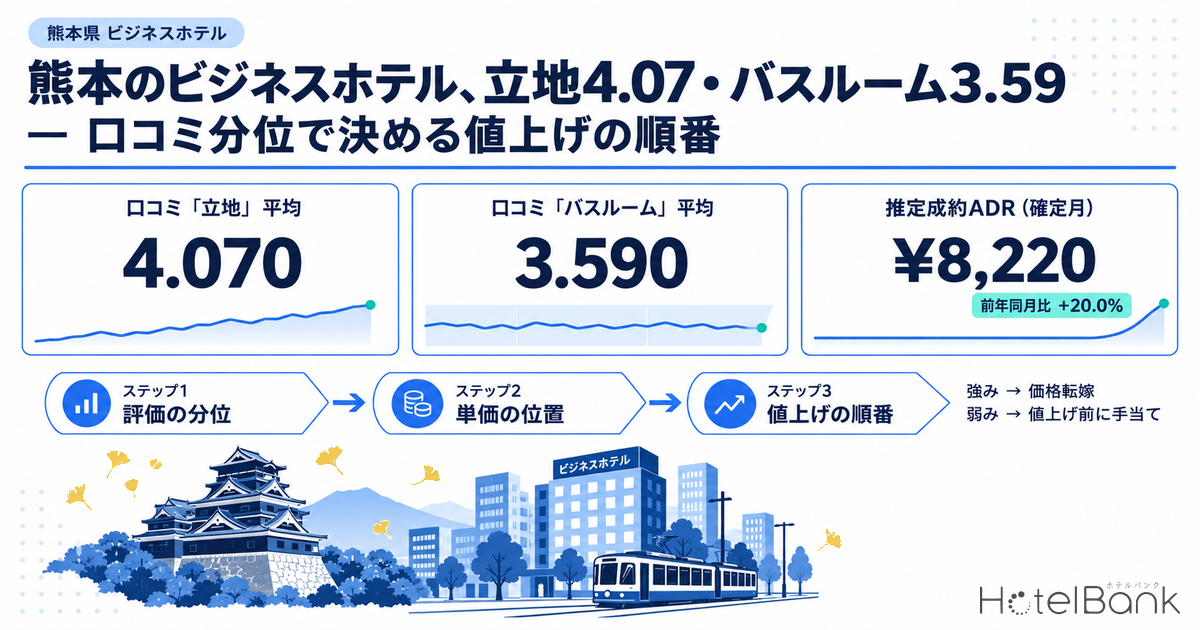
Looking item by item at the review-score baseline for business hotels in Kumamoto Prefecture compiled by the HotelBank Editorial Team as of October 13, 2026 (past 24 months; 21–84 properties depending on the item), “Location” has the highest mean at 4.070 and “Bathroom” the lowest at 3.590. That is a 0.48-point gap within the same prefecture and the same hotel type, and “Bathroom” also shows the widest spread between properties of all 10 items (p25 3.274 to p75 3.948). On the pricing side, the estimated settled ADR for the finalized month of September 2026 was ¥8,220 (N=122), 20.0% above the ¥6,849 (N=115) of the same month a year earlier — a shift into a rising-rate phase after February–July tracked close to the prior year at −0.9% to +2.5%. This article sets the “quartile of the rating” against the “position of the rate” and presents a three-step self-diagnosis for deciding which items to pass through into price and which items to fix before raising rates.
Scope: business hotels in Kumamoto Prefecture. Review scores cover the past 24 months, N=21–84 properties depending on the item (anonymized aggregate); estimated settled ADR covers N=110–122 properties (varies by month). The price metric in this article is estimated settled ADR (the settled-price level estimated from OTA and other sales data, tax-excluded equivalent); occupancy is an estimate based on OTA-listed inventory. Definitions are given at the end of the article. Data as of: October 13, 2026.
• ADR (average daily rate) = an estimated settled rate (tax-excluded equivalent), calculated by applying a hotel-type-specific adjustment factor to the lowest-plan level each property publishes on OTAs (per-room rate for 2 guests in 1 room, tax-included). Benchmarked against property-level results disclosed by listed hotel REITs (91 properties, most recent 3 months), the median error is about 7%. These are estimates and differ from each property’s actual settled prices and accounting figures.
• ADR at the area level (prefecture, city/ward) is the median of the estimated settled rates of the properties covered (the level of a typical property in the area).
• Where listed prices are mentioned, they are per-room rates for 2 guests in 1 room (tax-included).
• OCC (occupancy) = rooms sold as a share of total rooms in the area (an estimate based on OTA sales inventory).
• Source: MetroEngines Research (continuously tracking OTA published prices for approximately 168,000 properties, of which approximately 27,000 are confirmed in operation)
- — In review scores for Kumamoto Prefecture business hotels (past 24 months), “Location” at a mean of 4.070 is the highest excluding the reference-only item, and “Bathroom” at 3.590 is the lowest. Bathroom also has the widest gap between properties, with an interquartile range of 0.674 (p25 3.274 to p75 3.948).
- — Estimated settled ADR for the finalized month of September 2026 was ¥8,220 (N=122), +20.0% year over year. The phase shifted from the near-flat trend of February–July, and estimated OCC for the same month (OTA-listed inventory basis) averaged 91.8%.
- — A three-step process that sets your own scores against the prefecture’s p25/p75 and your finalized ADR against the prefecture level determines the order: pass strengths above p75 through into price, and fix weaknesses below p25 before raising rates.
Baseline for 10 Review Items — Location 4.07 at the Top, Bathroom 3.59 at the Bottom
First, let us check how guests rate business hotels in Kumamoto Prefecture, using item-by-item prefectural baselines. A baseline here means the item-level scores of each business hotel in the prefecture, aggregated anonymously into a mean, median and quartiles (p25/p75). We do not publish rankings of individual properties; the baseline serves as a yardstick for measuring “where your own scores fall within the prefecture’s distribution.”
On the numbers alone, “Amenities” is highest at 4.132, but the sample is thin at 21 properties and 654 reviews, so we treat it as reference only. Excluding it, the highest mean is “Location” at 4.070 (82 properties, 12,815 reviews). The effective top group is “Location” 4.070, followed by “Staff” 4.029 (67 properties, 4,975 reviews), “Meals” 4.021 (48 properties, 2,116 reviews) and “Breakfast” 3.993 (61 properties, 5,990 reviews). The middle tier contains “Cleanliness” 3.938, “Service” 3.936 and “Room” 3.880, while the bottom tier holds “Facilities” 3.808 and “Bathroom” 3.590 (77 properties, 11,621 reviews). Business hotels in central Kumamoto City are concentrated around entertainment districts and transport hubs, so it is intuitive that location is a pillar of their ratings.
What deserves attention is the width of the distribution rather than the ranking of means. For “Bathroom,” p25 is 3.274 and p75 is 3.948, giving an interquartile range of 0.674 points — the widest spread among the 10 items. In other words, the bottom quarter of properties in the prefecture sit at around 3.3 for bathrooms, while the top quarter exceed 3.9, close to their other items. “Room” (range 0.517) and “Facilities” (range 0.534) also vary widely, showing that the gap between properties widens for hardware-related items. Conversely, software items such as “Service” (range 0.420) and “Staff” (range 0.443) show relatively small differences (the smallest is “Amenities,” reference only, at 0.326).
Source: Compiled by the HotelBank Editorial Team from MetroEngines Research (review scores are anonymized aggregates for the past 24 months; HotelBank Editorial Team research)
| Item | Properties | Reviews | p25 | Median | Mean | p75 | IQR |
|---|---|---|---|---|---|---|---|
| Location | 82 | 12,815 | 3.862 | 4.107 | 4.070 | 4.360 | 0.498 |
| Staff | 67 | 4,975 | 3.854 | 4.143 | 4.029 | 4.297 | 0.443 |
| Meals | 48 | 2,116 | 3.779 | 4.000 | 4.021 | 4.268 | 0.489 |
| Breakfast | 61 | 5,990 | 3.763 | 4.000 | 3.993 | 4.213 | 0.450 |
| Cleanliness | 77 | 11,318 | 3.725 | 4.043 | 3.938 | 4.225 | 0.500 |
| Service | 84 | 17,994 | 3.779 | 4.000 | 3.936 | 4.199 | 0.420 |
| Room | 84 | 20,849 | 3.683 | 3.907 | 3.880 | 4.200 | 0.517 |
| Facilities | 62 | 4,240 | 3.578 | 3.847 | 3.808 | 4.112 | 0.534 |
| Bathroom | 77 | 11,621 | 3.274 | 3.594 | 3.590 | 3.948 | 0.674 |
| Amenities (reference) | 21 | 654 | 4.022 | 4.143 | 4.132 | 4.348 | 0.326 |
Source: Compiled by the HotelBank Editorial Team from MetroEngines Research (Kumamoto Prefecture business hotels, past 24 months, anonymized aggregate. IQR = p75 − p25)
A Reference Line Against Ryokan and City Hotels — Hardware Gaps Are Also Hotel-Type Gaps
The low “Bathroom” score of 3.590 for business hotels also reflects the fact that shared baths and compact unit bathrooms are standard for this hotel type. To check this, we lined up the baselines for ryokan (99–196 properties depending on the item; only the reference-only Amenities item has 5) and city hotels (9–16 properties) in the same prefecture as a reference line. Ryokan outscore business hotels on all 10 items, led by “Meals” at 4.536 (155 properties, 18,743 reviews) and “Staff” at 4.531 (122 properties, 6,377 reviews). The largest gap is in “Bathroom”: 4.468 for ryokan versus 3.590 for business hotels, a difference of 0.878 points. Conversely, the smallest gap is in “Location,” where the difference from ryokan’s 4.278 is just 0.208 points.
City hotels score only 3.817 on “Bathroom,” just 0.23 points above business hotels, indicating that bathrooms are a relative weak spot across all hotel types in the prefecture. Two conclusions follow from this reference line. First, the 3.590 “Bathroom” score of business hotels is an item that is “structurally lower than other hotel types in the prefecture,” and guests are likely scoring it against expectations appropriate to the hotel type. Second, the top quarter of business hotels in the prefecture nevertheless reach 3.948, above the city-hotel mean of 3.817 — meaning there is real room to raise the rating even within the constraints of the hotel type.
Source: Compiled by the HotelBank Editorial Team from MetroEngines Research (Kumamoto Prefecture, mean review score by item and hotel type, past 24 months, anonymized aggregate. Ryokan Amenities is reference only at 5 properties and 75 reviews)
Where Estimated Settled ADR Stands — Finalized September at ¥8,220, +20.0% YoY, Marks a Phase Shift
With the rating yardstick in place, let us turn to the pricing yardstick. Comparing the estimated settled ADR (tax-excluded equivalent, monthly) of Kumamoto Prefecture business hotels for the finalized months of January–September 2026 against the same months a year earlier, January started high at ¥7,120 (N=114), +9.9% versus ¥6,476 (N=110) the year before. February–May then ran +1.2% to +2.5%, and June–July were roughly flat at −0.3% and −0.9%. August turned upward at ¥7,346 (N=122), +4.0%, and September jumped to ¥8,220 (N=122), +20.0% versus ¥6,849 (N=115) a year earlier. The simple January–September average was about ¥7,100 in 2026 against about ¥6,800 in 2025, +4.4%, so it is more accurate to say that the rate phase switched from the end of summer than to describe a year-round rise.
The September increase was backed by occupancy. Estimated OCC for the month (OTA-listed inventory basis; 58–61 properties / 7,123–7,398 rooms; based on listings on major booking sites) averaged 91.8%. The peak was 99.5% on Sunday, September 20, followed by Wednesday, September 9 at 98.8%, Thursday, September 10 at 98.4%, and Monday, September 21 (a public holiday) at 98.4% — a mix of the middle of a holiday weekend and high-demand weekdays. By day of week, Monday–Thursday ran 91.1–94.5% (including the September 21–23 holidays) versus 86.8% on Sundays, showing that the business-demand pattern of filling up on weekdays held. A +20.0% rise while occupancy was pinned in the 90% range can be read as the result of absorbing excess demand through price. How the day-of-week occupancy pattern in Kumamoto Prefecture differs by hotel type is analyzed in detail in Kumamoto Day-of-Week Occupancy Inverts by Type.
Source: Compiled by the HotelBank Editorial Team from MetroEngines Research (estimated settled ADR, tax-excluded equivalent. Solid line = finalized values; dotted line = estimates based on current sales status)
| Stay month | 2025 finalized (N) | 2026 (N) | YoY | Basis |
|---|---|---|---|---|
| Jan | ¥6,476 (110) | ¥7,120 (114) | +9.9% | Finalized |
| Feb | ¥6,958 (112) | ¥7,132 (118) | +2.5% | Finalized |
| Mar | ¥6,712 (112) | ¥6,814 (118) | +1.5% | Finalized |
| Apr | ¥6,740 (112) | ¥6,868 (119) | +1.9% | Finalized |
| May | ¥7,176 (112) | ¥7,264 (119) | +1.2% | Finalized |
| Jun | ¥6,635 (115) | ¥6,612 (118) | −0.3% | Finalized |
| Jul | ¥6,634 (115) | ¥6,574 (119) | −0.9% | Finalized |
| Aug | ¥7,066 (117) | ¥7,346 (122) | +4.0% | Finalized |
| Sep | ¥6,849 (115) | ¥8,220 (122) | +20.0% | Finalized |
| Oct | ¥6,911 (115) | ¥10,603 (121) | — | Estimate based on current sales status |
| Nov | ¥7,305 (114) | ¥10,553 (119) | — | Estimate based on current sales status |
| Dec | ¥6,577 (115) | ¥9,744 (115) | — | Estimate based on current sales status |
Source: Compiled by the HotelBank Editorial Team from MetroEngines Research (estimated settled ADR, tax-excluded equivalent. October–December are estimates based on current sales status and may change, so a simple comparison with the prior year’s finalized values should wait until each month closes)
Looking ahead, estimates based on current sales status show October at ¥10,603 (N=121), November at ¥10,553 (N=119) and December at ¥9,744 (N=115). These, however, are mid-sales estimates that can move up or down with the remaining sales, and they are calculated on a different basis from finalized values. Discussions of level or growth rate against the finalized September figure of ¥8,220 or the prior year’s finalized values (October ¥6,911, November ¥7,305) should wait until month-end closing. The firm footing this article uses is September’s ¥8,220 and +20.0%, which can be compared finalized to finalized.
Rating Quartile × Rate Position — A Three-Step Self-Diagnosis
To sum up so far, Kumamoto Prefecture business hotels are in “a phase where rates are running 20% above the prior year,” and at the same time the prefecture’s average profile is “strong on location and staff, weak on bathroom and facilities.” But what you need to decide your own moves is not the average profile — it is where your property sits within that distribution. We suggest separating it out in the following three steps. The same quartile-based approach has also been applied to business hotels in Ishikawa Prefecture and to Okayama, and the procedure carries over to positioning your own property in any market.
Step 1 — Set your item-level scores against the prefecture’s p25/p75. Compare your property’s item-level review scores for the past 24 months with the p25 and p75 in this article’s table. Classify items above p75 as “strengths in the prefecture’s top quarter,” items below p25 as “weaknesses in the prefecture’s bottom quarter,” and those in between as “middle.” For example, for “Location,” above the p75 of 4.360 is a strength and below the p25 of 3.862 is a weakness; for “Bathroom,” above the p75 of 3.948 is a strength and below the p25 of 3.274 is a weakness.
Step 2 — Set your monthly ADR against the prefecture’s estimated settled ADR. Compare your finalized September results (tax-excluded) with the prefecture’s ¥8,220 and your August results with ¥7,346, and check whether you are above or below the prefecture level. Also line up your year-over-year change against the prefecture’s +20.0% (September) and +4.0% (August) to see whether you kept pace with the market’s rise.
Step 3 — Decide your moves from the combination. Crossing the rating quartile with the rate position splits the moves into four patterns.
| Your property’s position | How to read it | Priority move |
|---|---|---|
| Has strength items (above p75) × ADR below prefecture | Ratings are not being passed through into price | Consider room to raise prices, leading with the strength items |
| Has strength items (above p75) × ADR above prefecture | Ratings and price are aligned | Hold the current price band and monitor weakness items for decline |
| Has weakness items (below p25) × ADR below prefecture | Fixes are needed before raising rates | Improve weakness items (especially bathroom and facilities) first, then consider gradual increases after the improvements |
| Has weakness items (below p25) × ADR above prefecture | Rate is running ahead of ratings | Prioritize improving weakness items before falling ratings spill over into occupancy |
Source: Prepared by the HotelBank Editorial Team (classification using this article’s prefectural baselines and estimated settled ADR as yardsticks)
What matters in this separation is “in which items” the strengths and weaknesses arise. Among Kumamoto Prefecture business hotels, “Location” and “Staff” are high across the prefecture, so even if you exceed p75 there, your competitors in the prefecture are likely strong on the same ground. “Bathroom,” on the other hand, has the widest interquartile range at 0.674: exceeding its p75 of 3.948 differentiates you from most properties in the prefecture, while falling below its p25 of 3.274 is likely to show up in reviews first during a rising-rate phase. The wider the spread of an item, the more directly your quartile position on it feeds into pricing decisions.
For Revenue Managers of Business Hotels in Kumamoto Prefecture — Implications and Action Plan
Insight 1: September’s +20.0% is the benchmark for “did we keep pace?” The prefecture’s estimated settled ADR reached ¥8,220 (N=122) for finalized September, +20.0% year over year, whereas February–July were in the +1–2% range or below the prior year (only January was +9.9%). If your September year-over-year growth fell short of the prefecture’s, you may have held prices flat during a period of excess demand. If it matched, you are entering the stage of checking whether your ratings support pricing into October–December.
Insight 2: In months when occupancy is pinned in the 90% range, ratings set the price ceiling. September’s estimated OCC averaged 91.8% (58–61 properties / 7,123–7,398 rooms; based on listings on major booking sites), with weekdays high at 91.1–94.5%. When you are close to full, there is little room to recover through occupancy, so whether guests feel a raised rate is “worth the price” — in other words, your review-score quartile — governs the revenue ceiling.
Insight 3: The bathroom is a prefecture-wide weakness and also the item with the biggest differentiation. A distribution with a mean of 3.590 and an IQR of 0.674 shows a large gap between properties that have improved and those that have not. Even with the hotel-type constraint (unit bathrooms as standard), the top quarter reaches 3.948, above the city-hotel mean of 3.817, so there is realistic room to move up a quartile through equipment upgrades or a review of cleaning workflows.
Insight 4: The ryokan reference line shows “what to sell on the business-hotel playing field.” Ryokan are rated on different axes, with “Meals” at 4.536 and “Staff” at 4.531, and business hotels need not compete on the same axes. The fact that the gap with ryokan narrows to 0.208 points on “Location” shows that location and weekday convenience have the most explanatory power as the basis for business-hotel pricing.
| Timeframe | Action | Decision trigger (tied to figures in this article) | Aim |
|---|---|---|---|
| Today to this week | Set your item-level scores against the prefecture’s p25/p75 and classify them as strength, middle or weakness | Record “Bathroom” below 3.274 or “Facilities” below 3.578 as weakness items | Identify items to fix before raising rates |
| Today to this week | Compare your finalized August and September ADR (tax-excluded) with the prefecture’s ¥7,346 and ¥8,220, and line up your YoY against the prefecture’s +4.0% and +20.0% | If your September YoY falls well short of the prefecture’s +20.0%, consider re-examining October–December pricing | Gauge how closely you are tracking the market’s rise |
| Within 2 weeks | Reflect strength items (above p75) in booking-path messaging and review price bands for the relevant guest segments | If “Location” is above 4.360 or “Staff” above 4.297, and your ADR is below the prefecture level | Pass ratings through into price |
| Within 2 weeks | Re-read 24 months of review text for weakness items and sort out whether equipment, cleaning or guest flow is the cause | If weakness items are concentrated in hardware items such as “Bathroom” and “Facilities” | Prioritize improvement investment |
| Toward next month | Revisit October–December pricing step by step, using the prefecture’s finalized September ¥8,220 as the footing, combined with current estimates (October ¥10,603, November ¥10,553, December ¥9,744 — reference values before closing) and your rating quartiles | If your finalized September ADR is below the prefecture’s ¥8,220 and you have no weakness items, consider room to raise rates (recheck current estimates after closing) | Avoid leaving money on the table in a rising phase |
| Toward next month | Check the weekday-vs-Sunday occupancy gap at your own property and track the price–rating relationship separately by day of week | In September the prefecture ran 91.1–94.5% Monday–Thursday versus 86.8% on Sunday. If your Sunday is below the prefecture’s, consider separate Sunday messaging | Fit the day-of-week demand shape |
Source: Prepared by the HotelBank Editorial Team (decision triggers are based on this article’s prefectural baselines, estimated settled ADR and estimated OCC)
Summary — Design Rate Increases Around Three Points: Quartile, Rate and Order
Kumamoto Prefecture business hotels have entered a rising-rate phase, with estimated settled ADR for finalized September at ¥8,220, +20.0% year over year, and estimated OCC for the same month also high at a 91.8% monthly average. The prefecture’s average review profile is strong on “Location” (4.070) and “Staff” (4.029) and weak on “Bathroom” (3.590) and “Facilities” (3.808), but what determines your own moves is not the average — it is the quartile. The yardsticks this article presents can be distilled into three points.
| Yardstick | Value in this article | How to use it |
|---|---|---|
| Quartile | “Bathroom” p25 3.274 / p75 3.948; “Location” p25 3.862 / p75 4.360 | Set your item-level scores against them; above p75 is a strength, below p25 a weakness |
| Rate | Finalized September ¥8,220 (+20.0%); August ¥7,346 (+4.0%) | Line up your finalized results and YoY to measure how closely you track the market’s rise |
| Order | Strength × low rate → pass through; weakness × high rate → fix first | Use the four quadrants to set the order of rate increases and improvement investment |
A phase of rising rates is also the phase in which guests most strictly judge whether ratings have caught up with price. Checking which quartile your property sits in for “Bathroom” — the item with the widest interquartile range — is likely to be the first step in deciding the order of your rate increases.
Frequently Asked Questions
Q. What scope does the review-score baseline cover?
A. It is an anonymized, item-by-item aggregate of guest reviews posted over the past 24 months for business hotels in Kumamoto Prefecture (as classified by HotelBank’s hotel-type taxonomy). Because the number of properties with ratings differs by item, property and review counts are shown for each item. Rankings and scores of individual properties are not published.
Q. What should I watch out for when comparing my property’s review scores with the prefectural baseline?
A. The figures in this article combine reviews from multiple sales channels, so if you only look at ratings from a specific channel, the scales may not match. We recommend reading them in terms of relative position against p25 and p75 (whether you are in the top quarter or the bottom quarter).
Q. How much is estimated settled ADR for October–December up year over year?
A. October–December values are estimates based on current sales status and will change with the remaining sales. Growth against the prior year’s finalized values is best evaluated after each month closes. This article uses September’s +20.0%, which can be compared finalized to finalized, as its benchmark.
About the Data
| Item | Definition / notes |
|---|---|
| Review-score baseline | Guest review data (HotelBank Editorial Team research). For each hotel type in Kumamoto Prefecture, item-level scores over the past 24 months are aggregated per property, and the mean, median, p25 and p75 are calculated anonymously. Business hotels: 21–84 properties depending on the item (654–20,849 reviews); ryokan: 5–196 properties; city hotels: 9–16 properties. Amenities (21 business hotels, 5 ryokan) is treated as reference only due to the thin sample. |
| Estimated OCC (OTA-listed inventory basis) | OTA-listed-inventory occupancy = 100 − 100 × OTA-listed remaining rooms ÷ total rooms. Covers a fixed cohort of properties that list at least 30% of their total rooms on OTAs (the same set of properties for each stay date). This is an estimate based on how inventory sold on OTAs is being absorbed, and its definition differs from actual room occupancy (it reads high because unlisted rooms are counted as sold). Target month: September 2026; 58–61 properties / 7,123–7,398 rooms (varies by date). |
| Booking curve | Based on observations from 45 days before the stay date up to the most recent. Estimated OCC in this article uses the last observation before each stay date. |
| Estimated settled ADR | Settled-price level (tax-excluded equivalent) estimated from OTA and other sales data (lowest-plan level × hotel-type factor; an ensemble across multiple channels). Past months are finalized values; current and future months are estimates based on current sales status. Median error of 6.6% when benchmarked against published operating results. Coverage varies by month: 110–122 business hotels, 11–19 city hotels and 132–241 ryokan in Kumamoto Prefecture. |
| Reading notes | Both review scores and estimated settled ADR are prefecture-level aggregates; this is not an analysis linking the two at the property level. The correspondence between rating quartile and rate is a self-diagnosis framework and does not indicate a causal relationship in which improved ratings bring higher rates. |
| Data as of | Data as of: October 13, 2026. Sales status and inventory change daily, so the figures in this article are a snapshot at the time of retrieval. |
Source: Compiled by the HotelBank Editorial Team from MetroEngines Research