

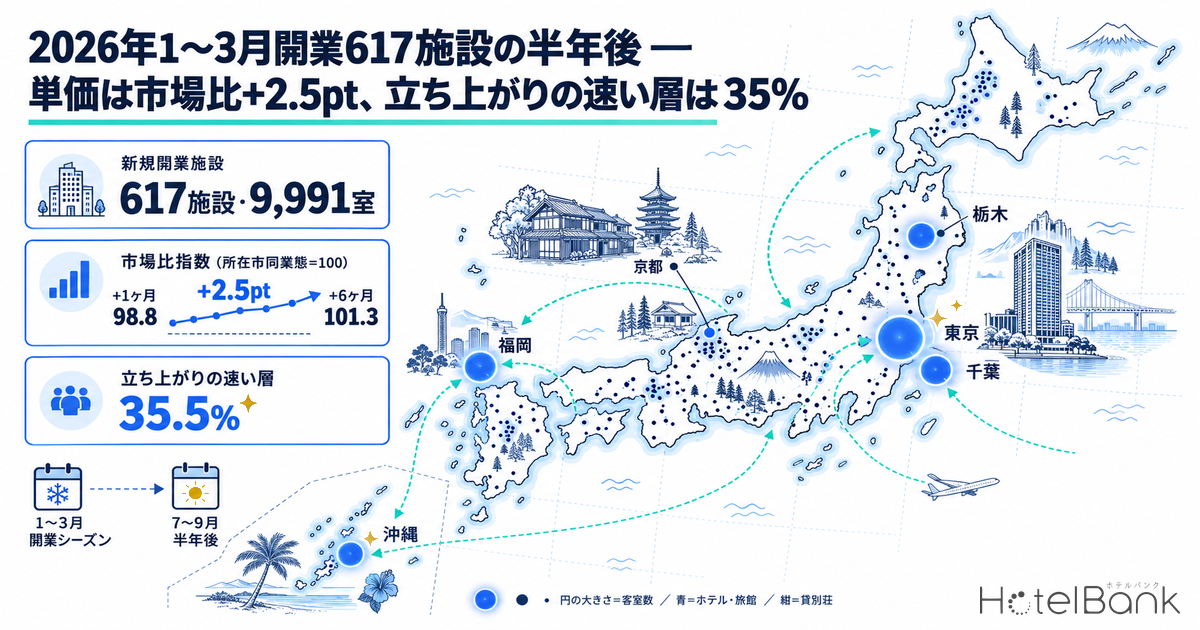
New openings that first appeared on major booking sites between January and March 2026 total 617 properties and 9,991 rooms (MetroEngines Research tally: 249 in January, 165 in February, 203 in March). Whole-house vacation rentals account for 54% of the property count, while 51 business hotels supply 42% of the rooms, producing a two-tier structure: “the count comes from vacation rentals, the rooms come from hotels.” This article tracks these 617 properties with a “market index” — each property’s listed rate in its opening month +1 and +6 divided by the level for the same property type in the same municipality — and uses medians to show how post-opening rates ramp up once seasonality is stripped out. We also check where six-month-old properties sit on inventory pickup relative to the booking curve of their surrounding market, splitting the four hotel types from small properties.
Metric Definitions Used in This Article
- ADR (average daily rate): an estimated settled rate (tax-exclusive equivalent) calculated by applying property-type correction coefficients to the lowest-plan level each property publishes on OTAs (double occupancy, per-room rate, tax-inclusive). Checked against property-level results disclosed by listed hotel REITs (184 property-months, April–May 2026), the median error is about 7.5% (about 16% for resort hotels and ryokan). These are estimates and differ from each property’s actual settled prices and accounting figures. Area-level ADR is the median of the properties covered (the level of a typical property in that area). In this article, estimated settled ADR is used only for the four types for which it can be calculated: business hotels, city hotels, resort hotels and ryokan.
- Listed price (all-plan average): the average of all plans published on OTAs and similar channels (double occupancy, per-room rate, tax-inclusive). Used in analyses that include types outside the scope of estimated settled ADR, such as vacation rentals, hostels and guesthouses.
- Market index: a property’s rate ÷ the median rate of the same property type in its municipality × 100. Where the municipality has fewer than three properties of that type, the prefecture-level figure for the type is used instead. Listed prices are divided only by listed prices, and estimated settled ADR only by estimated settled ADR — bases are never mixed. Dividing by the same market in the same month removes seasonality and regional differences.
- Opening month: the month in which a listing was first confirmed on major booking sites (based on confirmed OTA listings). It may differ from the actual opening date.
- LT (lead time): the number of days until the check-in date. LT0 = same day. This article uses observations within LT45 only.
- OCC (occupancy): rooms sold as a share of total rooms in an area (an estimate based on OTA sales inventory). This article does not calculate occupancy for individual properties; it deals only with area-level curves and the median remaining-room ratio for groups of properties.
- Data source: MetroEngines Research (based on confirmed OTA listings). The population is limited to properties listed on major booking sites and is not a complete census.
- — New openings confirmed on listings in January–March 2026 total 617 properties and 9,991 rooms. A two-tier structure: vacation rentals are 54% of the count, while 51 business hotels supply 42% of the rooms.
- — The median market index on listed prices (same type in the same municipality = 100) moved from 98.8 at +1 month to 101.3 at +6 months. It crossed 100 in month 3, for a six-month uplift of +2.5pt (N=403 properties).
- — Fast risers make up 35.5%, market trackers 37.7% and slow risers 26.8%. Hostels and the mid-size 20–49-room band rise fastest; ryokan are the only type where slow risers are the largest group at the six-month mark.
- — On an estimated settled ADR basis, the 78 properties in the four hotel types also moved from 100.0 to 102.2. Business hotels reached 105.1 and city hotels 114.0.
- — Six months after opening, the four hotel types pick up inventory 3–6pt slower than their surrounding markets from LT30 to LT14, then draw level at 47.4% vs 45.3% at LT7. Properties with 100+ rooms run ahead of the market from LT30.
Breaking Down 617 Properties and 9,991 Rooms — Vacation Rentals Are 54% of the Count, Business Hotels 42% of the Rooms
First, the shape of the population. Of the roughly 27,000 active properties tracked by MetroEngines Research, 617 were newly confirmed on listings in January–March 2026. By month, January brought 249 properties and 2,561 rooms, February 165 and 3,434, and March 203 and 3,996: January had the most properties, while room counts built up toward March. In January, 170 vacation rentals drove the count; in March, 46 hotels and ryokan supplied 3,192 rooms — the main source of supply switched from month to month.
By property type, the picture becomes even clearer. Vacation rentals number 335 properties, or 54.3% of the total, but their median size is one room per property and together they add only 533 rooms. By contrast, business hotels contributed 4,176 rooms across 51 properties, resort hotels 1,796 rooms across 16, and city hotels 1,569 rooms across 10; hotels and ryokan combined, including capsule and deluxe hotels, number 106 properties supplying 7,974 rooms (79.8%). For the whole of 2026 (as of October 7), vacation rentals still number 820 properties and 48% of new listings, so their role as the leading source of supply by count holds throughout the year. Because these figures are based on confirmed listings, however, they will keep rising as late-listed properties appear. The pattern in which the leading source of supply flips between property count and room count also holds on a full-year basis: our analysis of 1,242 openings and 33,749 rooms in 2026 found the same split — vacation rentals at 47% of the count and business hotels at 42% of the rooms.
Source: MetroEngines Research & Consulting (based on confirmed OTA listings, N=617 properties) / compiled by the HotelBank Editorial Team from MetroEngines Research data
| Property type | Properties | Share | Rooms | Room share |
|---|---|---|---|---|
| Vacation rental | 335 | 54.3% | 533 | 5.3% |
| Business hotel | 51 | 8.3% | 4,176 | 41.8% |
| Hostel | 45 | 7.3% | 750 | 7.5% |
| Guesthouse | 39 | 6.3% | 150 | 1.5% |
| Machiya townhouse | 31 | 5.0% | 53 | 0.5% |
| Cottage | 25 | 4.1% | 328 | 3.3% |
| Ryokan | 24 | 3.9% | 184 | 1.8% |
| Resort hotel | 16 | 2.6% | 1,796 | 18.0% |
| Minshuku | 12 | 1.9% | 51 | 0.5% |
| City hotel | 10 | 1.6% | 1,569 | 15.7% |
| Other (pensions, glamping, etc.) | 29 | 4.7% | 401 | 4.0% |
| Total | 617 | 100% | 9,991 | 100% |
Source: MetroEngines Research & Consulting (based on confirmed OTA listings, N=617 properties; room counts known for 612 properties, the remaining 5 counted as 0)
Geographically, Kyoto (51 properties), Hokkaido (49), Okinawa (40), Shizuoka (38) and Tokyo (36) lead the count, with tourist areas rich in vacation rentals at the top. Re-sort by rooms, however, and the order becomes Tokyo (906 rooms), Chiba (875), Fukuoka (611), Tochigi (507) and Okinawa (473), as the prefectures where large hotels opened move up. Sizing the circles on the map below by room count makes the contrast obvious at a glance: small dots scattered across the country (vacation rentals and machiya) versus large circles in urban areas (hotels).
Source: MetroEngines Research & Consulting (based on confirmed OTA listings, N=617 properties). Circle size = rooms; blue = hotels and ryokan; navy = vacation rentals; light blue = hostels, guesthouses, machiya, etc.
Main Openings with 200+ Rooms
The core of the room supply came from large projects of more than 200 rooms. The main properties whose opening dates and room counts could be confirmed in published materials are The Royal Park Hotel Maihama Resort Tokyo Bay (ザ ロイヤルパークホテル 舞浜リゾート東京ベイ; Urayasu, Chiba; 750 rooms; opened February 13, 2026), Hotel Metropolitan Oimachi Tracks (ホテルメトロポリタン 大井町トラックス; Shinagawa, Tokyo; 285 rooms; opened March 28), The Royal Park Hotel Iconic Naha (ザ ロイヤルパークホテル アイコニック 那覇; Naha, Okinawa; 257 rooms; opened January 30), Fukuoka Prince Hotel Momochihama (福岡プリンスホテル ももち浜; Sawara Ward, Fukuoka City; 229 rooms; opened March 17) and THE KNOT UTSUNOMIYA (Utsunomiya; 225 rooms; opened January 23, a full renovation of the former Chisun Hotel Utsunomiya). The 750 rooms at Maihama alone exceed the 533 rooms of all 335 vacation rentals combined — a clear sign of how much large hotels weigh in any discussion of room supply.
| Property | Location | Rooms | Opening date (announced) | Property type |
|---|---|---|---|---|
| The Royal Park Hotel Maihama Resort Tokyo Bay | Urayasu, Chiba | 750 | February 13, 2026 | Resort hotel |
| Hotel Metropolitan Oimachi Tracks | Shinagawa, Tokyo | 285 | March 28, 2026 | City hotel |
| The Royal Park Hotel Iconic Naha | Naha, Okinawa | 257 | January 30, 2026 | City hotel |
| Fukuoka Prince Hotel Momochihama | Sawara Ward, Fukuoka City | 229 | March 17, 2026 | City hotel |
| THE KNOT UTSUNOMIYA | Utsunomiya, Tochigi | 225 | January 23, 2026 | City hotel |
Source: company press releases and official websites (see References). Property types follow the MetroEngines Research classification
How Rates Ramp Up After Opening — The Market Index Crosses 100 at +3 Months and Stands at 101.3 After Six Months
Now to the main question. A widely shared rule of thumb in the industry is that newly opened properties launch slightly below the surrounding market before their name is known, then raise rates as reviews accumulate. To test this across the 617 properties, we calculated a monthly market index by dividing each property’s listed price (all-plan average, tax-inclusive) by the median listed price of the same type in its municipality in the same month. Tracking the median for the 403 properties with an index at both +1 and +6 months (333 benchmarked against their municipality and 70 against the prefecture-level figure for their type), the index moved from 98.8 at +1 month to 99.4 at +2 months and 102.3 at +3 months, and was 101.3 at +6 months.
In other words, new properties start just below the surrounding market in the month after opening, overtake it in month 3, and settle about 1–2% above it after six months. The margin is by no means large. Listed prices for the same 403 properties rose from a median of ¥34,200 at +1 month to ¥37,000 at +6 months (median per-property increase +7.3%), but the market side rose by a median +6.1% over the same period, so it is reasonable to read most of the rate increase as seasonal, with a pure opening effect of about +2.5pt. Put differently, the central pattern is “reaching market level within six months of opening”; properties that achieve rates well above the market within six months are not the majority. Our earlier tracking of 385 hotels that opened in 2025 points the same way beyond the six-month mark: their opening premium (the margin over the market) began to build from month 3 and, by months 10–13, reached more than three times its level just after opening (median +2.4% → +7.7%) — a timeline consistent with this article’s observation that new properties pass the market in month 3.
Source: compiled by the HotelBank Editorial Team from MetroEngines Research data (listed-price basis: overall N=403, vacation rentals N=216, business hotels N=44; estimated settled ADR basis: four hotel types N=78. Month +0 is a reference value because listing days start partway through the month)
For the 78 properties in the four types for which estimated settled ADR can be calculated — business hotels, city hotels, resort hotels and ryokan — we also looked at an index using the estimated settled ADR of the same type in the same municipality as the denominator. This moved from 100.0 at +1 month to 102.7 at +5 months and 102.2 at +6 months, leading to almost the same conclusion as the overall listed-price picture: “about +2pt over the market after six months.” That the same direction appears both in settled-rate estimates based on lowest-plan levels and in all-plan average listed prices shows that this ramp-up curve does not depend on how prices are displayed.
By Property Type — Hostels and Business Hotels Rise Fastest, Ryokan Take Longest
Differences invisible in the overall median emerge when we split by property type. Defining properties whose market index changed by +10% or more between +1 and +6 months as “fast risers,” −10% or less as “slow risers,” and everything in between as “market trackers,” the 403 properties break down into 143 fast risers (35.5%), 152 market trackers (37.7%) and 108 slow risers (26.8%). The quartiles — 88.6 for the first and 118.2 for the third — show a spread of ±10–18% around the median: there is no single pattern for how rates move after opening.
| Property type (listed-price basis) | N | +1-month index | +6-month index | Index change (+1 month = 100) | Fast risers | Market trackers | Slow risers |
|---|---|---|---|---|---|---|---|
| Vacation rental | 216 | 97.8 | 100.2 | 103.8 | 88(41%) | 69 | 59(27%) |
| Business hotel | 44 | 96.3 | 101.4 | 102.6 | 11(25%) | 25 | 8(18%) |
| Guesthouse | 26 | 98.4 | 104.0 | 101.3 | 10(38%) | 11 | 5(19%) |
| Hostel | 22 | 86.6 | 99.8 | 120.4 | 14(64%) | 5 | 3(14%) |
| Machiya townhouse | 21 | 159.2 | 137.9 | 101.2 | 4(19%) | 11 | 6(29%) |
| Ryokan | 17 | 106.7 | 106.3 | 94.0 | 3(18%) | 6 | 8(47%) |
| Cottage | 15 | 55.2 | 53.1 | 101.7 | 3(20%) | 7 | 5(33%) |
| Resort hotel | 11 | 101.1 | 97.7 | 99.0 | 1(9%) | 6 | 4(36%) |
| City hotel | 10 | 128.7 | 121.4 | 102.4 | 3(30%) | 4 | 3(30%) |
| All | 403 | 98.8 | 101.3 | 102.0 | 143(35%) | 152 | 108(27%) |
Source: compiled by the HotelBank Editorial Team from MetroEngines Research data (listed-price, all-plan average basis. Indexes and change rates are medians for each type. Only types with N=10 or more are shown; the total includes 21 minshuku, pensions and similar properties)
Source: compiled by the HotelBank Editorial Team from MetroEngines Research data
Hostels rose fastest: starting at 86.6% of the market at +1 month, they reached 99.8% at +6 months, almost level with the market. Their median index change was 120.4, and 14 of 22 properties (64%) were fast risers. As a group, they can be seen launching with aggressive introductory pricing centered on dormitory beds, then moving toward the market once reviews pile up. Business hotels also passed the market, from 96.3 to 101.4, tracing a stable path with 57% of the 44 properties in the market-tracker group. On an estimated settled ADR basis, too, the 42 business hotels rose from 100.2 to 105.1 and the 10 city hotels from 100.5 to 114.0: among urban hotels, a substantial share reach a level several percent to 10% above the market within six months.
Ryokan, by contrast, were essentially flat on listed prices (106.7 to 106.3 across 17 properties) and fell from 95.3 to 90.2 on an estimated settled ADR basis (16 properties), making them the only type where slow risers (8 properties, 47%) were the largest group. This is likely because ryokan pricing is tied to meal content and seasonal cuisine, and in their first year they are still being compared with the menus and hot-spring reputations of established ryokan nearby. Six months is long enough for a business hotel to bring its rates up to market, but for a ryokan it is a period in which reputation has only just begun to build — a difference in time horizon. Machiya (159.2 → 137.9) and city hotels (128.7 → 121.4) launched in price bands well above the market in the first place, and after six months they still hold high positions of 120–140 relative to the market; what characterizes them is not the absolute index level but “holding a place in the upper tier.”
The Four Hotel Types on an Estimated Settled ADR Basis
| Property type (estimated settled ADR basis) | N | +1-month index | +6-month index | +1-month median ADR | +6-month median ADR | Fast risers | Slow risers |
|---|---|---|---|---|---|---|---|
| Business hotel | 42 | 100.2 | 105.1 | ¥7,800 | ¥8,100 | 13 | 7 |
| Ryokan | 16 | 95.3 | 90.2 | ¥15,900 | ¥16,200 | 5 | 8 |
| City hotel | 10 | 100.5 | 114.0 | ¥17,400 | ¥18,400 | 3 | 2 |
| Resort hotel | 10 | 93.1 | 100.0 | ¥17,600 | ¥17,700 | 3 | 2 |
| Four types combined | 78 | 100.0 | 102.2 | ¥9,200 | ¥8,900 | 24 | 19 |
Source: compiled by the HotelBank Editorial Team from MetroEngines Research data (estimated settled ADR, tax-exclusive equivalent. The denominator is the estimated settled ADR of the same type in the same municipality, or the prefecture where there are fewer than three properties. Median ADRs rounded to the nearest ¥100. The combined median ADR for the four types comes out low because business hotels make up a large share)
By Room-Count Band — 20–49 Rooms Rise Most; 100+ Rooms Open at Market Level
We also cut the data by size. On a listed-price basis, the median index change was 101.2 for 1–5 rooms, 104.0 for 6–19 rooms, 108.5 for 20–49 rooms, 102.7 for 50–99 rooms and 98.2 for 100+ rooms, with the mid-size 20–49-room band rising most. This band started at a +1-month index of 86.9, 13% below the market, and at 88.2 it had still not reached the market at +6 months — but 12 of its 30 properties (40%) were fast risers and only 6 (20%) were slow risers. Having been priced below the market at opening, this band had the most room to raise rates over six months.
In contrast, the 28 properties with 100+ rooms had a +1-month index of 99.2, meaning they were already selling at market level in the month after opening. The index slipped slightly to 97.3 after six months; 15 of the 28 (54%) were market trackers, with fast risers (6) and slow risers (7) roughly balanced at either end. Large hotels open sales well before opening and their price position is set by the time they open, so over six months they tend to “run alongside the market” rather than “ramp up.” It is worth adding that on an estimated settled ADR basis, the 27 properties with 100+ rooms rose from 101.0 to 111.4: large hotels were raising their lowest-plan levels, something hard to see in all-plan average listed prices.
Source: compiled by the HotelBank Editorial Team from MetroEngines Research data (1–5 rooms N=281, 6–19 rooms N=49, 20–49 rooms N=30, 50–99 rooms N=15, 100+ rooms N=28)
| Room-count band | N | +1-month index | +6-month index | Index change (+1 month = 100) | Fast risers | Market trackers | Slow risers |
|---|---|---|---|---|---|---|---|
| 1–5 rooms | 281 | 102.4 | 103.5 | 101.2 | 104(37%) | 99 | 78(28%) |
| 6–19 rooms | 49 | 94.8 | 101.6 | 104.0 | 18(37%) | 17 | 14(29%) |
| 20–49 rooms | 30 | 86.9 | 88.2 | 108.5 | 12(40%) | 12 | 6(20%) |
| 50–99 rooms | 15 | 91.9 | 97.7 | 102.7 | 3(20%) | 9 | 3(20%) |
| 100+ rooms | 28 | 99.2 | 97.3 | 98.2 | 6(21%) | 15 | 7(25%) |
Source: compiled by the HotelBank Editorial Team from MetroEngines Research data
Inventory Pickup Six Months After Opening — The Four Hotel Types Draw Level with the Market at LT7; Large Properties Run Ahead
If rates reach market level, are the rooms also selling at market pace? To find out, we took a Saturday and a Wednesday in each property’s opening month +6 as check-in dates (January openings → July 11 and 15; February openings → August 22 and 19; March openings → September 12 and 16), retrieved the change in remaining rooms from LT45 up to just before check-in, and overlaid the results on the booking curve for the same type in the same prefecture. The comparison uses a pickup rate — “what percentage of the OTA inventory published at LT45 had been taken by each LT” — which removes the effect of differences in the size of each property’s published allocation. Properties whose OTA allocation was less than 30% of total rooms, and those for which no remaining-room observations were available (111 property-days in total), were excluded because several explanations are possible, such as the mix of sales channels or releasing inventory in small batches; the remaining 207 properties and 375 property-days were analyzed.
For the 70 properties (128 property-days) in the four types — business hotels, city hotels, resort hotels and ryokan — the median pickup rate at LT30 was 10.8% for the new-opening group versus 13.8% for the surrounding market, and 30.6% versus 36.1% at LT14: from one month to two weeks out, they lag the market by 3–6pt. At LT7, however, the order reverses at 47.4% versus 45.3%, and the gap widens in the final days to 61.4% versus 55.0% at LT3 and 85.4% versus 70.2% at LT1. Six-month-old properties trace a back-loaded curve in which “early bookings go first to established properties nearby, and they catch up in the final week.” 50.8% of property-days were ahead of the market at LT7, so it is fair to say that half are at or above market pace by the six-month mark (see also a separate analysis comparing autumn inventory pickup for 1,002 properties that opened in the first half of the year with established properties).
Source: compiled by the HotelBank Editorial Team from MetroEngines Research data (four hotel types: 70 new properties, 128 property-days; surrounding market = listed properties of the same type in the same prefecture (based on listings on major booking sites; median 65 properties per prefecture). 100+ rooms: 21 properties, 40 property-days; median surrounding market 290 properties. Check-in dates are Saturdays and Wednesdays in July–September 2026; observations within LT45 only)
By size, the 21 properties with 100+ rooms (40 property-days) were fastest, at 17.9% at LT30 (market 16.0%), 41.2% at LT14 (37.3%) and 55.1% at LT7 (45.8%), staying ahead of the market from a month out. 65.0% of their property-days were ahead of the market at LT7. Large hotels take bookings for a long period before opening, and by the six-month mark their sales channels, including groups and corporate accounts, are up and running — which likely explains their early inventory pickup. Meanwhile, the 6–19-room band stood at 23.1% at LT7 (market 47.7%), and the 1–5-room band had a median pickup rate of 0% at LT7: the smaller the property, the more its sales are concentrated in the last few days.
| Segment | Properties / property-days | LT30 pickup (market) | LT14 pickup (market) | LT7 pickup (market) | LT3 pickup (market) | Property-days ahead of market at LT7 |
|---|---|---|---|---|---|---|
| Four hotel types | 70/128 | 10.8%(13.8%) | 30.6%(36.1%) | 47.4%(45.3%) | 61.4%(55.0%) | 50.8% |
| of which business hotels | 36/66 | 13.5%(14.5%) | 35.3%(38.5%) | 54.2%(51.9%) | 67.2%(59.2%) | 51.5% |
| of which resort hotels | 13/23 | 17.9%(13.1%) | 45.8%(30.5%) | 50.0%(36.0%) | 62.1%(48.3%) | 60.9% |
| of which ryokan | 12/22 | 0.0%(13.0%) | 22.5%(29.8%) | 25.8%(36.1%) | 26.7%(45.1%) | 35.0% |
| Hostel | 27/52 | 1.1%(17.2%) | 36.1%(41.7%) | 46.1%(51.6%) | 71.8%(61.8%) | 44.0% |
| 100+ rooms | 21/40 | 17.9%(16.0%) | 41.2%(37.3%) | 55.1%(45.8%) | 65.7%(55.3%) | 65.0% |
| 20–49 rooms | 29/52 | 11.1%(14.0%) | 34.2%(37.6%) | 47.7%(49.6%) | 63.0%(58.0%) | 52.9% |
| 1–5 rooms | 104/184 | 0.0%(13.7%) | 0.0%(34.8%) | 0.0%(46.9%) | 100%(54.5%) | 31.3% |
Source: compiled by the HotelBank Editorial Team from MetroEngines Research data (pickup rate = median share of the OTA inventory published at LT45 taken by each LT. Figures in parentheses are the median of the same-prefecture, same-type curve for the same property-days. Only properties with an OTA allocation of 30% or more; observations within LT45 only. The market side is an estimate based on pickup of inventory sold on OTAs and differs from properties’ actual overall occupancy)
The figures for the 1–5-room band need careful reading. For whole-house vacation rentals, inventory is only ever “1” or “0,” so the median does not move until LT7 and then jumps straight to 100% at LT3. This means inventory reached zero by LT3 for roughly half of property-days, but zeroing out OTA inventory is a reversible operation that includes stopping sales, and some properties set a cutoff for last-minute bookings, so it cannot be read directly as “sold out.” For inventory pickup at small properties, we limit ourselves here to stating the facts: “31.3% of property-days were ahead of the market at LT7, and inventory moves around LT3 on both weekends and weekdays — a last-minute-concentrated pattern.”
Implications for Operators — Assuming Market Level in Six Months, Where to Aim for an Uplift
To sum up, the central picture for properties that opened in January–March 2026 was: “slightly below the market in the month after opening, above it in month 3, market +1–2% after six months, with inventory catching up to the market in the final week.” From these results, we see three opportunities that operators and investors preparing for an opening can take away.
First, it is realistic to anchor the pricing plan at “98–100 relative to the market.” This data does not show that properties need to launch well below the market in their first month. Estimated settled ADR for business and city hotels started at around 100 at +1 month and rose to 105–114 in six months. Setting initial prices at market level and then raising them step by step from month 3 onward, as reviews accumulate, leaves room to reach a higher point after six months.
Second, build each property type’s time horizon into the plan. Hostels and business hotels draw level with the market in six months, but ryokan are still building their reputation at that point, so a plan that expects gains relative to the market from the second half of the first year onward fits better. Our earlier event study of 46 REIT-acquired hotels likewise found that their rates move relative to the market only in the second year after acquisition; the more a property type’s rate depends on its food-and-beverage or hot-spring reputation, the more useful it is to allow a longer ramp-up horizon.
Third, on the inventory side, treat the phase in which properties “lag the market from LT14 to LT30” as an opportunity. Six months after opening, the four hotel types pick up inventory 3–6pt slower than the market from LT30 to LT14 and catch up in the final week. Because reliance on last-minute sales tends to push rates down, strengthening products that encourage early booking — early-bird and multi-night plans — by the six-month mark is a revenue opportunity that supports both rate and occupancy. The fact that large hotels show pickup rates above the market from LT30 is also evidence that new openings can capture early bookings if they build out multiple sales channels early.
Summary
The 617 new properties and 9,991 rooms confirmed on major booking sites in January–March 2026 formed a two-tier structure: vacation rentals made up 54% of the count and business hotels 42% of the rooms. The median market index — the listed rate at opening month +1 and +6 divided by the level for the same type in the same municipality — rose +2.5pt from 98.8 to 101.3, settling at or slightly above market level within six months. Fast risers made up 35.5% and slow risers 26.8%; by type, hostels (index change 120.4) and business hotels, and by size, the 20–49-room band (108.5), were fast risers, while ryokan (94.0) were slow risers. On inventory pickup, the four hotel types draw level with their surrounding markets at LT7, and properties with 100+ rooms run ahead of the market from LT30. Note that the population is limited to properties listed on major booking sites and opening months are also based on confirmed OTA listings, so future tallies will rise as late-listed properties appear.
Frequently Asked Questions
Q. Does a market index above 100 mean the property is selling at higher prices than its neighbors?
A. It is a relative level, with the median rate of the same type in the same municipality in the same month set at 100. Because listed prices are divided only by listed prices and estimated settled ADR only by estimated settled ADR, a value above 100 indicates that the property is selling at a higher price than a typical property in that market. It differs, however, from actual settled prices and accounting figures.
Q. Why were only properties with figures at both +1 and +6 months included?
A. Of the 617 properties, listings in the month after opening could be confirmed for 416, and at +6 months for 567. Listings often appear some time after opening, and without aligning both points in time it is impossible to track changes in the same group of properties, so the analysis is limited to the 403 properties with both.
Q. Why were properties with an OTA allocation below 30% excluded from the inventory pickup analysis?
A. For properties that offer less than 30% of their rooms on OTAs, several explanations are possible — operations centered on other channels such as their own website or travel agencies, releasing inventory in small batches, or small contractual allocations — so the speed of pickup cannot be judged from OTA inventory movements alone. A small number of remaining rooms means “the remainder within a small OTA allocation,” not that the whole property is full.
Related Reading
References and Sources
- MetroEngines Research & Consulting — new openings (based on confirmed OTA listings, January–March 2026, N=617 properties), property-level and municipality-level listed prices and estimated settled ADR (January–September 2026), property-level remaining-room trends and area booking curves (check-ins July–September 2026)
- Japan Tourism Agency, Overnight Travel Statistics Survey (July 2026 first preliminary report; June 2026 second preliminary report), published August 31, 2026 — July 2026 guest-room occupancy 60.8% (business hotels 74.2%, city hotels 71.9%, resort hotels 59.6%, ryokan 40.6%)
- Japan Tourism Agency, Notification Status under the Private Lodging Business Act (as of September 15, 2026) — 43,037 notified homes
- Travel Watch: The Royal Park Hotel Maihama Resort Tokyo Bay to open February 13, 2026 (July 1, 2025)
- Travel Watch: Hotel Metropolitan Oimachi Tracks opens March 28, 2026
- Fashion Press: The Royal Park Hotel Iconic Naha opens (January 2026)
- Seibu Prince Hotels Worldwide: Fukuoka Prince Hotel Momochihama opens March 17, 2026
- Travel Watch: THE KNOT UTSUNOMIYA opens January 23, 2026