

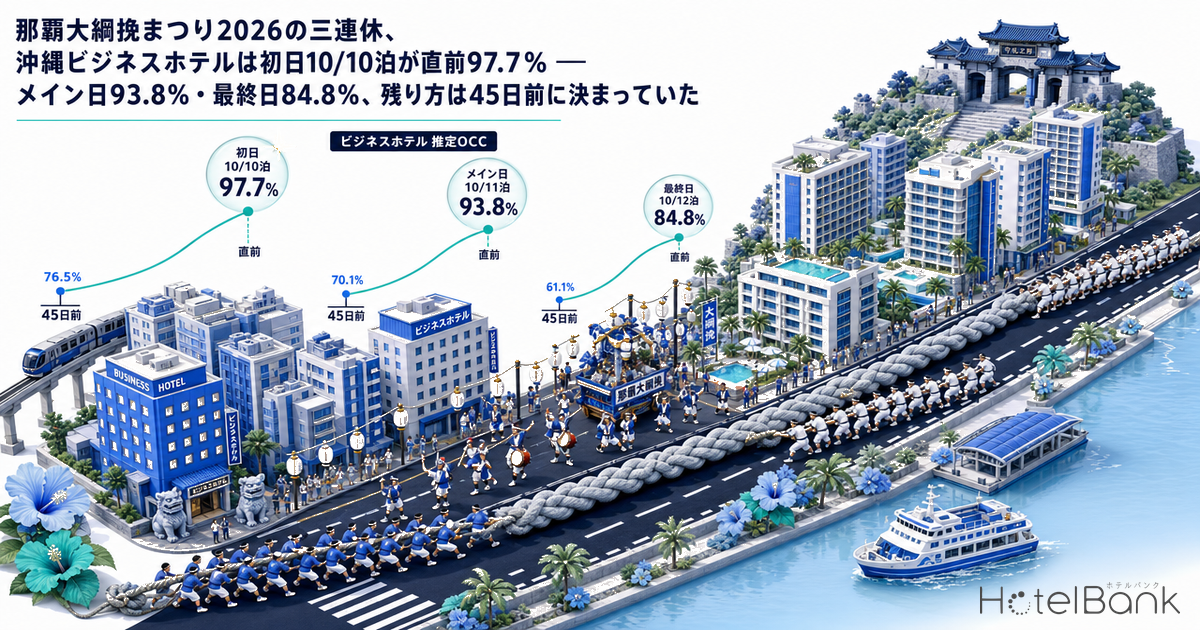
The 56th Naha Otsunahiki Festival (那覇大綱挽まつり), one of Naha City’s three major festivals, fell on Japan’s three-day weekend from Saturday, October 10 to Monday, October 12, 2026 (a national holiday). Tracking estimated OCC (based on OTA-listed inventory) by stay date for Okinawa’s business hotels (N=138–139 properties, 12,792–12,802 rooms), the first night of October 10 — the night of the Traditional Performing Arts Night Parade — already stood a clear step ahead at 76.5% 45 days before the stay date, and reached 97.7% at the final observation just before arrival. By contrast, the main day of October 11, when the tug-of-war itself was held on National Route 58, rose from 70.1% to 93.8%, and the final night of October 12 rose from 61.1% to 84.8%: the ranking at 45 days out became the ranking at landing. Resort hotels (N=188–189 properties, 15,960–16,112 rooms) followed the same order, but because they had already reached 76–84% at 45 days out, their pickup was smaller at 11.8–14.2 points. This article lines up the booking curves for the three nights of the long weekend and for the comparison dates of the previous week (Oct 3–5) from 45 days out to the final observation, and asks when the pattern of “the first night fills first while the main day and final night are left over” was locked in.
About the data in this article — Coverage: Okinawa Prefecture business hotels N=137–139 properties (12,770–12,802 rooms) and resort hotels N=187–189 properties (15,876–16,112 rooms) (varies by booking curve and stay date). Both are fixed cohorts based on listings on major booking sites. The price metric in this article is estimated settled ADR (the settled price level estimated from OTA and other sales data, tax-exclusive equivalent), and occupancy is an estimate based on OTA-listed inventory. Definitions are given at the end of the article. Data as of: October 14, 2026.
- — The 45-day ranking held all the way to landing: for Okinawa business hotels, the three nights of the long weekend kept their T-45 order — first night 76.5% > main day 70.1% > final night 61.1% — and landed at 97.7%, 93.8% and 84.8% (estimated OCC, OTA-listed inventory basis).
- — The Oct 12 final night landed 6.8pt below a normal Monday: the gap opened between 30 and 7 days out (+9.8pt vs +13.3pt for the normal Monday). The sold-out property rate was 61.1% on the first night versus 19.5% on the final night.
- — Resorts were at 76–84% at 45 days out: pickup of +11.8 to +14.2pt was about half that of business hotels, and the gain from 7 days out to the final observation (+4.8 to +6.1pt) exceeded the gain from 30 to 7 days out.
Business Hotels — The Oct 10 First Night Led From 45 Days Out; the Oct 12 Final Night Landed Below a Normal Monday
First, we overlay the curves for the three nights of the long weekend from 45 days out to the final observation (Figure 1). Among Okinawa’s business hotels, the first night of Saturday, October 10 stood at 76.5% at 45 days out, 84.6% at 30 days out and 97.7% at the final observation — the highest of the three nights at every checkpoint. The main day of Sunday, October 11 went 70.1% at 45 days → 76.5% at 30 days → 93.8% at the final observation, and the final night of Monday, October 12 (holiday) went 61.1% → 68.1% → 84.8%. The 15.4-point gap between the first and final nights at 45 days out had narrowed to only 12.9 points at the final observation.
The size of the pickup itself, however, was almost identical across the three nights. From 45 days out to the final observation, pickup was +21.2 points for Oct 10, +23.7 points for Oct 11 and +23.7 points for Oct 12 — the main day and final night picked up just 2.5 points more than the first night. In other words, this was not a case of festival demand flowing into the final night later on and closing the gap; rather, the difference in starting position at 45 days out remained almost intact as the difference at landing.
Source: Compiled by MetroEngines Research and the HotelBank Editorial Team
Meanwhile, the comparison date of Saturday, October 3 in the previous week went 69.4% at 45 days → 77.4% at 30 days → 94.0% at the final observation, landing at almost the same level as Oct 11 (93.8%). At 45 days out the Oct 10 first night was 7.1 points ahead of Oct 3, but by the final observation that lead had shrunk to 3.7 points: roughly half of the festival first night’s head start was offset by an ordinary Saturday catching up in the final stretch. Against the previous Sunday, Oct 4 (90.0% at the final observation), Oct 11 was 3.8 points higher, so the mid-holiday uplift did survive on the Sunday.
The night to watch is the final night of Monday, October 12 (holiday). Compared with Oct 5, a Monday in a normal week (62.9% at 45 days → 91.6% at the final observation), it was only 1.8 points lower at 45 days out but finished 6.8 points lower, at 84.8%. On the last day of a long weekend many guests are heading home, and the build-up of business-travel demand that a normal Monday enjoys is also thin. In the final week of the curve (7 days out → final observation), the gain for Oct 12 was +6.9 points, almost the same as +7.3 points for Oct 5; the gap opened between 30 and 7 days out (+9.8 points for Oct 12 vs +13.3 points for Oct 5). This final-night shortfall was already visible 12 days before the stay date, and we had set out in advance how to sell the remaining days in an earlier analysis of the final night of Okinawa’s October long weekend (resorts 82.8%, business hotels 75.9%).
| Stay date | T-45 | T-30 | T-14 | T-7 | Final observation | Pickup T-45→T-30 | Pickup T-30→final |
|---|---|---|---|---|---|---|---|
| Sat Oct 10 – first night, Night Parade | 76.5% | 84.6% | 91.3% | 93.8% | 97.7% | +8.1 pt | +13.1 pt |
| Sun Oct 11 – main day, tug-of-war | 70.1% | 76.5% | 84.4% | 87.4% | 93.8% | +6.4 pt | +17.3 pt |
| Mon Oct 12 (holiday) – final night | 61.1% | 68.1% | 74.4% | 77.9% | 84.8% | +7.0 pt | +16.7 pt |
| Fri Oct 9 – eve of the long weekend | 74.5% | 80.5% | 88.9% | 92.7% | 96.1% | +6.0 pt | +15.6 pt |
| Sat Oct 3 – comparison | 69.4% | 77.4% | 85.3% | 88.8% | 94.0% | +8.0 pt | +16.6 pt |
| Sun Oct 4 – comparison | 66.5% | 73.5% | 81.1% | 83.1% | 90.0% | +7.0 pt | +16.5 pt |
| Mon Oct 5 – comparison | 62.9% | 71.0% | 80.2% | 84.3% | 91.6% | +8.1 pt | +20.6 pt |
Source: Compiled by MetroEngines Research and the HotelBank Editorial Team
Resort Hotels — Around 80% Booked 45 Days Out, With Movement Concentrated in the Final Week
Resort hotels show the same ranking as business hotels, but the shape of the curve is quite different (Figure 2). The Oct 10 first night was at 83.7% at 45 days out, 87.1% at 30 days out and 95.5% at the final observation — already above 80% at 45 days out. The Oct 11 main day went 79.9% → 83.2% → 93.5%, and the Oct 12 final night 76.3% → 80.2% → 90.5%. Pickup from 45 days out to the final observation was +11.8, +13.6 and +14.2 points respectively, only about half that of business hotels.
The likely reason is structural: resort hotel sales depend on air-and-hotel package products and early long-stay bookings, so a large share of rooms is already filled 45 days before the stay date. Indeed, only 3.3–3.9 points were added in the 15 days from 45 to 30 days out, and much of the remaining pickup was concentrated in the final week. The gain from 7 days out to the final observation was +4.8 points for Oct 10, +6.1 points for Oct 11 and +5.8 points for Oct 12, exceeding the gain over the 23 days from 30 to 7 days out (+3.6 to +4.5 points). How curve shapes differ across Okinawa’s resort, city and business hotels has been compared, together with seasonal patterns, in our earlier three-segment comparison for Okinawa.
Source: Compiled by MetroEngines Research and the HotelBank Editorial Team
The relationship to the comparison dates is also milder than for business hotels. At the final observation, the gap between the Oct 10 first night and the previous Saturday, Oct 3 (93.2%) was 2.3 points; between the Oct 11 main day and the previous Sunday, Oct 4 (92.4%) 1.1 points; and between the Oct 12 final night and the previous Monday, Oct 5 (92.1%) −1.6 points. For resort hotels across the prefecture, the overlap of the long weekend and the festival was “a slightly higher peak than a normal weekend,” with none of the concentration on the first night seen at business hotels. Given that the festival venues are limited to central Naha, it is a natural result that Naha’s festival demand hardly reaches the resorts.
| Stay date | T-45 | T-30 | T-14 | T-7 | Final observation | Pickup T-45→T-30 | Pickup T-30→final |
|---|---|---|---|---|---|---|---|
| Sat Oct 10 – first night, Night Parade | 83.7% | 87.1% | 89.8% | 90.7% | 95.5% | +3.4 pt | +8.4 pt |
| Sun Oct 11 – main day, tug-of-war | 79.9% | 83.2% | 85.3% | 87.4% | 93.5% | +3.3 pt | +10.3 pt |
| Mon Oct 12 (holiday) – final night | 76.3% | 80.2% | 82.5% | 84.7% | 90.5% | +3.9 pt | +10.3 pt |
| Fri Oct 9 – eve of the long weekend | 82.3% | 85.8% | 88.2% | 89.5% | 93.8% | +3.5 pt | +8.0 pt |
| Sat Oct 3 – comparison | 80.1% | 84.4% | 87.0% | 88.2% | 93.2% | +4.3 pt | +8.8 pt |
| Sun Oct 4 – comparison | 78.3% | 82.7% | 85.0% | 86.5% | 92.4% | +4.4 pt | +9.7 pt |
| Mon Oct 5 – comparison | 77.9% | 82.2% | 85.3% | 86.2% | 92.1% | +4.3 pt | +9.9 pt |
Source: Compiled by MetroEngines Research and the HotelBank Editorial Team
Daily Landings, October 1–14 — Peak on Fri Oct 9–Sat Oct 10, Trough on Mon Oct 12 (Holiday)–Tue Oct 13
Placing all this in the flow of the month makes the long weekend’s position clearer (Figure 3). Business hotels’ estimated OCC at the final observation rose in steps from 87.7% on Thursday, Oct 1 to 96.1% on Friday, Oct 9 and 97.7% on Saturday, Oct 10, then fell in two steps — 93.8% on Sunday, Oct 11, 84.8% on Monday, Oct 12 (holiday) and 85.9% on Tuesday, Oct 13 — before recovering to 90.4% on Wednesday, Oct 14. The average for October 1–14 was 91.9%, 5.2 points above the September monthly average of 86.7%. Note that Oct 9–11 also overlapped with Taiwan’s Double Tenth holiday, and Friday-night booking pace in Okinawa and Fukuoka was tracked separately in our earlier analysis of Double Tenth and Korea’s Hangul Day demand.
Resort hotels rose gently from 89.3% on Oct 1 to 95.5% on Oct 10 and still held 90.5% on Oct 12. The trough was 5.0 points deep for resorts versus 12.9 points for business hotels (Oct 10 → Oct 12), so rooms open up on the final night of the long weekend far more at business hotels. For reference, on the Silver Week peak night of Sunday, September 20, business hotels were at 94.5% and resorts at 96.5% (see our Silver Week 2026 actuals analysis); the business-hotel Oct 10 night beat it by 3.2 points, while the resort Oct 10 night fell 1.0 point short of Sep 20.
Source: Compiled by MetroEngines Research and the HotelBank Editorial Team
Looking at the sold-out property rate (the estimated share of properties with no listed inventory visible on OTAs and other channels), business hotels stood out at 61.1% on Oct 10 — the highest in the first half of October — falling to 33.0% on Oct 11 and 19.5% on Oct 12. Given that the comparison date of Oct 3 was 40.2%, about 21 points more properties sold out on the festival’s first night than on an ordinary Saturday, while on the main day fewer properties sold out than on an ordinary Saturday. Resort hotels moved from 56.3% on Oct 10 to 54.0% on Oct 11 and 43.7% on Oct 12; the gap versus 52.0% on Oct 3 was just 4.3 points on the first night.
| Stay date | Business est. OCC (final) | Business sold-out rate | Resort est. OCC (final) | Resort sold-out rate |
|---|---|---|---|---|
| Sat Oct 3 | 94.0% | 40.2% | 93.2% | 52.0% |
| Sun Oct 4 | 90.0% | 28.8% | 92.4% | 53.2% |
| Mon Oct 5 | 91.6% | 32.6% | 92.1% | 46.4% |
| Fri Oct 9 | 96.1% | 45.9% | 93.8% | 48.0% |
| Sat Oct 10 | 97.7% | 61.1% | 95.5% | 56.3% |
| Sun Oct 11 | 93.8% | 33.0% | 93.5% | 54.0% |
| Mon Oct 12 (holiday) | 84.8% | 19.5% | 90.5% | 43.7% |
| Tue Oct 13 | 85.9% | 18.4% | 91.2% | 44.0% |
Source: Compiled by MetroEngines Research and the HotelBank Editorial Team
Estimated Settled ADR — September Finals Up 9.4% YoY for Business and 7.3% for Resorts; October Is a Current Estimate
A note on pricing. The estimated settled ADR (tax-exclusive equivalent) of Okinawa’s business hotels was ¥8,800 (N=197 properties) for the finalized month of September 2026, up 9.4% from ¥8,100 (N=193 properties) a year earlier. Resort hotels were at ¥16,800 (N=282 properties) in September 2026 against ¥15,700 (N=267 properties) a year earlier, up 7.3%; both exceeded the same month of the previous year.
October figures are estimates based on current sales: ¥10,100 for business hotels (N=194 properties) and ¥16,300 for resort hotels (N=280 properties). Set against the finalized figures for October last year (business ¥8,100, resorts ¥14,800) the level looks higher, but the estimates can change with sales through month-end, so a straight comparison with finalized figures should wait until October is finalized. How far the spike in occupancy over the long weekend was reflected in rates is worth re-examining once the month is finalized.
| Segment | Sep 2025 (final) | Sep 2026 (final) | YoY | Oct 2026 (current estimate) | Oct 2025 (final, reference) |
|---|---|---|---|---|---|
| Business hotels (Okinawa) | ¥8,079 (N=193) | ¥8,835 (N=197) | +9.4% | ¥10,098 (N=194) | ¥8,091 (N=194) |
| Resort hotels (Okinawa) | ¥15,652 (N=267) | ¥16,799 (N=282) | +7.3% | ¥16,326 (N=280) | ¥14,780 (N=267) |
Source: Compiled by MetroEngines Research and the HotelBank Editorial Team
For Revenue Managers Running Business and Resort Hotels in Okinawa — Implications and Action Plan
Operational Insights
First, how the festival long weekend would sell through was largely decided 45 days out. At business hotels the order of the first night, main day and final night never changed from 45 days out to the final observation, and pickup was similar at +21.2 to +23.7 points. When comparing your own booking pace with the market curve, the first check is whether, at 45 days out, your three nights are ranked in the same shape as the market. If your final night is filling ahead of the market, it is worth suspecting that your final-night rate is low relative to the market.
Second, the last day of a long weekend ends lower than a normal-week Monday. Business hotels landed at 84.8% for the Oct 12 night, 6.8 points below the 91.6% of the normal Monday, Oct 5. The gap opened between 30 and 7 days out, suggesting that holding final-night inventory on the assumption that “it will fill at the last minute” tends to leave rooms unsold.
Third, after resort hotels reached around 80% at 45 days out, nearly half of their remaining pickup was concentrated in the final week. A gain of +4.8 to +6.1 points from 7 days out to the final observation shows there is a rationale not only for moving late-stage inventory with price alone but also for deliberately keeping a set amount of inventory open until the final days.
Fourth, the festival effect appears to fall mainly on business hotels in central Naha near the venues, but this article aggregates at the prefecture level and does not directly demonstrate causation between the festival and occupancy. Read the skew of the sold-out property rate toward the first night (61.1% on the first night vs 33.0% on the main day) in light of your own location and guest mix.
Action Plan (for the next long weekend or event weekend)
| Timing | Action | Decision trigger (tied to figures in this article) | Aim |
|---|---|---|---|
| 45 days before stay date (T-45) | Check the booking order of the three nights against the market and review the final-night rate range first | Your final-night pace is ahead of your first night, or well above the market’s final night at T-45 (business 61.1%, resort 76.3%) | Avoid underselling the final night and keep room to lift rates on the first night and main day |
| 45 days before stay date (T-45) | Consider whether the first-night rate can be set a step above the comparison-weekend Saturday | The market’s first night at T-45 (business 76.5%) leads the comparison Saturday (69.4%) by 7 points or more | Capture the lead in rate before it shrinks by half in the final stretch |
| 30 days before stay date (T-30) | Decide whether to hold final-night inventory until the last minute or sell it through like a normal Monday | The market’s final night at T-30 (business 68.1%) is below the normal Monday (71.0%) | Avoid unsold rooms in the T-30 to T-7 window, where pickup (+9.8 points) lags the normal Monday (+13.3 points) |
| 30 days before stay date (T-30) | For resorts, set the inventory to keep for the final week and hold back on discounting until then | The market’s T-7 to final-observation gain (+4.8 to +6.1 points) exceeds its T-30 to T-7 gain (+3.6 to +4.5 points) | Do not pre-sell late-stage demand at low rates |
| Final stretch (T-7 to day of stay) | If the first night has sold out in line with the market, push extended-stay offers into the main day and final night | Your hotel has reached the market’s first-night final level (business 97.7%, sold-out property rate 61.1%) | Fill the open rooms on the main day (93.8%) and final night (84.8%) with first-night guests |
| Final stretch (T-7 to day of stay) | Treat the final night like the post-holiday weekday (Oct 13 at 85.9%) and sell out remaining rooms | Final-night pace in the final stretch is 5 points or more below the normal Monday (91.6%) | Bring the final-night landing closer to a normal Monday |
All of these are starting points for discussion based on market aggregates and do not guarantee results. Please judge them against your own performance, guest mix and sales-channel composition.
Summary — Three Yardsticks for Reading How a Festival Long Weekend Sells Through
Organizing this article into yardsticks: the first is “the ranking at 45 days out.” For Okinawa business hotels, the order of the three long-weekend nights at T-45 (first night 76.5% > main day 70.1% > final night 61.1%) did not change through the final observation, and pickup was nearly uniform at +21.2 to +23.7 points. The second is “how the gap to comparison dates narrows”: the first night’s 7.1-point lead over an ordinary Saturday shrank to 3.7 points by the final observation, and the final night landed 6.8 points below a normal Monday. The third is “differences in shape by hotel type”: resort hotels reached around 80% at 45 days out, after which nearly half of their pickup came in the final week. For the next long weekend or event weekend, apply these three yardsticks to your own curve to decide which nights to sell first and which nights’ inventory to hold until the last minute.
About the Data
| Estimated OCC (OTA-listed inventory basis) | OTA-listed-inventory occupancy = 100 − 100 × OTA-listed remaining rooms ÷ total rooms. Coverage is a fixed cohort of properties listing at least 30% of total rooms on OTAs (the same set of properties for each stay date; N= in the text is that property count). It is an estimate based on how inventory sold on OTAs is absorbed and differs in definition from actual room occupancy (rooms not listed are counted as absorbed, so it reads higher). Referred to in the text as “estimated OCC (OTA-listed inventory basis).” Target months: September–October 2026; observations through October 14, 2026. |
| Booking curve | Based on observations from 45 days before the stay date to the most recent. Checkpoints are 45, 30, 14 and 7 days out and the final observation. |
| Estimated settled ADR | Settled price level (tax-exclusive equivalent) estimated from OTA and other sales data (lowest-plan level × hotel-type coefficient, ensemble of multiple channels). Past months are finalized; current and future months are estimates based on current sales. Median error of 6.6% against published operating results. |
| Sold-out property rate | Estimated share of properties with no listed inventory visible on OTAs and other channels. Value at the final observation. |
| Coverage N= | Booking curves: Okinawa business hotels 137–139 properties (12,770–12,802 rooms), resort hotels 187–189 properties (15,876–16,112 rooms). Daily landings (October 1–14): business 137–142 properties, resort 186–196 properties (based on listings on major booking sites; property counts vary by stay date). Estimated settled ADR: business hotels 193–197 properties, resort hotels 267–282 properties (monthly values shown in Table 4). |
| Data as of | Data as of: October 14, 2026. Sales and inventory change daily, so the figures in this article are a snapshot at the time of retrieval. |
References and Sources
■ Data sources
Listed inventory and selling-price data from major booking sites collected by MetroEngines Research (business hotels and resort hotels in Okinawa Prefecture). Estimated OCC and sold-out property rates are from listed-inventory observations by stay date (through October 14, 2026); estimated settled ADR is a monthly aggregate for September 2025–October 2026.
■ Calculation assumptions
Booking curves use a fixed cohort with the same set of properties for each stay date (properties listing at least 30% of total rooms on OTAs). Checkpoints are 45, 30, 14 and 7 days out and the final observation; observations beyond 45 days are not used. Comparison dates are Sat Oct 3–Mon Oct 5 of the previous week. Estimated settled ADR for October 2026 is a mid-month current estimate.
■ Limitations and caveats
Estimated OCC is based on absorption of listed inventory and counts unlisted rooms as absorbed, so it reads higher than actual room occupancy. Aggregation is at the prefecture level and does not directly show location differences in central Naha or causation between the festival and occupancy. Estimated settled ADR has a median error of 6.6% against published operating results.
■ Event information (external sources)
・Naha Otsunahiki Preservation Society (一般社団法人 那覇大綱挽保存会), “2026 56th Naha Otsunahiki – Scheduled Dates” https://naha-otsunahiki.org/ (Hatagashira banner procession 10:25–12:55 on Kokusai-dori; Naha Otsunahiki tug-of-war 13:30–16:10 at the Kumoji intersection on National Route 58; October 11, 2026)
・Nippon Travel Agency (日本旅行), “56th Naha Otsunahiki Festival” event information https://www.nta.co.jp/kokunai/special/eventinfo/10646369.htm (Festival period October 10–12, 2026; Traditional Performing Arts Night Parade & Citizens’ On-Stage on the 10th; RBC Citizens’ Festival on the 10th–12th at Onoyama Park)
・Naha City Tourism Association (NAHANAVI) event information https://www.naha-navi.or.jp/event/