

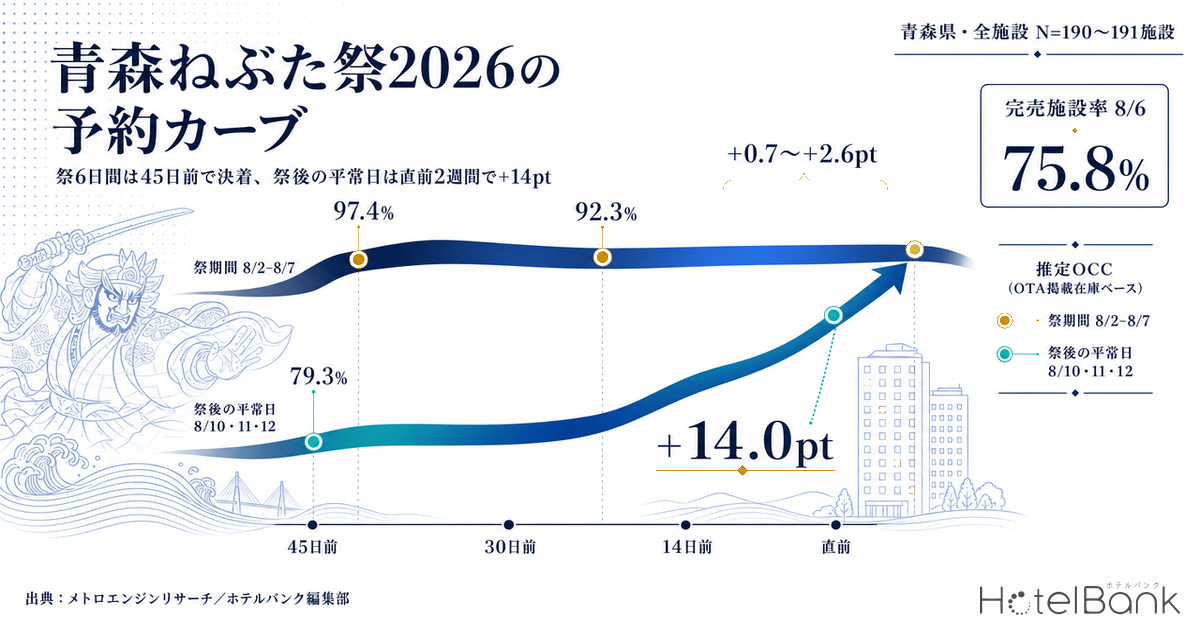
Across the six days of the Aomori Nebuta Festival — Sunday, August 2 through Friday, August 7, 2026 — estimated OCC for all properties in Aomori Prefecture (based on OTA-listed inventory) had already reached 92.3–97.4% as of 45 days before the stay date. From there to 14 days out, the additional gain was a mere +0.7 to +2.6pt: the curve is essentially flat. By contrast, the normal days immediately after the festival — Monday August 10, Tuesday August 11 and Wednesday August 12 — sat more than 10pt lower at 81.1%, 80.3% and 79.3% at 45 days out, and then added +13.1pt, +14.0pt and +13.8pt respectively by 14 days out. Same prefecture, same August, only a few days apart — and yet the “shape” of how bookings arrive is completely different. This article uses that difference in curve shape alone as its axis, to work out where the deadline for designing event-day inventory and minimum-length-of-stay rules should sit.
Scope: Aomori Prefecture, all properties, N=189–191 properties (13,366 rooms in total; the number of properties actually observed ranges from 116 to 188 depending on the snapshot). The only metrics used in this article are occupancy (an estimate based on OTA-listed inventory) and booking pace; price levels are not covered. Definitions appear at the end of the article. Data as of July 31, 2026.
- — The six festival days (Aug 2–7) reached estimated OCC of 92.3–97.4% at 45 days before the stay date (stays of August 2–7, 2026), with only +0.7 to +2.6pt added by 14 days out. The curve was almost flat.
- — The peak was Thursday, August 6 at 97.4% 45 days out (stay of August 6, 2026), with a sold-out property rate of 75.8%. The following day, Friday August 7, was also at 97.2% — the festival calendar, not the day of the week, is what orders demand here.
- — The immediate post-festival days, Aug 10–12, climb from 79.3–81.1% at 45 days out (stays of August 10–12, 2026) by +13.1 to +14.0pt through 14 days out. Even within the same August, the decision deadline is on a completely different date.
- — In a normal month (July 2026), the day-of-week averages were 97.0% on Saturday and 88.4% on Sunday. During festival week, Sunday Aug 2 was at 94.4% and Monday Aug 3 at 92.3% — the usual day-of-week troughs are overwritten by the festival calendar.
- — On August 6, estimated OCC was 97.4% (stay of August 6, 2026, as of 45 days out) against a sold-out property rate of 75.8%. Even on a day that looks nearly full on an inventory basis, a quarter of properties were still listing rooms — remaining inventory is concentrated in specific properties and room types.
The six festival days were all but settled 45 days out
Start with the facts. The Aomori Nebuta Festival 2026 runs for six days, from Sunday August 2 to Friday August 7, with Saturday August 1 serving as the eve festival. On August 7, in addition to the daytime parade of award-winning nebuta floats, the Aomori Fireworks Festival and the nebuta sea-borne procession take place in the evening (Aomori Nebuta Festival official site). In other words, the stay dates where demand concentrates run for seven nights, from August 1 — the night before the eve festival — through the final day, August 7.
The table below slices the booking curve for all properties in Aomori Prefecture by stay date, lining up four snapshots: 45 days out, 30 days out, around 14 days out, and the latest available. The seven festival days are shown alongside post-festival normal days, the Obon period and late-August weekdays as controls.
| Stay date | Type | 45 days out | 30 days out | Latest snapshot | 45 days out → latest | Sold-out property rate (45 days out) |
Properties observed (45 days out) |
|---|---|---|---|---|---|---|---|
| Aug 1 (Sat) | Eve festival | 89.5% | 91.4% | 94.0%(3 days out) | +4.5pt | 44.0% | 146 |
| Aug 2 (Sun) | Festival | 94.4% | 95.7% | 95.7%(4 days out) | +1.3pt | 64.7% | 116 |
| Aug 3 (Mon) | Festival | 92.3% | 93.4% | 95.6%(5 days out) | +3.3pt | 57.4% | 117 |
| Aug 4 (Tue) | Festival | 94.2% | 95.1% | 97.3%(6 days out) | +3.1pt | 72.1% | 117 |
| Aug 5 (Wed) | Festival | 95.8% | 96.4% | 97.5%(7 days out) | +1.7pt | 68.8% | 120 |
| Aug 6 (Thu) | Festival | 97.4% | 97.7% | 98.0%(8 days out) | +0.6pt | 75.8% | 117 |
| Aug 7 (Fri) | Festival + fireworks | 97.2% | 98.0% | 97.3%(9 days out) | +0.1pt | 72.6% | 128 |
| Aug 10 (Mon) | Post-festival | 81.1% | 86.9% | 95.1%(12 days out) | +14.0pt | 43.2% | 152 |
| Aug 11 (Tue) | Post-festival | 80.3% | 87.2% | 94.4%(13 days out) | +14.1pt | 39.5% | 158 |
| Aug 12 (Wed) | Post-festival | 79.3% | 86.2% | 93.1%(14 days out) | +13.8pt | 35.8% | 159 |
| Aug 13 (Thu) | Obon | 80.4% | 87.4% | 92.1%(15 days out) | +11.7pt | 39.5% | 155 |
| Aug 14 (Fri) | Obon | 79.0% | 85.4% | 89.0%(16 days out) | +10.0pt | 35.3% | 158 |
| Aug 15 (Sat) | Obon | 74.7% | 79.8% | 82.2%(17 days out) | +7.5pt | 24.7% | 160 |
| Aug 18 (Tue) | Normal | 75.6% | 80.9% | 85.2%(20 days out) | +9.6pt | 26.8% | 158 |
| Aug 25 (Tue) | Normal | 71.6% | 76.3% | 77.5%(27 days out) | +5.9pt | 20.0% | 156 |
Source: MetroEngines Research; compiled by the HotelBank Editorial Team
* Thin snapshots with fewer than 100 properties observed are excluded from the aggregation and replaced with the nearest available snapshot (the “30 days out” figure for Aug 1 is the 29-days-out snapshot).
A note on how to read this. Because the “latest snapshot” sits at a different number of remaining days for each stay date, comparing the size of the gains side by side as-is makes late-August stay dates look worse than they are. Holding the number of remaining days constant instead, the gain from 45 days out to 14 days out stays within a range of +0.7pt to +2.6pt for the festival period of August 2–7, while the immediate post-festival days of August 10, 11 and 12 come in an order of magnitude higher at +13.1pt, +14.0pt and +13.8pt. Saturday August 1, the eve festival, sits in between at +4.1pt.
The other figures that stand out are Thursday August 6 and Friday August 7. The 6th was at 97.4% 45 days out, the 7th at 97.2%. Regardless of the fact that these are a Thursday and a Friday, prefecture-wide inventory had been drawn down to that level. And since the gain through 14 days out is only +0.8pt and +0.7pt respectively, it means that as of 45 days out the state of play was close to “the rooms you could get were already decided.” This early flattening of the event-day curve is not unique to the Nebuta Festival; the same outline shows up in the inventory pace of the Tokushima Awaodori 2026.
Source: MetroEngines Research; compiled by the HotelBank Editorial Team
Overlay the curves and the difference is unmistakable. The line for Thursday August 6 is already pinned near the ceiling at 45 days out and stays essentially flat thereafter. Sunday August 2 is similarly flat. Saturday August 1, the eve festival, rises gently. The line for Wednesday August 12, by contrast, climbs consistently from 79.3% at 45 days out to reach 93.1% at 14 days out. Saturday August 15 starts from a lower position again and rises on a shallower gradient. Same prefecture, same month — and this is how differently demand arrives.
What the sold-out property rate reveals about which days fill first
Estimated OCC is an inventory-drawdown metric with the prefecture’s total room count as its denominator, so it is easily pulled around by the movements of large properties. To see tightness at the property level, the share of properties for which no listed inventory can be found (the estimated sold-out property rate) is the more straightforward measure.
At 45 days out, the sold-out property rate was highest on Thursday August 6 at 75.8%, followed by Friday August 7 at 72.6%, Tuesday August 4 at 72.1% and Wednesday August 5 at 68.8%. Every festival day was above 57%. Saturday August 1, the eve festival, was distinctly lower than the festival proper at 44.0%. Meanwhile, post-festival Wednesday August 12 was at 35.8% and Tuesday August 11 at 39.5%; Obon Saturday August 15 was at 24.7%; and the late-August weekday of Tuesday August 25 was as low as 20.0%. Days on which three-quarters of the prefecture’s properties are no longer listing inventory 45 days out coexist, within the same August, with days on which 80% of properties still hold inventory.
Source: MetroEngines Research; compiled by the HotelBank Editorial Team
The bar chart lines the days up with remaining days held constant at 45 days out and 14 days out. For the seven festival days, there is almost no difference in bar height. The three bars on the right (August 10, 11 and 12), by contrast, race up from a low position at 45 days out to a level barely distinguishable from the festival days by 14 days out. Looking only at the end point, August 12’s 93.1% is nearly identical to August 1’s 93.6% — but the path there is completely different. Even when the level reached is the same, the amount of time available for decision-making is not.
Note that the number of properties observed ranges from 116 to 188 depending on the snapshot. The 45-days-out snapshots for the festival period cover 116–128 properties, while those for the post-festival and Obon days cover 152–160 — the former is somewhat thinner. Snapshots with an extremely small number of observed properties (fewer than 100) are excluded from this article’s aggregation and replaced with the nearest snapshot that has adequate depth.
The day-of-week rhythm of a normal month does not apply during festival week
Why the festival-period curve looks so distinctive comes into focus when set against a normal month. Averaging the month-to-date actuals (estimated OCC) for July 2026 across all properties in Aomori Prefecture by day of the week produces the following shape.
Source: MetroEngines Research; compiled by the HotelBank Editorial Team
The July monthly average was 93.6%. By day of the week, Saturday was highest at 97.0% and Sunday lowest at 88.4%. Monday at 91.5% and Friday at 92.4% were the next troughs, while the midweek weekdays were high — Tuesday 95.0%, Wednesday 95.5%, Thursday 95.9%. Business demand supports midweek, with a peak on Saturday and a trough on Sunday at the weekend: a straightforward shape for a prefecture containing a regional capital city. This pattern of a Sunday trough and a midweek peak is not unique to Aomori. The aggregation covers the 29 days with sufficient observation coverage (172–191 properties observed); the two days with low coverage are excluded.
Now overlay the festival period. August 2 is a Sunday and August 3 a Monday. In a normal month these are the trough days, at 88.4% and 91.5% — yet as of 45 days out they stood at 94.4% and 92.3%. August 6, the festival’s peak, is a Thursday, a relatively strong day even in a normal month, and 97.4% is above even that level. In other words, during Nebuta Festival week the usual day-of-week rhythm is overwritten and demand is reordered along a different axis — the festival calendar. That Friday August 7 reached 97.2% is likewise in stark contrast to the fact that Fridays in a normal month are a trough at 92.4%.
This “overwrite” is undone rapidly once the festival ends. At 45 days out, Monday August 10, Tuesday August 11 and Wednesday August 12 stood at 81.1%, 80.3% and 79.3% — starting well below the normal-month averages for the same days of the week (91.5%, 95.0%, 95.5%) and then recovering to ordinary levels in the final stretch. It is a two-layer structure: festival-week high occupancy is locked in early, while the post-festival week depends on last-minute build-up as usual. We covered the same two-layer structure in our comparison of the Omagari fireworks day in Akita against a normal weekend, also in August.
For revenue managers operating hotels in Aomori Prefecture — implications and an action plan
(1) The decision deadline is completely different for event days and normal days. The fact that the festival period gained only +0.7 to +2.6pt between 45 days out and 14 days out means that very little inventory was still moving market-wide during that window. Your own property’s festival-period inventory, rate and minimum-length-of-stay design therefore needs to be finished before the 45-day mark. Conversely, days of the August 10–12 type move by +13 to +14pt between 45 and 14 days out, so last-minute judgment has far more room to change the outcome. Even within one August, you need to hold separate management deadlines for different days.
(2) Make a habit of comparing your own 45-days-out OCC against the market’s. The 45-days-out snapshot in this article (92.3–97.4% for the festival period, 79.3–81.1% for post-festival normal days, 71.6% for late-August weekdays) can be used directly as a benchmark. Lining up where your property’s actuals for those dates sat within these ranges shows both whether you captured the festival demand in full and whether you sold out too early on normal days. If the market was pinned in the 97% range on a given day and only your property still held inventory, that suggests you may have left business on the table.
(3) The gap between the sold-out property rate and estimated OCC reflects the mix of property sizes. On August 6, estimated OCC was 97.4% (stay of August 6, 2026, as of 45 days out) against a sold-out property rate of 75.8%. Even on a day that is nearly full on an inventory basis, a quarter of properties were still listing some inventory. Inventory remaining during the festival period tends to be concentrated at larger properties and in specific room types. On days when your property is on the “still has inventory” side, it is worth reviewing how you open up individual room types and your multi-night stay conditions.
(4) The eve-festival day and the final day have different characters. Saturday August 1 was at 89.5% 45 days out with a sold-out property rate of 44.0% — distinctly softer than the festival proper. Friday August 7, on the other hand, was at 97.2% 45 days out, with a gain of only +0.1pt. Building your calendar on the assumption that “the festival is uniformly strong from day one” makes it easy to overvalue the eve-festival day and undervalue the final day. The strong and weak days within the schedule are worth looking at day by day.
Translated into actions along a time axis for the same period next year, the above comes out as follows. Because the Nebuta Festival always runs from August 2 to 7, this shape can be carried straight over into next year’s planning.
| Time horizon | Action | Decision trigger (tied to figures in this article) | Purpose |
|---|---|---|---|
| Today–this week | For this year’s seven festival nights, put your property’s OCC at 45, 30 and 14 days out on the record | The market was at 97.4% for Aug 6 and 94.4% for Aug 2 at 45 days out. Check whether there were days where your property sat below this range | Build a property-specific baseline to use for next year’s deadline design |
| Today–this week | Review remaining inventory and room-type composition for the post-festival dates of Aug 10–12 | The market builds these three days from 79.3–81.1% at 45 days out to 93.1–95.1% at the latest snapshot. If your own pace has not matched that gain | Avoid leaving business on the table on days when last-minute demand actually moves |
| Within 2 weeks | For normal weekdays of the Aug 18 / Aug 25 type, re-check how much selling room is left in the final two weeks | The market at 45 days out was 75.6% for Aug 18 and 71.6% for Aug 25 — far below the festival period (92.3–97.4%) | Do not carry festival-week operating practice over to normal days |
| Within 2 weeks | Review festival-period results day by day, assessing the eve-festival day and the final day separately | The sold-out property rate was 44.0% for Aug 1 versus 75.8% for Aug 6. Check whether your daily results followed the same strong/weak pattern | Reflect within-schedule variation in next year’s inventory allocation |
| Looking to next month | Rework the plan so that inventory and minimum-length-of-stay design for Aug 2–7 next year is completed before the 45-day mark | The festival period gained only +0.7 to +2.6pt from 45 days out to 14 days out. There is little room for the market to move in that window | Place decisions ahead of the period in which the market moves |
| Looking to next month | For normal days, leave room for last-minute measures premised on the day-of-week troughs (Sunday, Monday, Friday) | In the July month-to-date actuals, the day-of-week averages show troughs on Sunday 88.4%, Monday 91.5% and Friday 92.4%, with a peak on Saturday at 97.0% | Avoid missing the ordinary rhythm that sits outside festival demand |
Source: MetroEngines Research; compiled by the HotelBank Editorial Team
Summary — three yardsticks
Yardstick 1: the level reached at 45 days out. Estimated OCC at 45 days out across all Aomori Prefecture properties was 92.3–97.4% for the festival period, 79.3–81.1% for the normal days immediately after, and 71.6% for late-August weekdays. Which of these three bands a given date falls into tells you the character of that day. The point is not the absolute level reached, but which band it belongs to.
Yardstick 2: the size of the gain from 45 days out to 14 days out. The festival period gained +0.7 to +2.6pt; the normal days immediately after gained +13.1 to +14.0pt. Days with a small gain have an early decision deadline; days with a large gain leave room to act at the last minute. Even when the final level reached is the same, this spread is what separates how the day should be managed.
Yardstick 3: the divergence between the sold-out property rate and estimated OCC. On August 6, estimated OCC was 97.4% (stay of August 6, 2026, as of 45 days out) against a sold-out property rate of 75.8%. Even on a day that looks nearly full on an inventory basis, a quarter of properties are still listing rooms. That divergence suggests remaining inventory is skewed towards particular properties and room types. Whether your own property is on that “still has rooms” side is worth checking day by day.
The Nebuta Festival runs from August 2 to 7 every year. Events whose calendar does not move tend to reproduce the shape of demand year after year. Record this year’s three points — 45, 30 and 14 days out — as your own property’s history, and they become your decision criteria for next year as they stand.
About the data
■ Data sources
・Data provided by MetroEngines Research (daily observation of OTA-listed inventory and sales status). Scope: Aomori Prefecture, all properties.
■ Assumptions
・Definition of estimated OCC: occupancy on an OTA-listed inventory basis = 100 − 100 × rooms still listed on OTAs ÷ total rooms. It is an estimate based on the drawdown of inventory sold on OTAs, and is defined differently from actual room occupancy (it reads higher). This article labels it “estimated OCC (OTA-listed inventory basis)”. Scope: Aomori Prefecture, all properties; target months are August 2026 (snapshots by stay date) and July 2026 (month-to-date actuals).
・Booking curve: based on observations from 45 days before the stay date through the latest available.
・Sold-out property rate: the share of properties for which no listed inventory can be confirmed on OTAs and similar channels (estimated). It does not necessarily correspond to actually being fully booked.
・Definition of estimated settled ADR: an estimated transacted price level (pre-tax equivalent) derived from OTA and similar sales data (lowest-plan level × category-specific coefficient, ensembled across multiple channels). Past months are confirmed values; the current and future months are estimates based on current sales status. Reconciliation against published operating results gives a median error of 6.6%. Note that this article is built solely around occupancy and booking-pace measures and uses no price metrics.
・Breakdown of N: Aomori Prefecture, all properties. The population for the snapshots by stay date is 189–191 properties (13,366 rooms in total); the number of properties for which observations were actually obtained ranges from 116 to 188 by snapshot. Thin snapshots with fewer than 100 properties observed are excluded from the aggregation and replaced with the nearest snapshot. For the July 2026 month-to-date actuals, the 29 days with sufficient observation coverage were used (172–191 properties observed); the two days with low coverage were excluded.
■ Limitations and caveats
・All metrics in this article are estimates based on OTA-listed inventory and do not correspond to actual room occupancy or actual sold-out status (definitions above). Because snapshots with few observed properties are excluded, the population is not constant across snapshots.
・Data as of July 31, 2026 (the most recent observation date is July 29, 2026). Sales status and inventory change daily, so the figures in this article are a snapshot as of the time of retrieval.
References and sources
・Aomori Nebuta Festival official site (2026 dates and parade schedule)
・Aomori Prefecture tourism site, Amazing AOMORI (tourism and event information in Aomori Prefecture)
・Occupancy and booking-pace data: MetroEngines Research