

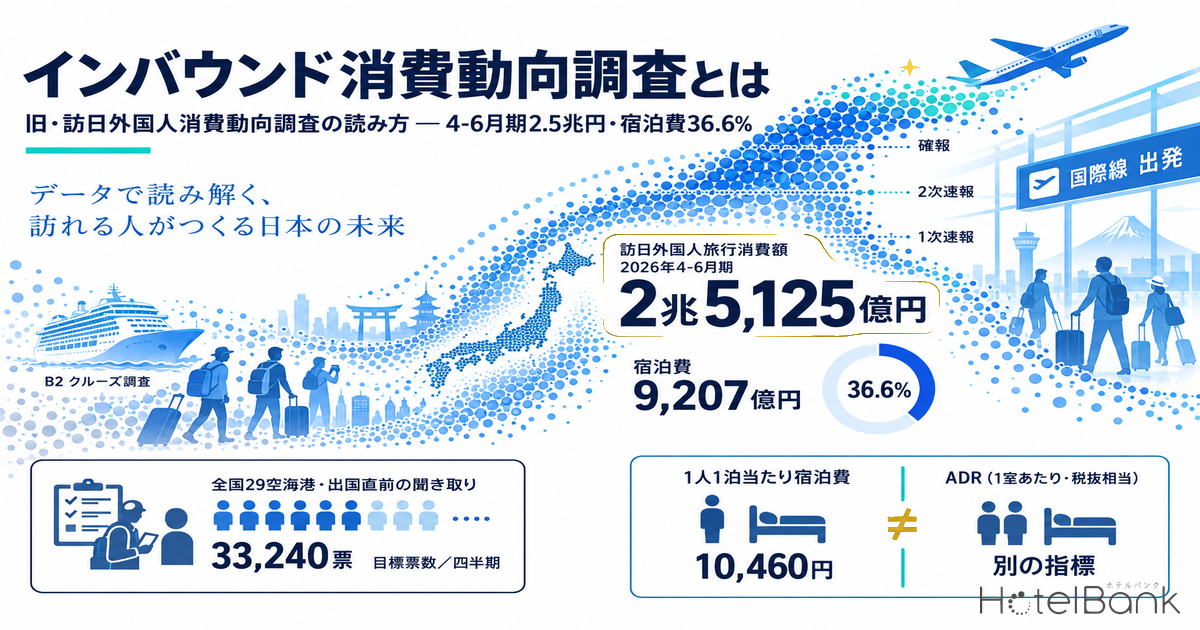
The Inbound Consumption Trend Survey (インバウンド消費動向調査) is the Japan Tourism Agency’s quarterly statistic on spending by foreign visitors to Japan; its former name was the Consumption Trend Survey for Foreigners Visiting Japan (訪日外国人消費動向調査). The name changed from the April–June 2024 survey, but neither the survey items nor the estimation method changed, so readers who arrived searching for the old name are looking at the same survey. The latest published figure is the second preliminary release for April–June 2026 (published September 30, 2026): foreign visitor travel spending was ¥2.5125 trillion (+0.3% YoY), of which accommodation accounted for ¥920.7 billion, or 36.6% of the total.
This article is not a quarterly deep dive; it focuses on how to read the survey itself. Following the definitions in the published materials, it sets out who is asked what and how, how the first preliminary, second preliminary and final releases differ, what the five spending categories cover, and why “accommodation spend per person per night” — the figure hoteliers most often misread — is a different thing from their own ADR. For an analysis that reads the April–June figures against the lodging market, see our earlier article (April–June ¥2.5 trillion and the gap to market ADR).
Metric Definitions Used in This Article
- Foreign visitor travel spending, travel spending per person, accommodation spend per person per night: all are quoted as published in the Japan Tourism Agency’s Inbound Consumption Trend Survey. Per-person-per-night values are per person, as amounts paid including taxes and service charges, not a per-room rate at lodging facilities.
- ADR (Average Daily Rate): an estimated transacted rate (tax-exclusive equivalent), calculated by applying segment-specific adjustment factors to the lowest published plan level on OTAs and similar channels (per room, based on two guests per room, tax included). Checked against property-level results disclosed by listed hotel REITs, the median error is about 7%. It is an estimate and differs from each property’s actual transacted prices and accounting figures. Area-level ADR is the median of the covered properties (the level of a typical property in the area).
- Data sources: Japan Tourism Agency, Inbound Consumption Trend Survey, Overnight Travel Statistics Survey, and Travel and Tourism Consumption Trend Survey; Japan National Tourism Organization (JNTO), Visitor Arrivals Statistics; MetroEngines Research
- — Same survey as the old name: renamed the Inbound Consumption Trend Survey from the April–June 2024 survey. Survey items and the estimation method are unchanged, so figures remain comparable with January–March 2024 and earlier.
- — 33,240 questionnaires per quarter is the target of this demand-side statistic, which interviews foreign visitors about their spending just before departure at 29 airports and seaports nationwide.
- — The first preliminary release is weighted by the year-earlier quarter’s departure mix; the second preliminary and final releases by the current quarter’s. For April–June 2026, accommodation’s share was revised from 37.0% to 36.6%.
- — The latest April–June 2026 figure (second preliminary) is ¥2.5125 trillion (+0.3% YoY); accommodation was ¥920.7 billion, or 36.6% of the total.
- — Accommodation spend per person per night of ¥10,460 is a per-person amount paid including tax and service charges, and also counts free-of-charge person-nights and rent paid by long-stay visitors. It cannot be substituted for a per-room, tax-exclusive ADR.
What Is the Inbound Consumption Trend Survey? A Demand-Side Statistic Asking ~30,000 Departing Visitors per Quarter
Start with the survey’s framework. According to the Japan Tourism Agency’s “Overview of the Inbound Consumption Trend Survey”, the survey covers “foreigners departing Japan (excluding crew and those staying one year or longer)”, and is conducted at international departure lobbies and similar locations at 29 airports and seaports nationwide. Interviewers who speak foreign languages conduct the interview while showing a tablet or a paper questionnaire (12 languages). Because respondents are asked just before boarding their flight home, the answers capture all spending during their stay in Japan. Responses are checked on site, and tablet responses are compiled the same day.
Under a single survey name, three surveys with different purposes actually run every quarter: the A1 National Survey, which captures detailed spending by nationality/region; the B1 Regional Survey, which captures spending by prefecture; and the B2 Cruise Survey, which covers cruise passengers who entered on cruise-ship landing permits. The combined sample target reaches 33,240 questionnaires per quarter, and the population is the number of simple foreign departures from the Ministry of Justice’s Statistics on Legal Migrants. The sample, stratified by nationality/region and port of departure, is weighted back to the population, and the total is estimated by multiplying spending per traveler by the number of travelers (general visitors, i.e. JNTO visitor arrivals minus cruise passengers).
| Survey | Purpose | Survey locations | Target questionnaires / quarter | Target precision |
|---|---|---|---|---|
| A1 National Survey | Detailed spending data by nationality/region | International departure lounges etc. at 17 airports and seaports | 7,230 | Standard error rate of 3–10% for total travel spending per person per trip (by nationality) |
| B1 Regional Survey | Spending data by prefecture | International departure lounges etc. at 25 airports and seaports | 24,620 | Standard error rate of 5–20% for in-trip spending per day (by prefecture) |
| B2 Cruise Survey | Cruise passenger spending data | Hakata, Nagasaki, Naha, Hirara and Ishigaki ports | 1,390 | — |
Source: Compiled by the HotelBank Editorial Team from the Japan Tourism Agency, “Overview of the Inbound Consumption Trend Survey”
The history of the name change is also worth knowing. In a press release on April 5, 2024, the Japan Tourism Agency announced that the Consumption Trend Survey for Foreigners Visiting Japan — previously a general statistical survey under the Statistics Act — would end with the January–March 2024 survey, and that from the April–June 2024 survey it would be conducted as the Inbound Consumption Trend Survey, with the aim of promoting use of individual traveler spending data (microdata). What changed was the survey’s purpose and the procedure for providing microdata; the published materials state explicitly that “since the survey items and estimation methods have not been changed, comparison with data for January–March 2024 and earlier is possible.” In other words, there is no need to draw a break line at 2024 when going back through the time series.
That said, several notes besides the name affect how to read the time series. The B1 Regional Survey and the B2 Cruise Survey were suspended during the COVID-19 pandemic and resumed in April–June 2023 and July–September 2023 respectively. From the 2026 survey, Mexico, the Nordic countries and the Middle East were added as surveyed countries; up to 2025 they were included in “Other”, so care is needed in nationality comparisons. In addition, cruise passenger spending for January–March and April–June 2026 is treated as a reference value because the number of surveyed sailings and responses per port were insufficient.
Release Schedule — First Preliminary, Second Preliminary and Final Releases Differ in the Headcounts Used for Weighting
Results are released in two stages each quarter and finalized on a calendar-year basis. According to the Japan Tourism Agency’s tourism statistics release calendar, the 2026 schedule is: January–March, first preliminary April 15 and second preliminary June 30; April–June, July 15 and September 30; July–September, October 21 and December 24; October–December, January 20 and March 31, 2027. A preliminary calendar-year figure is released on the same day as the October–December first preliminary release, and is finalized with the calendar-year final release on March 31 of the following year. In other words, it is a three-stage rocket: a first preliminary release roughly two to three weeks after quarter-end, a second preliminary release about three months after, and a final release at the end of March of the following year.
| Period | First preliminary | Second preliminary | Final |
|---|---|---|---|
| Calendar year 2025 | January 21, 2026 (preliminary) | — | March 31, 2026 (published; ¥9.4549 trillion) |
| January–March 2026 | April 15 (published) | June 30 (published; ¥2.3373 trillion) | March 31, 2027 (finalized with the calendar-year final release) |
| April–June 2026 | July 15 (published; ¥2.5096 trillion) | September 30 (published; ¥2.5125 trillion) | |
| July–September 2026 | October 21 (scheduled) | December 24 (scheduled) | |
| October–December 2026 / calendar year 2026 | January 20, 2027 (scheduled) | March 31, 2027 (scheduled) |
Source: Compiled by the HotelBank Editorial Team from the Japan Tourism Agency, tourism statistics release calendar (as of March 31, 2026; scheduled dates are subject to change)
So what is the difference between the first and second preliminary releases? According to the published explanation, when the sample stratified by nationality/region and port of departure is weighted back to the population structure, “the survey design and the first preliminary release use data for the same period of the previous year, while the second preliminary and final releases use data for the current period.” That is, at the first preliminary stage the breakdown of current-quarter departures is not yet final, so weighting uses the year-earlier mix; the second preliminary release replaces it with current-quarter actuals. It is more accurate to understand the revision as an update to the headcount side than as an increase in the number of responses.
April–June 2026 shows the size of a typical revision. The first preliminary release put the total at ¥2.5096 trillion (+0.2% YoY) and accommodation at ¥927.8 billion (37.0% share); the second preliminary release put them at ¥2.5125 trillion (+0.3%) and ¥920.7 billion (36.6%). While the total barely moved (+¥2.9 billion), within the breakdown accommodation fell by ¥7.1 billion and shopping rose by ¥9.0 billion, from ¥673.1 billion to ¥682.1 billion. Accommodation spend per person per night also edged up from ¥10,446 to ¥10,460. A revision of 0.4 points in share and just under 1% in value looks small, but any article or internal document discussing quarterly spending shares must always state which release stage its figures come from.
| April–June 2026 | First preliminary (July 15) | Second preliminary (September 30) | Revision |
|---|---|---|---|
| Foreign visitor travel spending | ¥2.5096 trillion (+0.2%) | ¥2.5125 trillion (+0.3%) | +¥2.9 billion |
| Accommodation (share) | ¥927.8 billion (37.0%) | ¥920.7 billion (36.6%) | −¥7.1 billion |
| Shopping (share) | ¥673.1 billion (26.8%) | ¥682.1 billion (27.1%) | +¥9.0 billion |
| Food & drink (share) | ¥545.4 billion (21.7%) | ¥546.3 billion (21.7%) | +¥0.9 billion |
| Travel spending per person (general visitors) | ¥244,457 (+3.3%) | ¥244,733 (+3.4%) | +¥276 |
| Accommodation spend per person per night (general visitors, all purposes) | ¥10,446 | ¥10,460 | +¥14 |
| Average nights stayed (general visitors) | 8.7 nights | 8.6 nights | −0.1 nights |
Source: Compiled by the HotelBank Editorial Team from the Japan Tourism Agency, “Inbound Consumption Trend Survey, April–June 2026 (first and second preliminary) — Summary of Results”
Defining the Five Spending Categories — Accommodation Even Includes Private Lodging and Long-Stay Rent
Spending in this survey is split into “in-trip spending” and “pre-trip spending”, and the five published spending categories belong to in-trip spending. Pre-trip spending covers group-tour and package fees and international fares for independent travelers; the domestic-revenue portion of it (accommodation, food and drink, domestic transport, etc.) is allocated using the category mix of independent leisure travelers and added to the categories as the “package breakdown”. Category amounts are on this post-addition “travel spending” basis. Laying out the scope of each category as given in the Japan Tourism Agency’s “Glossary of Terms”, several items stand out as broader than hoteliers might assume.
| Category | Included (per the Glossary of Terms) | Excluded / classified in another category |
|---|---|---|
| Accommodation | Hotels, ryokan, national people’s lodges, motels, simple lodging houses, mountain huts, boarding houses, corporate retreats, youth hostels, guesthouses, membership-based lodging (including timeshares and vacation rentals), paid home-sharing stays, training camp lodgings, and rent paid by long-stay visitors. Includes items paid online etc. before departure | Accommodation included in package tour fees (added separately via allocation); accommodation outside Japan |
| Food & drink | Canteens, restaurants, specialty restaurants, soba/udon shops, sushi restaurants, pubs, beer halls, bars, cafés, hamburger shops, mobile food vendors, food delivery services | Meals included in accommodation (meals in half-board plans go to accommodation); takeaway bento etc. go to shopping |
| Transport | Domestic flights, Japan Rail Pass, shinkansen/rail/subway/monorail, buses, taxis, rental cars, domestic ferries, expressway tolls, parking and fuel | Air and sea fares between Japan and abroad (pre-trip spending); ski lifts go to entertainment & services |
| Entertainment & services | Local tours and guides, admission to tourist facilities and theme parks, ski lifts, rental fees, other entertainment services | The same costs included in package tour fees |
| Shopping | Purchases of confectionery, other food/beverages/alcohol/tobacco, cosmetics and pharmaceuticals, clothing, shoes/bags/leather goods, electronics, watches/cameras and other goods | Purchases at shops inside lodging facilities count as shopping (not accommodation) |
Source: Compiled by the HotelBank Editorial Team from the Japan Tourism Agency, “Inbound Consumption Trend Survey — Glossary of Terms”
Two points matter for lodging operators. First, the universe behind accommodation spending is not limited to hotels and ryokan under the Hotel Business Act; it includes paid home-sharing stays, membership facilities and even rent paid by long-stay visitors. Accommodation spending of ¥920.7 billion cannot be read as “hotel and ryokan revenue”. Second, meals in half-board plans are counted under accommodation, whereas sales at in-house shops go to shopping. When comparing category shares with your own departmental revenue mix, keep this boundary mismatch in mind.
Quarterly Spending and Category Mix Over Time — Accommodation’s Share Moves Seasonally Between 33.5% and 38.5%
Viewed as a time series, the survey’s patterns also become visible. Foreign visitor travel spending grew from ¥1.0103 trillion in January–March 2023 to ¥2.5319 trillion in October–December 2025, and the 2025 calendar-year final figure of ¥9.4549 trillion (+16.4% YoY) set a new record. In 2026, January–March came in at ¥2.3373 trillion (second preliminary) and April–June at ¥2.5125 trillion (same), both slightly above the year-earlier quarters. Since 2024 the pattern of peaks in April–June and October–December and a trough in July–September has been stable, so for annual outlooks the basic comparison is year-on-year between the same quarters.
Source: Compiled by the HotelBank Editorial Team from the Japan Tourism Agency, Inbound Consumption Trend Survey (January–March and April–June 2026 are second preliminary figures; January–March and April–June 2023 exclude cruise passengers)
The category mix is seasonal too. Over the latest six quarters, accommodation’s share was lowest at 33.5% in January–March 2025 and highest at 38.5% in April–June 2025. In the cherry-blossom April–June quarter, room rates rise and accommodation’s share swells, whilein January–March 2025 shopping’s share (29.4%) was large (25.3% in January–March 2026). The 36.6% for April–June 2026 was 1.9 points below the year-earlier quarter, but it exactly matches the 36.6% in the 2025 calendar-year final release, so it is most naturally read as a return to the annual-average level. Food & drink sits at 21–23%, transport around 10%, and entertainment & services at 4–5%; the shares of these three categories barely move from quarter to quarter.
Source: Compiled by the HotelBank Editorial Team from the Japan Tourism Agency, Inbound Consumption Trend Survey, quarterly summaries of results (2025 quarters are final, 2026 are second preliminary; “Other” at 0.0–0.1% omitted)
Reading Accommodation Spend — “Per Person per Night” Is Per Person and Tax-Inclusive, Not a Per-Room ADR
This is the point this article most wants to make. Accommodation spend per person per night for general visitors in April–June 2026 was ¥10,460 (second preliminary, all purposes), up 7.5% from ¥9,727 a year earlier. Seeing this number, it is tempting to think “so inbound visitors pay about ¥10,000 a night” and compare it with your own ADR, but the two differ in unit, tax treatment and universe.
First, the unit. Accommodation spend per person per night is general visitors’ total accommodation spending divided by person-nights (people × nights). If two people share a room, the room rate is divided across two person-nights. Second, taxes and service charges: because the survey asks what travelers paid, it is an amount including consumption tax, accommodation tax and service charges, whereas this site’s ADR is an estimated transacted rate on a tax-exclusive basis aligned with REIT-disclosed results. Third, the universe: as the previous section showed, accommodation includes guesthouses, paid home-sharing stays and long-stay rent, and person-nights spent at relatives’ or friends’ homes with zero accommodation cost also enter the denominator. The long average stay of 8.6 nights reflects long stays for business and visiting relatives, which dilute accommodation spending once averaged per night. For the same reason, this average length of stay differs markedly from per-visitor nights calculated by dividing the Overnight Travel Statistics Survey’s guest nights by visitor arrivals, so the two figures should not be used interchangeably.
Source: Compiled by the HotelBank Editorial Team from the Japan Tourism Agency, Inbound Consumption Trend Survey, April–June 2026 (second preliminary), and MetroEngines Research (estimated transacted ADR for April–June 2026, 3-month average of each month’s prefectural median; Tokyo N=1,137–1,145 properties, Kyoto N=588–607, Fukuoka N=473–476, Okinawa N=500–505, Hokkaido N=947–949, Osaka N=644–650)
The chart places these side by side to show the difference in definitions, not to compare levels. The estimated transacted ADRs of about ¥15,000 in Tokyo, about ¥16,700 in Kyoto and about ¥9,500 in Osaka are all per-room, tax-exclusive medians for hotels and ryokan listed on OTAs and similar channels, and cannot be measured on the same yardstick as the per-person, tax-and-service-inclusive, all-lodging-types figure of ¥10,460. Even if you double the per-person-per-night figure on a two-per-room assumption, it is safer to assume it cannot be converted into a hotel room rate, since free-of-charge person-nights and long-stay rent are mixed in.
| Dimension | Accommodation spend per person per night (Japan Tourism Agency) | Estimated transacted ADR (this site) |
|---|---|---|
| Unit | Per person, per night (divided by person-nights) | Per room, per night (based on the room rate for two guests per room) |
| Taxes & service charges | Amount paid by the traveler = including consumption tax, accommodation tax and service charges | Tax-exclusive equivalent (same basis as REIT-disclosed transacted ADR) |
| Universe | All lodging types used by foreign visitors (general visitors), including private lodging, guesthouses, long-stay rent and free-of-charge person-nights | Hotels and ryokan listed on OTAs and similar channels (all guests, including Japanese) |
| Method | Interview responses at departure, weighted back and with the package breakdown allocated in | Estimate = lowest published plan level × segment adjustment factor (median error about 7%) |
| Granularity & frequency | National and by nationality, quarterly (by prefecture via the calendar-year regional survey) | By prefecture, municipality and property, monthly |
| Best used for | Knowing how much weight accommodation carries in foreign visitors’ wallets | Knowing the level and trend of room rates for your property, competitors and area |
Source: Compiled by the HotelBank Editorial Team from the Japan Tourism Agency, Inbound Consumption Trend Survey “Glossary of Terms” and “Overview”, and MetroEngines Research
So what is this statistic useful for to lodging operators? Accommodation spend per person and average nights by nationality are among the few published figures showing which markets are “guests who spend on lodging”, and combined with the nationality mix of your catchment they can inform plan design and F&B. The year-on-year change in accommodation’s share reveals the big tide of whether visitors’ spending is shifting toward lodging or flowing to shopping. On the other hand, it is not a basis for judging whether your ADR is high or low relative to the market. For that purpose, it makes more sense to use area estimated transacted ADR built on the same per-room yardstick, or hotel rates tracked by currency.
How to Use It Alongside the Overnight Travel Statistics Survey, Visitor Arrivals Statistics and the Travel and Tourism Consumption Trend Survey
When tracking inbound demand, even statistics from the same Japan Tourism Agency and JNTO divide their roles according to whether they measure “people”, “person-nights” or “spending”. The Inbound Consumption Trend Survey asks the demand side (travelers) about spending, whereas the Overnight Travel Statistics Survey has the supply side (lodging facilities) report person-nights and occupancy, the Visitor Arrivals Statistics count arrivals based on immigration statistics, and the Travel and Tourism Consumption Trend Survey is the domestic counterpart covering Japanese residents. The table below sets out how the four relate.
| Statistic | What it measures | Coverage & method | Frequency & release stages | Latest published figure | How lodging operators can use it |
|---|---|---|---|---|---|
| Inbound Consumption Trend Survey Japan Tourism Agency | Foreign visitors’ travel spending, travel spending per person, spending by category, average nights stayed (by nationality) | Interviews with departing foreigners (29 airports and seaports; target 33,240 questionnaires per quarter) | Quarterly. First preliminary (2–3 weeks after quarter-end) → second preliminary (about 3 months) → calendar-year final (end of March of the following year) | April–June 2026 (second preliminary) ¥2.5125 trillion, +0.3% YoY | What’s in each nationality’s wallet, accommodation’s share, length of stay |
| Overnight Travel Statistics Survey Japan Tourism Agency | Total guest nights, foreign guest nights, room occupancy (prefecture × facility type) | Self-reported by lodging facilities (complete enumeration for 20+ rooms, sample for 19 or fewer; stratified by room count from January 2026 data) | Monthly.First preliminary (end of following month) → second preliminary (end of the month after) → annual final figures (end of June of the following year) | August 2026 (first preliminary): 62.68 million guest nights, of which foreign 12.64 million; room occupancy 64.4% | Actual demand volume (person-nights) and occupancy; comparisons by prefecture and facility type |
| Visitor Arrivals Statistics Japan National Tourism Organization (JNTO) | Visitor arrivals (by nationality/region, monthly) | Based on the Ministry of Justice’s Statistics on Legal Migrants: regular foreign entrants minus foreign residents of Japan, plus temporary landing visitors etc. (excludes crew) | Monthly. Estimate (mid following month) → provisional → final | August 2026 (estimate): 3,098,900, −9.6% YoY | The entry point for headcounts by market; also used in the consumption survey’s total estimate |
| Travel and Tourism Consumption Trend Survey Japan Tourism Agency | Japanese residents’ domestic travel spending, total travelers, spending per person per trip (overnight vs. day trips) | Mail/online survey of about 29,000 people randomly sampled from the Basic Resident Register | Quarterly. First preliminary (about 7 weeks after quarter-end) → second preliminary (about 4 months) → calendar-year final (end of April of the following year) | April–June 2026 (first preliminary) ¥7.5361 trillion, +11.7% YoY | Gauging the weight of inbound visitors against domestic guests’ spending |
Source: Compiled by the HotelBank Editorial Team from the Japan Tourism Agency, “Overview of the Inbound Consumption Trend Survey”, “Overview of the Overnight Travel Statistics Survey” and Travel and Tourism Consumption Trend Survey, JNTO Visitor Arrivals Statistics, and each set of published materials
Boiled down to three points: first, “how much was spent” comes from the Inbound Consumption Trend Survey, “how many stayed and how full were rooms” from the Overnight Travel Statistics Survey, and “how many came” from the Visitor Arrivals Statistics. Second, because the consumption survey’s total is estimated by multiplying visitor arrivals by spending per person, a revision to JNTO’s headcount moves the spending figure too. Finally, from January 2026 data the Overnight Travel Statistics Survey changed its stratification basis from number of employees to number of rooms, and the published materials note that year-on-year changes may include the effect of this revision. When quoting year-on-year changes in person-nights, add this caveat. Preliminary occupancy figures also shift when the second preliminary release comes out, so state the release stage there as well.
Latest Figures — Key Points of the April–June 2026 Second Preliminary Release; July–September First Preliminary Due October 21
As of writing (October 9, 2026), the latest published figure is the April–June second preliminary release published on September 30, 2026. The July–September first preliminary release has not yet been published; the Japan Tourism Agency’s release calendar schedules it for October 21, 2026 (with a note that dates are subject to change). The main April–June figures are listed below.
| Metric (April–June 2026, second preliminary) | Published value | YoY |
|---|---|---|
| Foreign visitor travel spending | ¥2.5125 trillion | +0.3% |
| of which accommodation (36.6% share) | ¥920.7 billion | −4.5% |
| of which shopping (27.1% share) | ¥682.1 billion | +4.2% |
| of which food & drink (21.7% share) | ¥546.3 billion | +3.9% |
| of which transport (10.1% share) / entertainment & services (4.3% share) | ¥252.7 billion / ¥109.0 billion | −0.6% / +5.6% |
| Travel spending per person (general visitors, all purposes) | ¥244,733 | +3.4% |
| of which accommodation | ¥89,787 | — |
| Average nights stayed (general visitors) | 8.6 nights | −0.8 nights |
| Travel spending per person per night (general visitors, all purposes) | ¥28,510 | +13.3% |
| of which accommodation per person per night | ¥10,460 | +7.5% |
| Calendar year 2025 (final) foreign visitor travel spending | ¥9.4549 trillion | +16.4% (YoY) |
Source: Japan Tourism Agency, Inbound Consumption Trend Survey, April–June 2026 (second preliminary) and calendar year 2025 (final). YoY for categories and per-person-per-night values calculated by the HotelBank Editorial Team against the April–June 2025 final figures
By nationality/region, travel spending in order of published value was the United States ¥386.0 billion (15.4% share), Taiwan ¥361.8 billion (14.4%), China ¥263.5 billion (10.5%), South Korea ¥258.1 billion (10.3%) and Hong Kong ¥143.9 billion (5.7%). A year earlier China had ranked first at ¥506.4 billion (20.2%), but this article does not go into the background by nationality; how total accommodation spending rose in January–March even as Chinese visitors halved, and how person-nights have moved since, are separate questions best read from the quarterly and monthly releases themselves.
Finally, a note on etiquette when quoting the figures. Always attach “first preliminary”, “second preliminary” or “final” to quarterly values, and update first preliminary figures once the second preliminary release is out. When comparing shares with the previous year, compare figures from the same stage (comparing a second preliminary value with the previous year’s final figure is acceptable, but do not mix it with comparisons between first preliminary figures). And do not quote accommodation spend per person per night as a room rate. Following just these three points will considerably reduce misreadings in internal documents.
Summary
The Inbound Consumption Trend Survey is the Japan Tourism Agency’s quarterly statistic that kept the same design as its predecessor, the Consumption Trend Survey for Foreigners Visiting Japan, while changing its name and purpose from April–June 2024. It is a demand-side statistic asking visitors about their spending just before departure; the first preliminary release is weighted by the year-earlier headcount mix, and the second preliminary and final releases by the current-quarter mix. The accommodation category includes private lodging and long-stay rent, and accommodation spend per person per night is a tax-and-service-inclusive amount divided by person-nights, so it cannot be compared with a per-room, tax-exclusive ADR. The latest April–June 2026 second preliminary release shows ¥2.5125 trillion with accommodation at 36.6%, and the July–September first preliminary release is scheduled for October 21. Once it is published, the “Latest Figures” section of this article will be updated.
Frequently Asked Questions
Q. Are the Inbound Consumption Trend Survey and the Consumption Trend Survey for Foreigners Visiting Japan different statistics?
A. They are the same survey. In a press release on April 5, 2024, the Japan Tourism Agency announced that it would be conducted as the Inbound Consumption Trend Survey from the April–June 2024 survey. Because the survey items and estimation method have not changed, figures are comparable with January–March 2024 and earlier.
Q. Should I quote the first or the second preliminary release?
A. If the second preliminary release has been published, use it, and always state the release stage. The first preliminary release is a provisional value weighted by the year-earlier departure mix, which is replaced by the current-quarter mix in the second preliminary release. For April–June 2026, the total was revised from ¥2.5096 trillion to ¥2.5125 trillion and accommodation’s share from 37.0% to 36.6%.
Q. Can the accommodation spend per person per night of ¥10,460 be treated as foreign visitors’ hotel room rate?
A. No. This value is the per-person amount paid, including taxes and service charges, divided by person-nights, and includes private lodging, long-stay rent and person-nights with zero accommodation cost. It differs in both unit and universe from a per-room, tax-exclusive room rate (ADR), so it cannot be substituted for one.
Q. When will the July–September 2026 results be published?
A. According to the Japan Tourism Agency’s tourism statistics release calendar, the first preliminary release is scheduled for October 21, 2026 and the second preliminary release for December 24, 2026. The calendar notes that dates are subject to change.
Related Articles
References & Sources
■ Data sources
Published materials of the Japan Tourism Agency’s Inbound Consumption Trend Survey (April–June 2026 first and second preliminary releases, calendar year 2025 final release, survey overview, glossary of terms, survey history); the Japan Tourism Agency’s Overnight Travel Statistics Survey, Travel and Tourism Consumption Trend Survey and tourism statistics release calendar; and JNTO Visitor Arrivals Statistics. Estimated transacted ADR is aggregated by MetroEngines Research (April–June 2026, by prefecture, covering hotels and ryokan listed on OTAs and similar channels).
■ Calculation assumptions
Figures from official statistics are quoted as published. YoY changes by category and per person per night were calculated by the HotelBank Editorial Team from the April–June 2026 second preliminary release and the April–June 2025 final release. Revisions from the first to the second preliminary release are the differences between the two published values. Estimated transacted ADR is the average of each month’s prefectural median over the three months of April–June 2026; the number of covered properties is given in the chart’s source note.
■ Limitations & caveats
Quarterly values for 2026 are preliminary and may be revised by the calendar-year final release (scheduled for March 31, 2027). Cruise passenger spending for January–March and April–June 2026 is a reference value, and because surveyed countries were added from the 2026 survey, care is needed in nationality time-series comparisons. Accommodation spend per person per night and estimated transacted ADR differ in unit, tax treatment and universe, so their levels cannot be compared. Estimated transacted ADR is an estimate and differs from each property’s actual transacted prices and accounting figures. Scheduled release dates are subject to change.
■ Published materials & sources
- Japan Tourism Agency, Inbound Consumption Trend Survey (formerly the Consumption Trend Survey for Foreigners Visiting Japan) statistics page
- Japan Tourism Agency, “Inbound Consumption Trend Survey, April–June 2026 — Summary of Results (Second Preliminary)” (September 30, 2026)
- Japan Tourism Agency, press release “Results of the Inbound Consumption Trend Survey, April–June 2026 (First Preliminary)” (July 15, 2026)
- Japan Tourism Agency, “Inbound Consumption Trend Survey, Calendar Year 2025 — Summary of Results (Final)” (March 31, 2026)
- Japan Tourism Agency, “Overview of the Inbound Consumption Trend Survey” (coverage, method, estimation)
- Japan Tourism Agency, “Inbound Consumption Trend Survey — Glossary of Terms” (category definitions)
- Japan Tourism Agency, “Inbound Consumption Trend Survey — Survey History”
- Japan Tourism Agency, press release “Promoting use of microdata as the ‘Inbound Consumption Trend Survey'” (April 5, 2024)
- Japan Tourism Agency, tourism statistics release calendar
- Japan Tourism Agency, “Overnight Travel Statistics Survey: August 2026 First Preliminary, July 2026 Second Preliminary”
- Japan Tourism Agency, “Overview of the Overnight Travel Statistics Survey”
- Japan Tourism Agency, “Travel and Tourism Consumption Trend Survey, April–June 2026 (First Preliminary)” (August 19, 2026)
- Japan National Tourism Organization (JNTO), “Visitor Arrivals (August 2026 Estimate)” (September 16, 2026)
- Japan National Tourism Organization (JNTO), Visitor Arrivals Statistics
- MetroEngines Research — Estimated transacted ADR by prefecture (April–June 2026, covering hotels and ryokan listed on OTAs and similar channels)