

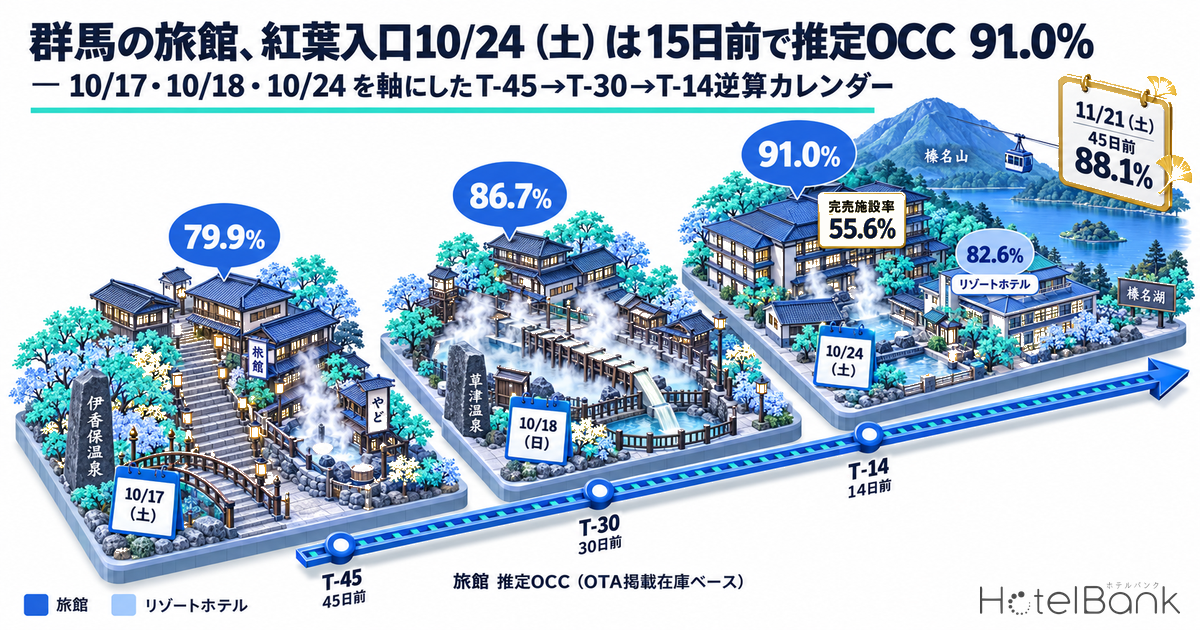
For ryokan and resort hotels in Gunma Prefecture, Saturday, October 24 marks the gateway to the autumn foliage season. As of October 10, 2026, estimated OCC (OTA-listed inventory basis) for ryokan (N=180 properties / 5,648 rooms) had built from 79.9% at 45 days before the stay date to 86.7% at 30 days, and to 91.0% at the latest reading (observed October 9, 15 days out). Resort hotels (N=22 properties / 2,134 rooms) moved 61.7% → 70.9% → 82.6% at the same three points: a lower level than ryokan, but with a gain since the 30-day mark more than twice as large. For the nearer dates of Saturday, October 17 and Sunday, October 18, ryokan had already reached 88.9% (8 days out) and 84.6% (9 days out) respectively, so the playbook for the final week shifts from “selling empty rooms” to “refining how they are sold.” Using these three stay dates as anchors, this article shows at fixed checkpoints how full the market was at T-45, T-30 and T-14, then turns that into a countdown calendar for November weekends and a three-stage action plan.
Coverage: ryokan in Gunma Prefecture (N=179–183 properties / 5,642–5,721 rooms, varying by stay date) and resort hotels (N=21–22 properties / 2,098–2,134 rooms). The price metric in this article is estimated settled ADR (the settled price level estimated from OTA and other sales data, tax-exclusive equivalent); occupancy is an estimate based on OTA-listed inventory. Both are defined at the end of the article. Data as of October 10, 2026.
• Estimated OCC (occupancy) = the share of sold rooms in the area’s total room count (an estimate based on inventory sold on OTAs). It covers a fixed cohort of properties that list 30% or more of their total rooms on OTAs, and is defined differently from actual room occupancy.
• Estimated settled ADR (average daily rate) = an estimated settled rate (tax-exclusive equivalent) calculated by applying category-specific adjustment coefficients to the lowest-plan level each property publishes on OTAs (two guests per room, rate per room, tax included). It is an estimate and differs from each property’s actual settled prices and accounting figures.
• Where listed prices are mentioned, they are rates per room for two guests per room (tax included).
• Source: MetroEngines Research (continuously tracking publicly listed OTA prices and inventory in Japan, including about 27,000 properties confirmed as operating). See “About the Data” at the end of the article for detailed definitions and the breakdown of N.
- — For Saturday, October 24, Gunma ryokan (N=180 properties / 5,648 rooms) moved 79.9% at 45 days out → 86.7% at 30 days → 91.0% at 15 days on an OTA-listed inventory basis (estimate). The sold-out property share also reached 55.6% (as of October 10, 2026).
- — Resort hotels (N=22 properties / 2,134 rooms) moved 61.7% → 70.9% → 82.6% at the same three points. The +11.7pt added since 30 days out is more than twice that of ryokan (+4.3pt), with demand concentrating in the final two to three weeks.
- — For Saturday, November 21, the first day of a three-day weekend, ryokan were already at 88.1% at 45 days out, more than 8pt above October 24 at the same point. Sundays also continue to hold 4–7pt more inventory than Saturdays, making rate benchmarks and how Sunday is sold the points to review for November.
Where 10/24 (Sat) Stands — Ryokan at 90% Two Weeks Out, Resort Hotels in the Low 80s
We start with the main subject, Saturday, October 24. Estimated OCC (OTA-listed inventory basis) for Gunma ryokan (N=180 properties / 5,648 rooms) was 79.9% on September 9, 45 days before the stay date; 86.7% on September 24, 30 days before; and 91.0% at the latest reading on October 9 (15 days before). The gain was +6.8pt over the 15 days from T-45 to T-30 and +4.3pt over the 15 days from T-30 to the latest reading — tapering in the second half, with the market as a whole close to “nearly sold through” two weeks out. The sold-out property share (the estimated share of properties with no listed inventory found on OTAs and similar channels) also rose 31.7% → 45.0% → 55.6%, so that more than half of the ryokan covered now show no listed inventory.
Resort hotels (N=22 properties / 2,134 rooms), by contrast, moved 61.7% → 70.9% → 82.6% at the same three points. The level at 45 days out was 18pt below ryokan, but the +11.7pt gain from 30 days out to the latest reading far exceeds the +4.3pt for ryokan. In other words, Gunma’s resort hotels draw their demand in the final two to three weeks even for a late-October Saturday, and the timing of bookings differs from ryokan, which fill early. The sold-out property share ran 9.1% → 9.1% → 22.7%, with sold-out properties only starting to increase at the latest reading.
For the following day, Sunday, October 25, ryokan stood at 74.4% → 78.8% → 86.2% (latest reading at 16 days out) and resort hotels at 60.6% → 66.1% → 75.5%, tracing the same shape one notch below Saturday. The latest gap to Saturday is 4.8pt for ryokan and 7.1pt for resort hotels; the pattern of remaining inventory concentrating on Sunday nights is common to both categories.
Source: MetroEngines Research, compiled by the HotelBank Editorial Team
Figure 1: Booking curves of estimated OCC (OTA-listed inventory basis) for Gunma ryokan. The horizontal axis is days remaining until the stay date (45 → 8); N=183 properties / 5,717 rooms for 10/17 and 10/18, N=180 properties / 5,648 rooms for 10/24 and 10/25. Based on readings from 45 days before the stay date to the latest.
10/17 (Sat) and 10/18 (Sun) — One Week Out, Ryokan Are Pinned Near the Ceiling
Next are Saturday, October 17 and Sunday, October 18, which are one week away at the time of publication. For ryokan (N=183 properties / 5,717 rooms), October 17 moved 76.8% at 45 days out → 83.7% at 30 days → 88.1% at 14 days → 88.9% at the latest reading (8 days out), a gain of only +0.8pt since the 14-day mark. Sunday, October 18 ran 70.9% → 77.3% → 83.3% → 84.6% (9 days out), still edging up by +1.3pt after the 14-day mark, slightly more than Saturday. The latest Sat–Sun gap is 4.3pt, and here too more inventory remains on the Sunday side.
For resort hotels (N=22 properties / 2,134 rooms), October 17 moved 59.3% → 68.8% → 74.6% (14 days out) → 73.9% (8 days out), slipping slightly at the latest reading. Because this is an estimate based on listed inventory, the figure can fall when allotments are added close to the date; the natural reading here is “allotments were opened late” rather than “rooms did not sell.” Sunday, October 18 ran 54.2% → 62.2% → 68.4% → 71.6% (9 days out), adding a further +3.2pt after the 14-day mark. Resort Sundays do not firm up as early as ryokan, and nearly 30% of inventory is still on the market one week out.
Source: MetroEngines Research, compiled by the HotelBank Editorial Team
Figure 2: Booking curves of estimated OCC (OTA-listed inventory basis) for Gunma resort hotels. The horizontal axis is days remaining until the stay date (45 → 8); N=22 properties / 2,134 rooms. Based on readings from 45 days before the stay date to the latest.
| Stay date | Category | N (properties / rooms) | T-45 | T-30 | T-14 | Latest (lead time) |
|---|---|---|---|---|---|---|
| 10/17 (Sat) | Ryokan | 183 / 5,717 | 76.8% | 83.7% | 88.1% | 88.9% (8 days out) |
| 10/17 (Sat) | Resort hotels | 22 / 2,134 | 59.3% | 68.8% | 74.6% | 73.9% (8 days out) |
| 10/18 (Sun) | Ryokan | 183 / 5,717 | 70.9% | 77.3% | 83.3% | 84.6% (9 days out) |
| 10/18 (Sun) | Resort hotels | 22 / 2,134 | 54.2% | 62.2% | 68.4% | 71.6% (9 days out) |
| 10/24 (Sat) | Ryokan | 180 / 5,648 | 79.9% | 86.7% | — | 91.0% (15 days out) |
| 10/24 (Sat) | Resort hotels | 22 / 2,134 | 61.7% | 70.9% | — | 82.6% (15 days out) |
| 10/25 (Sun) | Ryokan | 180 / 5,648 | 74.4% | 78.8% | — | 86.2% (16 days out) |
| 10/25 (Sun) | Resort hotels | 22 / 2,134 | 60.6% | 66.1% | — | 75.5% (16 days out) |
Source: MetroEngines Research, compiled by the HotelBank Editorial Team
Recasting Table 1 as gains: ryokan add +4.4–6.9pt from T-45 to T-30 and +4.4–6.0pt from T-30 to T-14, then converge to around +1pt after T-14. Resort hotels add +5.5–9.5pt from T-45 to T-30 and +9–12pt from T-30 to the latest reading (+5.1pt for 10/17, where allotments were added late), so excluding 10/17 the weight sits in the second half. Even within the same prefecture, the difference in timing — “ryokan are decided in the first half, resort hotels in the second” — translates directly into a different promotional calendar. In Gunma Ryokan vs Resorts: +3.2pt and +5.5pt Gains from 45 Days Out, which tracked stay dates in the first half of September at the same three checkpoints, resort hotels likewise gained more than ryokan; read together, the two show whether Gunma’s category difference carries over across seasons.
September Day-of-Week Pattern and November Forward Dates — Demand Concentrates on Saturday, Inventory Lingers on Sunday
As a yardstick for reading October weekends, we first sort daily actuals for the completed month of September 2026 by day of week. For ryokan (N=132–189 properties / 4,650–5,806 rooms, varying by day), the September average was 84.9%, with Saturday at 92.6% and Sunday at 88.2% against Wednesday at 80.3% and Thursday at 80.5% — a gap of about 12pt between Saturday and midweek. For resort hotels (N=21–27 properties / 1,772–2,302 rooms, varying by day), the monthly average was 73.1%, with Saturday at 84.5% and Sunday at 77.3% against Wednesday at 63.4% and Thursday at 64.4%, a gap of about 21pt, wider than for ryokan. Over the holiday run from Saturday, September 19 to Tuesday, September 22, ryokan were at 99.2–99.7% and resort hotels at 97.9–99.5% — effectively full in both categories — showing that holiday periods and ordinary Saturdays are driven by different demand. In Gunma Day-of-Week OCC: Ryokan Trough Wed 78.9%, Business Sun 81.3%, which broke down July actuals by day of week and category, the trough for ryokan and resort hotels was also Wednesday; the day-of-week shape has not changed much from summer into autumn.
| Day of week | Ryokan (N=132–189 / 4,650–5,806 rooms) | Resort hotels (N=21–27 / 1,772–2,302 rooms) |
|---|---|---|
| Monday | 86.7% | 76.5% |
| Tuesday | 84.0% | 73.5% |
| Wednesday | 80.3% | 63.4% |
| Thursday | 80.5% | 64.4% |
| Friday | 83.4% | 74.5% |
| Saturday | 92.6% | 84.5% |
| Sunday | 88.2% | 77.3% |
| September average | 84.9% | 73.1% |
Source: MetroEngines Research, compiled by the HotelBank Editorial Team
Applying this yardstick to Saturday, October 24, the 91.0% for ryokan (15 days out) is already nearly level with the September Saturday average of 92.6% two weeks ahead of the date, and the 82.6% for resort hotels is closing in on the September Saturday average of 84.5%. One way to read this is that the weekend at the gateway to foliage season has reached an ordinary-Saturday level two weeks early.
For November weekends further out, we confirm the current position using only readings within 45 days of the stay date. Ryokan stood at 80.5% at 45 days out → 88.5% at the latest reading (22 days out) for Saturday, October 31; 81.8% → 87.5% (29 days out) for Saturday, November 7; and 83.1% → 86.0% (36 days out) for Saturday, November 14 — already in the 80s at the 45-day mark. The date to watch is Saturday, November 21: 88.1% at 45 days out and 88.7% at the latest reading (43 days out), a start more than 8pt above where October 24 stood at 45 days out (79.9%). It is the first day of the November 21–23 three-day weekend, and the sold-out property share was 63.9% at 43 days out, meaning more than 60% of the ryokan covered show no listed inventory. Resort hotels are at lower levels than ryokan — October 31 at 65.0% → 76.0%, November 7 at 55.9% → 62.9%, November 14 at 53.3% → 57.5% and November 21 at 65.3% → 63.3% — and for the Sunday in late November (November 22), half is still available at 50.3%, 44 days out.
| Stay date | T-45 | T-30 | T-14 | Ryokan: 45 days out → latest | Resort hotels: 45 days out → latest |
|---|---|---|---|---|---|
| 10/31 (Sat) | 9/16 | 10/1 | 10/17 | 80.5%→88.5% (22 days out) | 65.0%→76.0% (22 days out) |
| 11/1 (Sun) | 9/17 | 10/2 | 10/18 | 74.5%→84.9% (23 days out) | 57.0%→69.4% (23 days out) |
| 11/7 (Sat) | 9/23 | 10/8 | 10/24 | 81.8%→87.5% (29 days out) | 55.9%→62.9% (29 days out) |
| 11/14 (Sat) | 9/30 | 10/15 | 10/31 | 83.1%→86.0% (36 days out) | 53.3%→57.5% (36 days out) |
| 11/21 (Sat) | 10/7 | 10/22 | 11/7 | 88.1%→88.7% (43 days out) | 65.3%→63.3% (43 days out) |
| 11/22 (Sun) | 10/8 | 10/23 | 11/8 | 83.4%→83.5% (44 days out) | 50.6%→50.3% (44 days out) |
Source: MetroEngines Research, compiled by the HotelBank Editorial Team
Estimated Settled ADR — Ryokan October: ¥15,300 Final Last Year, ¥16,000 Current Estimate
For reference on pricing, we look at Gunma’s estimated settled ADR (tax-exclusive equivalent, monthly) by category. Comparing finalized months for ryokan (N=239–304 properties, varying by month) with the same month a year earlier, August 2026 was ¥18,100 (N=278), up +3.3% from ¥17,500 (N=268), and September 2026 was ¥15,500 (N=289), up +4.2% from ¥14,900 (N=271). For October, the prior-year final figure was ¥15,300 (N=271), and the estimate for October 2026 based on current sales conditions is ¥16,000 (N=285). A simple comparison with the prior-year final figure works out to +4.6%, but a like-for-like comparison of final figures has to wait for the month to close; here we go no further than reading it as “final YoY ran at +3–4% in August and September, and the current October estimate sits on the same trajectory.”
Resort hotels (N=29–35 properties) posted stronger growth than ryokan in finalized months: August 2026 was ¥19,100 (N=35), up +12.8% from ¥16,900 (N=34), and September was ¥15,500 (N=35), up +9.3% from ¥14,100 (N=34). The prior-year final figure for October was ¥13,800 (N=34) and the current estimate is ¥15,000 (N=34). Looking at last year’s seasonal shape, ryokan rates rose from ¥15,300 in October to ¥18,000 in November and ¥18,700 in December, climbing from peak foliage toward year-end, and resort hotels also jumped from ¥14,200 in November to ¥19,200 in December. For both categories, October is the month that sits “just before the year-end rise in rates.”
Source: MetroEngines Research, compiled by the HotelBank Editorial Team
Figure 3: Estimated settled ADR for Gunma ryokan (tax-exclusive equivalent, monthly). 2025 and January–September 2026 are final figures; October–December 2026 are estimates based on current sales conditions (dotted line, subject to change). N=239–304 properties (varying by month).
| Month | Ryokan 2025 (final) | Ryokan 2026 | Ryokan YoY | Resort 2025 (final) | Resort 2026 | Resort YoY |
|---|---|---|---|---|---|---|
| August | ¥17,517 (N=268) | ¥18,102 (N=278, final) | +3.3% | ¥16,890 (N=34) | ¥19,055 (N=35, final) | +12.8% |
| September | ¥14,903 (N=271) | ¥15,523 (N=289, final) | +4.2% | ¥14,134 (N=34) | ¥15,454 (N=35, final) | +9.3% |
| October | ¥15,328 (N=271) | ¥16,029 (N=285, current estimate) | Pending | ¥13,802 (N=34) | ¥14,971 (N=34, current estimate) | Pending |
| November | ¥17,972 (N=265) | ¥16,710 (N=268, current estimate) | Pending | ¥14,240 (N=34) | ¥13,909 (N=33, current estimate) | Pending |
Source: MetroEngines Research, compiled by the HotelBank Editorial Team
Distribution of Remaining Inventory for 10/24 — A Third of Ryokan Sold Out, Just Over 10% Still Have More Than Half Left
Behind the market average, it is also worth looking at how remaining inventory is spread across individual properties. For Saturday, October 24, taking the 152 Gunma ryokan (3,391 rooms) whose listed inventory was built up to 30% or more of total rooms, 52 properties (34.2%) were sold out (0% left), 47 (30.9%) had 1–20% left, 35 (23.0%) had 21–50% left, and 18 (11.8%) had 51% or more left. Of the 152 properties, 84 were observed sold out at least once; the first sold-out reading came 45 or more days before the stay date for 37 properties, 30–44 days before for 22, and 14–29 days before for 25 (this includes properties whose allotments later reopened, so it does not match the 52 currently sold out; readings beyond 45 days may include the state before listed allotments were loaded). The fact that first sell-outs are spread across three time bands means that at each of the T-45, T-30 and T-14 checkpoints, properties “selling out at that point” and properties “with rooms still left” coexisted.
Resort hotels number only 18 properties (1,759 rooms) under the same condition, a small base, but 4 were sold out, 7 had 1–20% left, 6 had 21–50% left and 1 had 51% or more left, with a median of 15.0% left. Together with the ryokan median of 10.0% left, this means that two weeks out a property “in the middle of the market” still has about 10% of its rooms left if it is a ryokan, and about 15% if it is a resort hotel.
| Share left | Ryokan (N=152 / 3,391 rooms) | Resort hotels (N=18 / 1,759 rooms) |
|---|---|---|
| Sold out (0% left) | 52 properties (34.2%) | 4 properties |
| 1–20% left | 47 properties (30.9%) | 7 properties |
| 21–50% left | 35 properties (23.0%) | 6 properties |
| 51%+ left | 18 properties (11.8%) | 1 property |
| Median share left | 10.0% | 15.0% |
Source: MetroEngines Research, compiled by the HotelBank Editorial Team
For Revenue Managers Running Ryokan and Resort Hotels in Gunma — Implications and Action Plan
Operator-side insights
First, overlay your own curve on the market’s checkpoints. For Saturday, October 24, the market path was 79.9% at 45 days out, 86.7% at 30 days and 91.0% at 15 days for ryokan, and 61.7%, 70.9% and 82.6% for resort hotels. Lining up your own pace for the same date at the same checkpoints, and identifying the interval in which you fell behind (or ran ahead of) the market, shows when to act for the next Saturday. Properties that fill earlier than the market have room to revisit rates; those that lag, the timing of promotion.
Second, the weight of the gains differs between ryokan and resort hotels. For ryokan, gains narrow to +4–6pt after T-30 and stall at around +1pt after T-14. For resort hotels, the weight is in the second half, at +9–12pt from T-30 to the latest reading (excluding 10/17). If a ryokan still has a lot of inventory two weeks out, the market has already finished moving, so this is a phase for exposure and product (reshuffling room types, adding value) rather than price; for resort hotels, market demand keeps flowing in even two weeks out, so there is relatively more room for rate adjustments to work.
Third, the inventory left on Sunday nights. The latest gap between October 24 and 25 is 4.8pt for ryokan and 7.1pt for resort hotels, and in September actuals the Sat–Sun gap was 4.4pt for ryokan and 7.2pt for resort hotels. The earlier Saturday fills, the more the choice between selling Sunday on its own and using Sat–Sun two-night products to pull Saturday demand into Sunday tends to shape revenue for the whole weekend.
Fourth, the start for Saturday, November 21. The first day of the three-day weekend was at 88.1% for ryokan at 45 days out, with a sold-out property share of 63.9% (43 days out), more than 8pt above October 24 at the 45-day mark. If rates for this date are left on the same basis as October Saturdays, pricing may be left behind relative to the strength of demand. The seasonal shape — last year’s final ryokan ADR for November, ¥18,000, was more than ¥2,600 above October’s ¥15,300 — is further input for that review.
Action plan (three stages: T-45 / T-30 / T-14) — Decision triggers are tied to the market figures shown in this article. October 17, 18 and 24 are already past T-14, so only the final stage applies; for November weekends, apply each stage along the calendar in Table 3.
| Timing | Action | Decision trigger (figures from this article) | Aim |
|---|---|---|---|
| T-45 (10/7 for 11/21; 10/8 for 11/22) | Check inventory and minimum selling rates. Align allotments across room types and set rate floors in line with the seasonal pattern | For 11/21 (Sat) the market was at 88.1% at 45 days out. If your property is well below the market for that date, check for under-exposed allotments; if it is above, check whether the rate floor is too low | Avoid leaving rate on the table on dates that fill early |
| T-45 | Design Sat–Sun two-night and Sunday-night products. Decide whether to sell Sunday on its own or steer guests to consecutive nights | The Sat–Sun gap in September actuals was 4.4pt for ryokan and 7.2pt for resort hotels. The latest gap for 10/24 vs 10/25 is also 4.8pt for ryokan and 7.1pt for resort hotels | Use Saturday demand to fill Sunday |
| T-30 (10/8 for 11/7; 10/15 for 11/14; 10/22 for 11/21) | Promote dates with more inventory left. Identify the weekdays and Sundays where pace lags the market, and concentrate exposure and product there | The ryokan market stood at 77.3–86.7% at T-30, resort hotels at 62.2–70.9%. Focus on dates where your property is 5pt or more below these | Catch up before the gains taper off |
| T-30 | Review November rates. Check whether they have simply been left on the October basis | Prior-year final ryokan ADR: November ¥17,972, December ¥18,742 (October ¥15,328). Current estimates for October 2026: ryokan ¥16,029, resort hotels ¥14,971 | Capture the seasonal rise in rates |
| T-14 (10/17 for 10/31; 10/24 for 11/7; 10/31 for 11/14) | Release held inventory and promote added value. Put withheld allotments on the market and sell them while protecting rate through added value around meals, hot-spring bathing and autumn foliage | Ryokan gains after T-14 stall at around +1pt, while resort hotels add +9–12pt from T-30 to the latest reading (excluding 10/17). Exposure and product tend to work for ryokan; rate adjustments for resort hotels | Fill the last rooms without relying on discounts |
| T-14 (10/17, 10/18 and 10/24 are already in this stage) | Daily checks over the final week. Bearing in mind that added allotments move the estimate (resort hotels on 10/17: 74.6% at 14 days out → 73.9% at 8 days out), compare your remaining share with the market median share left (ryokan 10%, resort hotels 15%) | Run last-minute measures only on dates where your remaining share is well above the market median | Narrow down the dates to act on |
Every action here starts from a comparison with market readings, and results will differ with each property’s location, guest mix and product lineup. This is not a guarantee of results; it is intended as a framework for building the habit of comparing your own curve with the market curve at the same checkpoints.
Summary — Three Yardsticks
The checkpoints shown here for Gunma’s ryokan and resort hotels boil down to three yardsticks. First, “ryokan at 80% at 45 days out, mid-80s at 30 days, 90% at two weeks” is the market path for a late-October Saturday, and the interval in which your property lags that path is when to act. Second, “resort hotels are decided in the second half”: +9–12pt (excluding 10/17) is added from 30 days out to the latest reading, so there is no need to be pessimistic about inventory left two weeks out, but rate-adjustment decisions concentrate close to the date accordingly. Third, the Sat–Sun gap — “Sunday keeps 4–7pt more inventory than Saturday” — is consistent in both September actuals and October forward dates, and weekend revenue is differentiated by how Sunday is sold. With Saturday, November 21, the first day of the three-day weekend, starting at 88.1% at 45 days out, the peak-foliage weekends will likely call for resetting these yardsticks one notch higher.
About the Data
| Estimated OCC (OTA-listed inventory basis) | OTA-listed inventory-based occupancy = 100 − 100 × rooms remaining listed on OTAs ÷ total rooms. Covers a fixed cohort of properties that list 30% or more of their total rooms on OTAs (the same set of properties for each stay date; N is the number of properties). This is an estimate based on the sell-through of inventory sold on OTAs and is defined differently from actual room occupancy (it runs high because unlisted rooms are counted as sold). |
| Booking curve | Based on readings from 45 days before the stay date to the latest. There are four checkpoints — 45 days out, 30 days out, 14 days out and the latest reading — and the latest observation date is October 9, 2026. |
| Estimated settled ADR | The settled price level (tax-exclusive equivalent) estimated from OTA and other sales data (lowest-plan level × category-specific coefficients; an ensemble of multiple channels). Past months are final figures; current and future months are estimates based on current sales conditions. Median error of 6.6% when checked against published operating results. Monthly values are canonical; daily and day-of-week prices are not covered. |
| Breakdown of N | Booking curves: ryokan N=179–183 properties / 5,642–5,721 rooms, resort hotels N=21–22 properties / 2,098–2,134 rooms (the fixed cohort varies by stay date). September actuals: ryokan N=132–189 properties / 4,650–5,806 rooms, resort hotels N=21–27 properties / 1,772–2,302 rooms (varying by day). Estimated settled ADR: ryokan N=239–304 properties, resort hotels N=29–35 properties (varying by month). Distribution of remaining inventory: 152 ryokan / 3,391 rooms and 18 resort hotels / 1,759 rooms with listed inventory observed at 30% or more of total rooms. |
| Sold-out property share | The estimated share of properties with no listed inventory found on OTAs and similar channels. |
| Data as of | October 10, 2026. Sales conditions and inventory change daily, so the figures in this article are a snapshot at the time of retrieval. |
Source: MetroEngines Research, compiled by the HotelBank Editorial Team
References and Sources
Statements on foliage timing draw on the following. Around Kusatsu Onsen (Kusatsu Tenguyama), the usual best viewing period is mid-October to early November, and as of October 10, 2026 the leaves were reported as beginning to turn. The Kajika Bridge Autumn Foliage Light-up 2026 at Ikaho Onsen is announced for Tuesday, October 27 to Sunday, November 15, making Saturday, October 24 the weekend immediately before it.