

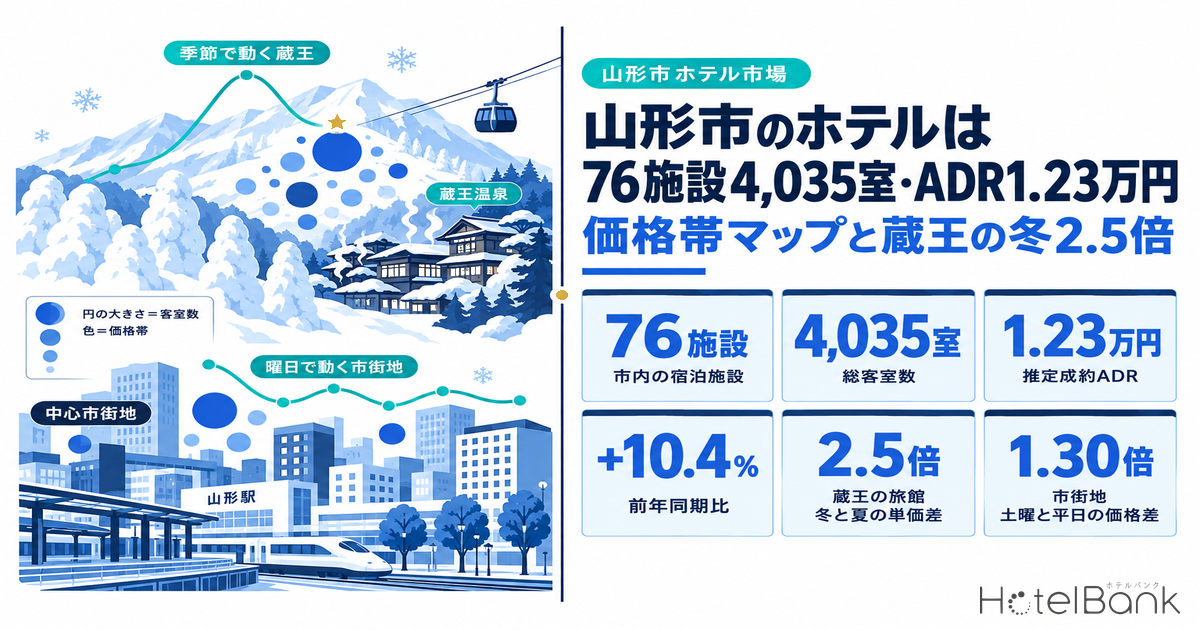
Lay out Yamagata City’s hotel market property by property and two very different catchments come into view within a single municipality: the cluster of business hotels around the station in the prefectural capital, and Zao Onsen, a hot-spring resort at roughly 900m above sea level. According to a tally by MetroEngines Research & Consulting as of October 5, 2026, lodging properties in Yamagata City confirmed on sale on major booking sites numbered 76 properties with 4,035 rooms, and the estimated settled ADR over the latest 12 months (October 2025–September 2026) was ¥12,300, 10.4% above the prior-year period.
This article walks through Yamagata City’s hotel supply (property count, room count and segment mix), the distribution of rooms by price band, how rates swing by season and day of week, and new supply, before closing with an investor’s and operator’s read on which price bands still have room.
Metric Definitions Used in This Article
- ADR (average daily rate): an estimated settled rate (tax-excluded equivalent), derived by applying segment-specific adjustment factors to the lowest-plan level each property publishes on major booking sites (per room for two guests, tax included). Its median error against property-level actuals disclosed by listed hotel REITs is about 7%. It is an estimate and differs from each property’s actual settled prices and accounting figures. Area-level ADR is the median of the covered properties (the level of a typical property in the area). Covered segments: business hotels, city hotels, resort hotels, ryokan and capsule hotels.
- Listed price: the published price averaged across all plans (room-only through meal-inclusive), per room for two guests (tax included). Because its basis differs from the estimated settled ADR, this article labels the two separately.
- OCC (occupancy): the share of rooms sold out of total rooms in the area (an estimate based on OTA sales inventory). It is estimated from how inventory sold on major booking sites is absorbed and differs from a property’s actual overall occupancy.
- GOP yield: assumed GOP (gross operating profit) ÷ total investment. Excludes depreciation, interest, taxes and FF&E reserves.
- Covered properties: 76 properties with 4,035 rooms in Yamagata City confirmed on sale on major booking sites in July–September 2026 (based on listings on major booking sites). Properties without listings are not included.
- Data source: MetroEngines Research & Consulting (tallied October 5, 2026)
- — 68% of rooms are in the city center, 57% of properties are in Zao Onsen — The city center has 27 properties with 2,728 rooms; Zao Onsen has 43 properties with 1,006 rooms. The center of gravity by scale and by property count sit in different places.
- — The city’s estimated settled ADR is 1.27x the prefecture’s — ¥12,333 for Yamagata City versus ¥9,746 for Yamagata Prefecture (both monthly averages for October 2025–September 2026). YoY: city +10.4%, prefecture +9.6%.
- — 57% of rooms sit below ¥10,000; the city center has 0 properties at ¥15,000+ — Of the 57 properties / 3,768 rooms with an estimated settled ADR, 2,154 rooms are below ¥10,000. All 27 properties at ¥15,000+ are in or around Zao Onsen.
- — Zao moves with the season, the city center with the day of week — Ryokan ADR in February is 2.5x July’s. Saturday listed prices at business and city hotels in the city center are 1.30x weekdays (September 2026).
- — Investment room lies in “the city center’s ¥10,000s” and “Zao’s year-round ¥30,000 band” — A new 120-room build needs an ADR of about ¥16,100 to yield 8%. Repositioning an existing asset reaches the 10% range in our model even at current rate levels.
Hotel Supply in Yamagata City — 76 Properties and 4,035 Rooms, 68% of Rooms in the City Center
Start with the overall supply picture. Lodging properties in Yamagata City confirmed on sale on major booking sites in July–September 2026 numbered 76, with 4,035 rooms. Split by location, the city center, running from around Yamagata Station to Nanokamachi, has 27 properties with 2,728 rooms; Zao Onsen has 43 properties with 1,006 rooms; and other districts such as Kurosawa Onsen, Yamadera and Zao Iida have 6 properties with 301 rooms. The city center holds 67.6% of rooms, while Zao Onsen accounts for a majority of properties at 56.6% — a defining feature of Yamagata City is that its center of gravity by scale and by property count sit in different places.
| District | Business hotels | City hotels | Ryokan | Resort hotels | Other | Total | Share of rooms |
|---|---|---|---|---|---|---|---|
| City center | 17 properties, 2,094 rooms | 4 properties, 523 rooms | 2 properties, 21 rooms | — | 4 properties, 90 rooms | 27 properties, 2,728 rooms | 67.6% |
| Zao Onsen | 2 properties, 45 rooms | — | 23 properties, 606 rooms | 7 properties, 244 rooms | 11 properties, 111 rooms | 43 properties, 1,006 rooms | 24.9% |
| Other districts | 1 property, 181 rooms | — | 4 properties, 74 rooms | 1 property, 46 rooms | — | 6 properties, 301 rooms | 7.5% |
| Yamagata City total | 20 properties, 2,320 rooms | 4 properties, 523 rooms | 29 properties, 701 rooms | 8 properties, 290 rooms | 15 properties, 201 rooms | 76 properties, 4,035 rooms | 100% |
By segment, business hotels supply 57.5% of all rooms with 20 properties and 2,320 rooms, while ryokan are the most numerous at 29 properties with 701 rooms. The 15 properties with 100+ rooms hold 2,470 rooms, or 61.2% of the total, and every one of them is in the city-center side. Zao Onsen, by contrast, is a string of small inns: its largest has 60 rooms and its 43 properties average 23 rooms. Citywide, 42 properties have fewer than 30 rooms. Of the 60 properties whose opening year is known, 36 (60%) opened in 1999 or earlier, so long-running properties form the foundation of supply.
Measured ADR — Yamagata City at ¥12,300, 1.27x the Prefecture and +10.4% YoY
Next, check the rate level. Yamagata City’s estimated settled ADR averaged ¥12,300 per month over October 2025–September 2026 (covering an average of 58.6 properties per month). Yamagata Prefecture as a whole came to ¥9,700 over the same period (288.9 properties), so the city stands at 1.27x the prefecture. Against the prior-year period (October 2024–September 2025), the city rose 10.4% and the prefecture 9.6%, both growing by around a tenth. In the latest single month, September 2026, the city was ¥11,600 (+11.1% YoY) and the prefecture ¥9,300 (+7.1%), so the city continues to outpace the prefecture.
A point to note here is the gap between listed prices and the estimated settled ADR. The all-plan average listed price (two guests per room, tax included) is ¥24,800 for the city and ¥25,300 for the prefecture, slightly higher for the prefecture. Yet estimating a level closer to what actually settles puts the city about ¥2,600 above the prefecture. Hot-spring ryokan, with many high-priced meal-inclusive plans, tend to push up the average listed price, so describing market rates by listed prices alone drifts away from reality. That is why this article uses the estimated settled ADR for the price-band classification that follows.
| Category | Estimated settled ADR | Prior-year period | YoY | Listed price (all-plan average) | Properties covered (monthly average) |
|---|---|---|---|---|---|
| Yamagata City overall | ¥12,333 | ¥11,168 | +10.4% | ¥24,796 | 58.6 |
| Business hotels | ¥7,602 | ¥7,281 | +4.4% | ¥15,171 | 21.9 |
| City hotels | ¥10,368 | ¥9,098 | +14.0% | ¥21,516 | 4.0 |
| Ryokan | ¥17,318 | ¥16,482 | +5.1% | ¥38,727 | 24.7 |
| Resort hotels | ¥20,836 | ¥19,222 | +8.4% | ¥45,804 | 8.0 |
| Yamagata Prefecture overall (reference) | ¥9,746 | ¥8,896 | +9.6% | ¥25,255 | 288.9 |
By segment, resort hotels at ¥20,800 and ryokan at ¥17,300 — the two hot-spring-side segments — lift the citywide figure, while business hotels hold steady at ¥7,600. The citywide growth rate (+10.4%) looks larger than any single segment’s because area ADR is set by the median of covered properties, and the median tends to move up in months when Zao’s high-rate properties carry more weight in winter. The segment growth rates (business hotels +4.4%, ryokan +5.1%) are closer to what individual properties actually experience. For how YoY changes split by segment across the prefecture, see Yamagata ADR Splits by Segment: Business −4.8% in April, City +12.5%, which digs into settled figures for January–July 2026.
Price-Band Map — 57% of Rooms Below ¥10,000, 0 City-Center Properties at ¥15,000+
So how are properties distributed when their rates are arranged into price bands? We classified the 57 properties / 3,768 rooms with an estimated settled ADR for at least 6 of the latest 12 months into six bands by their monthly average. The result: 13 properties with 1,239 rooms (32.9%) fall below ¥8,000 and 7 properties with 915 rooms (24.3%) fall in ¥8,000–10,000, so the two bands below ¥10,000 alone hold 57.2% of rooms.
Overlaying districts shows clearly who fills each band. Of the 2,154 rooms below ¥10,000, 1,973 are at city-center properties; conversely, not a single city-center property is among the 27 properties / 836 rooms at ¥15,000 and above. Even the highest-priced city-center property stops at ¥14,400; the ¥10,000–15,000 band has 4 properties with 665 rooms, 3 of them 200-room-class hotels in front of Yamagata Station. In other words, the city-center side consists of two tiers — “large properties below ¥10,000” and “upper-tier station-front hotels in the low ¥10,000s” — and the bands above are left to the hot-spring resort. Price-band gaps of this kind show up in other regions too: the same method applied to Tokushima also found the ¥15,000–20,000 band empty among properties with 30 or more rooms.
| Estimated settled ADR | Under 30 rooms | 30–99 rooms | 100+ rooms | Total | Share of rooms |
|---|---|---|---|---|---|
| Under ¥8,000 | 3 properties, 46 rooms | 4 properties, 262 rooms | 6 properties, 931 rooms | 13 properties, 1,239 rooms | 32.9% |
| ¥8,000–10,000 | 1 property, 23 rooms | — | 6 properties, 892 rooms | 7 properties, 915 rooms | 24.3% |
| ¥10,000–15,000 | 7 properties, 131 rooms | — | 3 properties, 647 rooms | 10 properties, 778 rooms | 20.6% |
| ¥15,000–20,000 | 4 properties, 82 rooms | 8 properties, 329 rooms | — | 12 properties, 411 rooms | 10.9% |
| ¥20,000–30,000 | 7 properties, 97 rooms | 6 properties, 282 rooms | — | 13 properties, 379 rooms | 10.1% |
| ¥30,000+ | 2 properties, 46 rooms | — | — | 2 properties, 46 rooms | 1.2% |
| Total | 24 properties, 425 rooms | 18 properties, 873 rooms | 15 properties, 2,470 rooms | 57 properties, 3,768 rooms | 100% |
Dense City center × below ¥10,000 × 100+ rooms
11 properties, 1,642 rooms
The band where the city center’s large business hotels cluster. As the base for business-trip and event demand, it carries over 40% of rooms.
Gap 1 City center × ¥15,000+
0 properties
The city center tops out at ¥14,400. Above the upper-tier station-front hotels in the low ¥10,000s (4 properties, 665 rooms), one more band sits empty.
Gap 2 Year-round ¥30,000+
2 properties, 46 rooms
Even in Zao Onsen, only 2 small properties exceed ¥30,000 on an annual average. Inns that hold high rates year-round, not just in winter, are rare.
Seasonal Swings — Zao Ryokan Earn 2.5x in February vs July; the City Center Moves 1.3x Across the Year
Seasonality is essential to reading Yamagata City’s rates. The citywide estimated settled ADR rose to ¥18,500 in February 2026, 1.91x the low of ¥9,700 in July of the same year. The same ratio for the prefecture as a whole is 1.31x, so the city’s seasonal gap stands out even within the prefecture. Behind it is Zao Onsen, where demand concentrates in the season of snow monsters (frost-covered trees) and skiing. Within the prefecture, Zao forms one tier of a rate hierarchy alongside other hot-spring areas such as Ginzan Onsen and Kaminoyama Onsen.
Broken out by segment, the size of the swing differs completely. Ryokan went from ¥30,300 in February 2026 to ¥12,200 in July, a 2.47x gap, and resort hotels from ¥36,700 in February to ¥12,500 in June, reaching 2.94x. Business hotels, by contrast, show a ratio of just 1.28x between their peak in August (¥8,800) and trough in March (¥6,900), staying within ¥6,900–8,800 all year. The pattern holds at the property level: the median of 29 properties in Zao Onsen was ¥31,900 in February and ¥12,900 in June, a 2.5x gap, while 21 business and city hotels in the city center were ¥9,400 in February and ¥7,800 in June, a 1.2x gap.
Winter growth is also notable. Citywide, January 2026 was +16.0% YoY and February +18.6%, and ryokan posted double-digit growth two months running at +17.3% in January and +17.4% in February. Compared with +1.1% citywide in August, the rate increase over the past year was clearly winter-led. Estimates for this winter based on listing levels at the time of research are ¥16,400 for December 2026 (53 properties), ¥23,200 for January 2027 (47 properties) and ¥22,500 for February (45 properties). However, coverage shrinks the further out the month, and the basis differs from past months, so these should not be compared directly with prior-year actuals; they are best read as a directional sign that winter sales are starting from a high level.
Day-of-Week Swings — Saturday Is 1.30x Weekdays in the City Center, 1.14x in Zao
Where Zao moves with the season, it is the day of week that moves city-center rates. For listed prices (all-plan average) in September 2026, we set each property’s Monday–Thursday average to 1.00, computed day-of-week indices, and took the median across properties. Business and city hotels in the city center (22 properties) reached 1.30 on Saturday, with the uplift concentrated on that one weekend day. Properties in Zao Onsen (39 properties) were 1.14 on Saturday and nearly flat at 1.00 from Sunday through Friday.
Running the same tally for June and February 2026 showed the city center’s Saturday index varying from month to month, while Zao stayed in the 1.1x range in every month. Zao’s Saturday uplift holds steady at just over 10% regardless of season, suggesting its high winter rates are set as a level for the whole period rather than by day of week. The city center, conversely, is a market where rates move with weekends and event days more than with the season.
The day-of-week gap is visible in occupancy too. Yamagata City’s occupancy (estimated from OTA listed inventory) was 85.0% in June 2026, 81.1% in July, 87.4% in August and 87.8% in September (covering 30–35 properties and 1,762–1,997 rooms, based on listings on major booking sites). Looking at September by day, Saturday reached 93.0% and Sunday 82.2% against a Monday–Thursday average of 88.1%, and September 20, the middle of the Silver Week holidays, hit 99.5%. This occupancy is an estimate based on how inventory sold on major booking sites is absorbed and differs from actual overall occupancy, but the pattern of demand leaning toward Saturdays and holidays is consistent with the rate movements.
New Supply Pipeline — 4 Properties and 153 Rooms in 2026, Adding 49 Rooms to the Year-Round ¥30,000 Band
Supply-side changes are worth laying out too. New openings in Yamagata City that we confirmed through listings on major booking sites were 181 rooms in Iidanishi in 2019, 18 rooms near the station in 2020 and 204 rooms in front of Yamagata Station in 2021 — through 2021, mostly large business hotels in the city center. From 2022 to 2024, openings were limited to a small Zao Onsen property (9 rooms in 2023), with no large new openings confirmed. In 2025, too, the total was just 8 rooms — a 7-room lodge in Zao Onsen and a 1-room vacation rental in the city center — and relistings due to renaming of existing properties are not counted as net additions.
| Opening year | Properties | Rooms | Breakdown |
|---|---|---|---|
| 2019 | 1 | 181 | Business hotel in the southern city center |
| 2020 | 1 | 18 | Small hotel in front of Yamagata Station |
| 2021 | 1 | 204 | Business hotel in front of Yamagata Station |
| 2022–2024 | 1 | 9 | Resort property in Zao Onsen (2023) |
| 2025 | 2 | 8 | 7-room lodge in Zao Onsen, 1-room vacation rental in the city center |
| 2026 | 4 | 153 | City center 72 rooms and 25 rooms, a 7-room ryokan in Zao Onsen, KAI Zao (界 蔵王) 49 rooms (scheduled to open October 15) |
2026 marked a change in the trend. Newly confirmed listings came to 4 properties with 153 rooms, equal to 3.8% of the existing 4,035 rooms. The breakdown: 72 rooms and 25 rooms in the city center, a 7-room ryokan in Zao Onsen, and the 49-room hot-spring ryokan KAI Zao (界 蔵王), scheduled to open on October 15. According to Hoshino Resorts’ announcement, the property marks the brand’s first entry into Yamagata Prefecture, with rates quoted from ¥31,000 per person for two guests per room (dinner and breakfast, tax and service included). As shown in the previous section, only 2 properties with 46 rooms in the city exceed ¥30,000 on an annual average, so a 49-room entry would nearly double the rooms in this band. Its rate trajectory will be a useful gauge of how far Zao’s high-rate band can extend beyond winter. On the city-center side, a 237-room hotel is also scheduled to open in front of Yamagata Station in March 2028, adding about 9.9% to the 2,398 rooms within 1km of the station.
Beyond guest rooms, options for longer stays have been widening. In December 2022, the stay-oriented bathing facility “Ofuro Cafe yusa (おふろcafe yusa)” opened in Yamagata City, and long day-use visits are taking root locally. Facilities like this, filling the space between the hot-spring resort and the city center, can be a tailwind for lodging too by giving guests reasons for multi-night stays or nights before and after.
Location Assessment — Station-Front Commercial Land at ¥220,000/㎡; Assumptions Split Between the City Center and Zao
Let’s also check land prices, a key input for investment. According to the Ministry of Land, Infrastructure, Transport and Tourism (MLIT) official land price publication (2026), Yamagata City’s highest-priced point is Nanokamachi 1-chome at ¥223,000 per ㎡ (+0.9% YoY), Kasumicho 3-chome in front of Yamagata Station is ¥220,000 (+0.92%), and the average for commercial land in the city is ¥96,483 per ㎡ (+1.26%). Prices continue to rise but only gently, around 1% a year, unlike station fronts in major cities where land cost heavily drives feasibility. In the model below, too, land accounts for less than 5% of total investment.
The two catchments differ in character. The city center, backed by Yamagata Station — a stop on the Yamagata Shinkansen — and the administrative functions of the prefectural capital, is a location where weekday business travel overlaps with weekend events and tourism, and as the day-of-week index in the previous section shows, rates rise on Saturdays. Zao Onsen is a mountain hot-spring resort about 40 minutes by bus from Yamagata Station, with ski slopes and snow monsters as winter draws, and its rates are set by the season. Within the same city, revenue in the former hinges on days occupied and weekend rates, and in the latter on the length of the season.
On ties with the community, the initiative at Comfort Hotel Yamagata (コンフォートホテル山形, 108 rooms) in front of the station offers a useful reference. Its operator, Greens Co., Ltd., signed an agreement with Yamagata City in March 2024 on providing lodging facilities during disasters, setting up a system to offer guest rooms as evacuation shelters for people requiring special care. It is an example of turning a lodging facility’s 24/7, year-round operation into part of the local safety net, and the hotel’s estimated settled ADR of about ¥8,700 is above the median of the city center’s 17 business hotels (about ¥7,500). Operating in a way that combines a station-front location with community partnership is one model for anyone setting up a new business in the city center.
Investment Model — New Builds Need an ADR of About ¥16,100; Repositioning Reaches the 10% Range at Current Rates
Based on the measured figures so far, we ran a simple model for three types. The assumptions are as follows. Construction cost is based on the 2025 steel-frame hotel unit cost of ¥2.405 million per tsubo (3.3㎡) from MLIT’s Building Construction Starts statistics, with a 5% annual increase factored in up to the midpoint between groundbreaking and opening (2 years). GOP margin is anchored to the 38.9% domestic hotel actual disclosed by Invincible Investment Corporation (fiscal period ended December 2024), and assumed at 45% for a lodging-focused new build without F&B, 40% for repositioning and 25% for a small ryokan. Occupancy is an assumed actual-occupancy figure, set at 75% (55% for ryokan, given seasonality), lower than the OTA-listed-inventory-based estimates above. Acquisition costs and renovation costs are assumptions.
| Item | A. New build near the station (lodging-focused) | B. Repositioning in the city center Easier to pursue | C. Upgrading a small ryokan in Zao |
|---|---|---|---|
| Rooms | 120 rooms (18㎡; gross floor area approx. 3,320㎡) | 100 rooms | 25 rooms |
| Total investment | ¥2.73 billion (construction ¥2.42bn, land ¥0.13bn, pre-opening ¥0.18bn) | ¥1.00 billion (acquisition ¥7M/room + renovation ¥3M/room) | ¥375 million (acquisition and renovation ¥15M/room) |
| Same, after construction cost increase | ¥2.98 billion (approx. ¥24.8M per room) | — | — |
| Assumed ADR (tax excluded) | ¥13,000 | ¥10,000 (raised from the current ¥7,500 band) | ¥28,000 (annual average) |
| Assumed occupancy | 75% | 75% | 55% |
| Annual room revenue | ¥427 million | ¥274 million | ¥141 million |
| GOP (GOP margin) | ¥192 million (45%) | ¥109 million (40%) | ¥35 million (25%) |
| GOP yield | 7.0% | 10.9% | 9.4% |
| Same, after construction cost increase | 6.5% | — | — |
| ADR required for an 8% yield | About ¥16,100 (after construction cost increase; about ¥14,800 before) | About ¥7,300 | About ¥23,900 |
For A, the station-front new build, even capturing ¥13,000 — on par with today’s upper-tier station-front hotels — yields only 6.5–7.0%. Reaching 8% requires an ADR of about ¥16,100 on the ¥2.98 billion total investment that includes the construction cost increase (about ¥14,800 on the ¥2.73 billion basis before it). That level is roughly 10% above the city center’s current ceiling (¥14,400) and lands squarely in Gap 1. Put differently, the conditions under which a new build works and the city center’s empty band point to the same place, and the key to feasibility is a product design that extends the 1.30x Saturday premium to weekdays (larger rooms, bathing facilities, food experiences and the like). Rising construction costs raise the barrier to new entry, but for existing properties they also mean competition grows more slowly.
For B, repositioning, assuming total investment can be held to ¥10 million per room, the yield comes to 10.9%, and the ADR required for the 8% line is about ¥7,300 — roughly the current median for city-center business hotels. Moving into the ¥10,000s through renovation would mean entering the thinly supplied ¥10,000–15,000 band (currently 4 properties with 665 rooms in the city center). For C, the small ryokan in Zao, the result is 9.4% at an annual average of ¥28,000 and 55% occupancy; success depends on how far high winter rates can be extended into spring through autumn.
| Item | Base case | ADR −10% | Occupancy −5pt | Both |
|---|---|---|---|---|
| Annual room revenue | ¥274 million | ¥246 million | ¥256 million | ¥230 million |
| GOP | ¥109 million | ¥99 million | ¥102 million | ¥92 million |
| GOP yield | 10.9% | 9.9% | 10.2% | 9.2% |
For Scenario A, the new build, we also check yields when ADR and occupancy move together. Table 7 lays out GOP yield on two axes, assuming the ¥2.98 billion total investment that includes the construction cost increase. At 75% year-round occupancy, ¥14,400 — the city center’s current ceiling — yields 7.2%, and 8% is reached from ¥16,100. If occupancy can be raised to 80%, the required rate falls to about ¥15,100, and at 85% to about ¥14,200, within the current ceiling (¥14,400). Whether weekday occupancy can be lifted, not just the rate, determines whether a new build succeeds.
| Assumed ADR (tax excluded) \ Assumed year-round actual occupancy | 65% | 70% | 75% | 80% | 85% |
|---|---|---|---|---|---|
| ¥12,000 | 5.2% | 5.6% | 6.0% | 6.4% | 6.8% |
| ¥13,000 | 5.6% | 6.0% | 6.5% | 6.9% | 7.3% |
| ¥14,400 (current city-center ceiling) | 6.2% | 6.7% | 7.2% | 7.6% | 8.1% |
| ¥16,100 (required ADR from Table 5) | 6.9% | 7.5% | 8.0% | 8.5% | 9.1% |
| ¥18,000 | 7.8% | 8.3% | 8.9% | 9.5% | 10.1% |
Investment Summary — Opportunity in “Lifting into the ¥10,000s” in the City Center and “Going Year-Round” in Zao
Putting it all together, investment room in Yamagata City converges in two directions. The first is the city center, where the price-band structure itself — most rooms clustered below ¥10,000 and nothing at ¥15,000+ — is the opportunity. Capturing the empty band directly with a new build presupposes an ADR of around ¥16,000, so repositioning that lifts existing properties into the ¥10,000s fits current rate levels more readily. The second is Zao Onsen: bringing rates that climb to 2.5x in winter closer to a year-round level by combining them with spring-to-autumn draws (hot springs, trekking, sightseeing at the Okama crater lake).
Opportunity 1: Thicken the city center’s ¥10,000s
The ¥10,000–15,000 band has 4 properties with 665 rooms. Repositioning needs an ADR of only about ¥7,300 — on par with the current median — so any upside flows straight into yield.
Opportunity 2: Extend Saturday rates to weekdays
In the city center, Saturday is 1.30x weekdays. Designing multi-night and experience-based products that carry weekend rates into weekdays is an effective approach.
Opportunity 3: Make Zao’s high rates year-round
Only 2 properties with 46 rooms exceed ¥30,000 year-round. As a 49-room entry thickens this band, it can also be a good moment for nearby properties to revisit their rate design.
| Category | Detail | Indicators to watch |
|---|---|---|
| Market | Winter demand is driving rate growth, so annual levels move with snowfall and the number of ski-area operating days | Estimated settled ADR and properties covered for December–March |
| Supply | 153 rooms are added in 2026; the count may rise with future listings | Price bands and occupancy ramp-up of newly listed properties |
| Construction | Construction costs are expected to rise around 5% a year, pushing up the required ADR for new builds | Unit costs per tsubo in Building Construction Starts statistics; construction periods |
| Demand | The city center is highly concentrated on weekends and holidays | Listed-price index by day of week and occupancy (estimated) |
Summary
Yamagata City’s hotel market has a two-pole structure: of its 76 properties and 4,035 rooms, 68% of rooms are in the city center while 57% of properties are in Zao Onsen, and its estimated settled ADR of ¥12,300 is 1.27x the prefecture as a whole. By price band, 57% of rooms are below ¥10,000, the city center has no properties at ¥15,000+, and inns above ¥30,000 year-round are limited to 2 properties with 46 rooms in Zao. Rates move with the season in Zao and with the day of week in the city center, so even within one city, the way revenue is built differs greatly.
New listings of 4 properties with 153 rooms were confirmed in 2026, and the addition of 49 rooms to Zao’s high-rate band in particular is likely to be a milestone for the market. For investors, the two gaps — the city center’s ¥10,000s and Zao’s year-round high-rate band — and for operators, how far the rates achieved on Saturdays and in winter can be extended, look set to be the next topics to examine.
⚠ Note on ADR for future dates: Figures shown in this article for October 2026 onward are estimates based on listing levels published on major booking sites at the time of research (October 5, 2026) and will change as check-in dates approach. Please note that prices currently set high may fall with last-minute adjustments.
Related Articles
| ・Yamagata ADR Splits by Segment: Business −4.8% in April, City +12.5% |
| ・Yamagata Business Hotels: 3 Absorption Types, 7.2% vs 19.9% Left |
References and Sources
■ Data sources
Lodging property data compiled by MetroEngines Research & Consulting from public information on major booking sites (tallied October 5, 2026). Coverage: 76 properties with 4,035 rooms in Yamagata City confirmed on sale in July–September 2026. Estimated settled ADR uses monthly values for October 2024–September 2026 (Yamagata City averaging 58.6 properties per month, Yamagata Prefecture 288.9), and the price-band classification uses the 57 properties / 3,768 rooms with values for at least 6 of the latest 12 months. Land prices are from MLIT’s official land price publication (2026); construction costs from the same ministry’s Building Construction Starts statistics.
■ Model assumptions
The three-scenario model covers room revenue only, with GOP yield = assumed GOP ÷ total investment. The new build assumes 120 rooms, gross floor area of about 3,320㎡, total investment of ¥2.98 billion based on a 2025 steel-frame hotel unit cost of ¥2.405 million per tsubo with a 5% annual increase over 2 years, a 45% GOP margin and 75% assumed year-round actual occupancy. Repositioning assumes ¥10 million per room (acquisition ¥7 million + renovation ¥3 million) and a 40% GOP margin; the small Zao ryokan assumes ¥15 million per room, a 25% GOP margin and 55% assumed year-round actual occupancy. Acquisition costs, renovation costs and GOP margins are assumptions.
■ Limitations and caveats
Estimated settled ADR and occupancy (estimated) are estimates based on published prices and sales inventory on major booking sites and differ from each property’s actual settled prices, actual occupancy and accounting figures. Properties without listings and the 19 properties / 267 rooms in non-covered segments are excluded from the price-band classification. Because area ADR is the median of covered properties, its level shifts when the mix of covered properties changes by season. Values for October 2026 onward are estimates based on listing levels at the time of research and will change. The model is a simplified one that excludes depreciation, interest, taxes and FF&E reserves; investment decisions require detailed verification of each individual property.
■ Market data
| ・MetroEngines Research & Consulting — estimated settled ADR and listed prices (Yamagata City N=76 properties; Yamagata Prefecture averaging 288.9 properties per month), occupancy (estimated from OTA listed inventory), new openings (based on confirmed listings on major booking sites). Tallied October 5, 2026 |
■ Government statistics and public data
| ・MLIT Real Estate Information Library — Official Land Price Publication (2026) |
| ・Tochidai Data, “Official and Standard Land Prices in Yamagata City” (compiled from MLIT official land prices; in Japanese) |
| ・MLIT “Building Construction Starts” statistics (statistics ID: 0003114490) |
■ REIT and industry reports
| ・Invincible Investment Corporation (8963) financial results presentation (fiscal period ended December 2024) — domestic hotel GOP actuals |
■ News and press releases
| ・Hoshino Resorts, “KAI Zao (界 蔵王) to Open on October 15, 2026” (PR TIMES, April 22, 2026; in Japanese) |
| ・HotelBank, “Greens and Yamagata City Sign Agreement on Providing Lodging Facilities During Disasters” (in Japanese) |
| ・HotelBank, “Ninth Ofuro Cafe Location to Open in Yamagata City” (in Japanese) |