

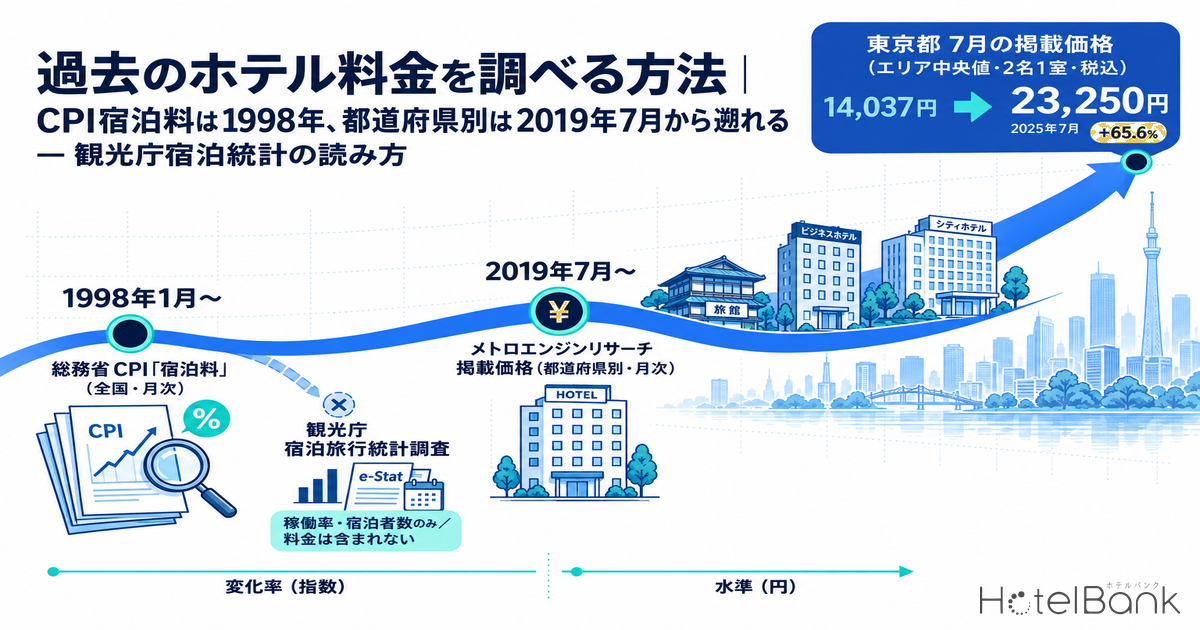
How you look up past hotel prices depends on what you want to know. If the question is how much national accommodation prices have risen over the long run, the Ministry of Internal Affairs and Communications (MIC) Consumer Price Index (CPI) item “accommodation charges” (宿泊料) can be traced monthly back to January 1970. If instead you want to know how many yen a room cost in a given prefecture, there is no matching public series: the Japan Tourism Agency’s Overnight Travel Statistics Survey measures occupancy and guest numbers, and room rates are not among its survey items. This article sets out two public statistics alongside MetroEngines Research’s monthly data (available back to July 2019) and explains what can be traced, how far back, and where. We also devote a chapter to reading the frequently searched Japan Tourism Agency lodging statistics.
Metric Definitions Used in This Article
- Listed price (area median): Selling prices published on OTAs and similar channels, averaged daily per property, with the median taken across the prefecture for each month. Per-room rate for two guests sharing one room (tax included), covering all plans (room-only through meal-inclusive), on a listed-price basis — not the price actually transacted. It is a different metric from the estimated settled ADR (tax-excluded equivalent) used in our area analysis articles, and the two are never mixed in this article.
- CPI “accommodation charges”: An item index (2020 = 100) in MIC’s Consumer Price Index. It shows the rate of price change relative to the base year, not a yen amount.
- Room occupancy rate (Japan Tourism Agency): In the Overnight Travel Statistics Survey, rooms occupied divided by total rooms.
- Data sources: MetroEngines Research (listed prices), MIC, Japan Tourism Agency
- — Rates of change can be tracked monthly from January 1970 with MIC’s CPI “accommodation charges” (2020 = 100; 2025 average 164.6). It is an index, not a yen level.
- — The Japan Tourism Agency’s Overnight Travel Statistics Survey does not include prices. Occupancy and guest numbers can be traced by prefecture and property type from January 2007; use final figures when citing past data.
- — Prefecture-level yen price levels go back to July 2019. Tokyo’s listed price (area median, two guests per room, tax included) rose from about ¥14,000 in July 2019 to about ¥23,300 in July 2025, up 65.6% — outpacing the CPI over the same period (+41.8%).
Bottom Line: A Quick Reference for Looking Up Past Hotel Prices
Here is the conclusion up front. The rate of price change and the price level (in yen) have to be looked up in different sources. The former can be traced in public statistics for more than half a century; for the latter, we could find no public statistic that goes back monthly at the prefecture level. The table below is arranged so you can work backwards from what you want to find out.
| What you want to know | Source | How far back | Granularity | How prices are treated |
|---|---|---|---|---|
| Long-term rise in accommodation prices | MIC Consumer Price Index, “accommodation charges” | Jan 1970 onward (2020 base, monthly) | National, monthly | Index (2020 = 100); not yen |
| Trends in occupancy and guest numbers | Japan Tourism Agency, Overnight Travel Statistics Survey | Jan 2007 onward | Prefecture × property type × month | Prices not included |
| Price levels by prefecture (yen) | MetroEngines Research (HotelBank area articles) | Jul 2019 onward (monthly) | Prefecture, municipality, property type | Yen; two guests per room, tax included, listed-price basis |
| Settled rates achieved by a specific set of properties | Monthly operating results of listed hotel REITs | From the start of each REIT’s disclosure | Property / portfolio | Settled ADR (mostly excluding consumption tax) |
Source: Compiled by the HotelBank Editorial Team from MIC, Japan Tourism Agency and MetroEngines Research data
There are three points to take away. First, opening the Japan Tourism Agency’s statistics will not give you prices. Second, the CPI shows how many percent prices moved, not how many yen they are. Third, if you want to compare yen levels by area, private-sector price data is the only option — and in that case you must always check the basis: listed price or settled price, tax included or excluded, one guest or two. Each is covered in turn below.
Public Statistic 1: Trace Long-Term Accommodation Prices With MIC’s CPI “Accommodation Charges”
The longest free record of how national accommodation prices have moved is MIC’s Consumer Price Index (e-Stat). The item “accommodation charges” is published monthly from January 1970 in the 2020-base series and can be downloaded from e-Stat as tables or CSV. On an annual-average basis, it eased from 107.5 in 2007 to 100.6 in 2011, then climbed to 120.1 in 2019 as inbound visitors increased. 2020 is the base year and therefore 100, and 2025 reached 164.6.
Source: Compiled by the HotelBank Editorial Team from MIC “Consumer Price Index” (2020 base; item: accommodation charges; national, annual average)
There are two caveats in reading it. First, the CPI tracks the price of the same property under the same conditions over time, so newly added rooms of a different quality do not feed directly into the index. In other words, it is closer to “how much the same thing has gone up” than to “the market’s average rate”. Second, discounts from government tourism stimulus programmes — Go To Travel in July–December 2020 and the National Travel Support programme from autumn 2022 into 2023 — are reflected in the index as price cuts (the 2021 prefectural resident discounts were outside the CPI’s scope). The index reads lower than market reality in those periods, so check year-on-year changes against the timing of those programmes.
The latest reading, August 2026, is 181.1, almost unchanged from the same month a year earlier (181.4). Summer-holiday months run high every year, so the basic rule is to compare with the same month of the previous year rather than with months from a different season.
Note that MIC switched the official CPI series to a 2025 base from the July 2026 figures. The index values in this article come from the 2020-base series, which e-Stat continues to update. Because year-on-year figures can change when the base year changes, state which base a figure uses when citing it. The effect of the rebasing on the year-on-year change in accommodation charges is analysed in Japan Lodging CPI Rebased to 2025: YoY Cut by up to 1.6pt.
Public Statistic 2: Reading the Japan Tourism Agency’s Overnight Travel Statistics Survey — Prices Not Included
Search for “Japan Tourism Agency lodging statistics” and the first thing you reach is the Overnight Travel Statistics Survey (宿泊旅行統計調査). Conducted monthly since January 2007, it is the government’s core accommodation statistic and is published on e-Stat under government statistics code 00601020. The first thing to grasp is that the survey covers volume indicators — total guest nights, actual guests, foreign guest nights (by nationality), room occupancy and capacity occupancy — and that accommodation prices and room rates are not survey items. It is ideal for tracing occupancy by prefecture and property type (ryokan, resort hotels, business hotels, city hotels, simple lodging and so on) back through time, but readers who come looking for prices hit a dead end here.
Another important point is that figures for the same month are published in three stages — first preliminary, second preliminary and final — and values are revised at each stage.
| Release stage | Release timing (approx.) | When to use it |
|---|---|---|
| First preliminary | Around the end of the following month (e.g. July 2026 figures released at end-August) | When you want an early read on the latest trend. Main national and prefectural indicators only |
| Second preliminary | Around the end of the month after next (e.g. June 2026 figures already released as of end-August) | Detailed tables such as by property type, plus the press release, become available |
| Final | Released the following year for January–December together | For year-on-year comparisons in reports and investment materials. Use these when citing past data |
Source: Compiled by the HotelBank Editorial Team from the Japan Tourism Agency’s Overnight Travel Statistics Survey release page (updated August 31, 2026)
When citing past figures in a report, the safe rule is to use final figures. The difference from preliminary figures is small but not zero, and HotelBank has measured the size of the revisions from the first preliminary release to the final figures.
When making long-term comparisons, also watch for changes in the survey design. According to the Japan Tourism Agency, small properties with nine or fewer employees were added to the survey from the April–June 2010 survey, and comparisons spanning that point require care. In addition, from the January 2026 figures the criterion used to stratify properties changed from number of employees to number of rooms. When setting figures from more than ten years ago beside recent ones, check which survey design they were compiled under.
Our Own Data: Prefecture-Level Price Levels Go Back Monthly to July 2019
MetroEngines Research’s price data fills the “by area, in yen” gap the public statistics leave. Of the properties MetroEngines Research tracks, it aggregates daily selling prices for roughly 27,000 properties confirmed to be operating, and monthly figures by prefecture go back to July 2019. For example, Tokyo’s listed price in July 2019 (area median, two guests per room, tax included, listed-price basis) was about ¥14,000, across N=1,468 properties.
The chart below overlays Tokyo’s listed price year by year. It hovered around ¥14,000 in the second half of 2019 and in the ¥11,000–12,000 range in the first half of 2022, turned upward from autumn 2022, and in 2025 reached about ¥29,300 in November. Comparing the same month, July 2025 was about ¥23,300, up 65.6% from July 2019.
Source: MetroEngines Research; compiled by the HotelBank Editorial Team (Tokyo, area median listed price, two guests per room, tax included; N=1,468–1,711 properties per month)
Over the same period the CPI for accommodation charges (national) rose from 116.9 in July 2019 to 165.8 in July 2025, up 41.8%, so Tokyo’s listed price grew faster. The gap likely arises because the CPI tracks price changes under identical conditions, whereas the listed price also reflects the mix of rooms on sale at the time (new high-end openings, the share of upper-category rooms sold, and so on). When explaining how much prices have risen, stating which definition a figure uses prevents readers from misunderstanding it.
July Listed Prices in Six Major Prefectures — 2019, 2022 and 2025
Price rises differ widely by area. For six major prefectures, we set out listed prices for July 2019 (before COVID-19), July 2022 (before the demand recovery) and July 2025 (the latest full year). The largest rise versus 2019 was Fukuoka at +76.8%, followed by Osaka at +73.0%. Note that July 2025 in Osaka fell during Expo 2025 Osaka, Kansai, so conditions differ from a typical year. Kyoto was already above ¥20,000 in 2019, so its rise of +47.0% was the smallest of the six, but its level of about ¥29,600 is the highest.
| Prefecture | Jul 2019 | Jul 2022 | Jul 2025 | vs 2019 |
|---|---|---|---|---|
| Tokyo | ¥14,037 N=1,468 | ¥12,658 N=1,697 | ¥23,250 N=1,681 | +65.6% |
| Osaka | ¥11,702 N=956 | ¥11,069 N=891 | ¥20,247 N=932 | +73.0% |
| Kyoto | ¥20,107 N=1,826 | ¥22,454 N=2,001 | ¥29,555 N=1,657 | +47.0% |
| Hokkaido | ¥18,260 N=1,210 | ¥19,463 N=1,702 | ¥27,412 N=1,698 | +50.1% |
| Okinawa | ¥17,388 N=1,340 | ¥20,456 N=1,895 | ¥27,001 N=1,795 | +55.3% |
| Fukuoka | ¥12,509 N=566 | ¥11,898 N=698 | ¥22,112 N=727 | +76.8% |
Source: MetroEngines Research; compiled by the HotelBank Editorial Team (area median listed price, two guests per room, tax included; N = number of properties aggregated)
Source: MetroEngines Research; compiled by the HotelBank Editorial Team (July area median listed price, two guests per room, tax included)
When using past price levels in materials, the rule is to compare the same month with the same month. In Tokyo, July and November 2025 differ by more than ¥6,000, so comparing across years without aligning the month risks mistaking seasonal differences for price changes. The number of properties aggregated also changes from year to year. Coverage widened from April 2026 onward — in Tokyo, N rose from 1,723 (March) to 2,402 (June) — so when comparing a 2026 month with the past, use a year-on-year comparison compiled under identical conditions, such as the estimated settled ADR in our area analysis articles.
Where to Check the Latest Levels by Area
HotelBank regularly publishes articles analysing the estimated settled ADR (tax-excluded equivalent) for finalised months by prefecture and property type. Estimated settled ADR is a different metric from the listed price used in this article, calibrated against the actual results disclosed by listed hotel REITs. For past levels and year-on-year changes by area, those area analysis articles are the place to start.
Where property-level settled results are needed, the monthly operating results of listed hotel REITs are another strong source. Each REIT discloses occupancy, ADR and RevPAR for its portfolio every month, and these can be treated as settled-basis actuals (most exclude consumption tax, but check each REIT’s notes for the tax basis). They are limited to each REIT’s own properties, however, and do not represent the level of the area as a whole.
Checklist for Using Past Price Data
Finally, here are the items to check when citing past prices in a report or investment material. Each is a check to make sure you are aligning what the figures measure, rather than the figures themselves.
| Item | What to check |
|---|---|
| Type of price | Listed price (asking price) or settled price (price actually sold)? Listed prices generally come out higher than settled prices |
| Tax treatment | Tax included or excluded? Most REIT-disclosed ADRs exclude consumption tax, leaving a definitional gap of about 10% against tax-inclusive prices |
| Guests / unit | Per-person rate, or per-room rate for two guests sharing? Mixing them creates a gap of nearly double |
| Summary statistic | Mean or median? In areas with many high-end properties the mean swings well above the median |
| Month compared | Is the comparison aligned year-on-year by month? Cross-month comparisons include seasonal differences |
| Population | How did the number of properties aggregated (N) change over the period? |
Source: Compiled by the HotelBank Editorial Team
Summary
When looking up past hotel prices, start by deciding whether you want the rate of change or the level (in yen). For the rate of change, MIC’s CPI “accommodation charges” tracks national movements from January 1970. The Japan Tourism Agency’s Overnight Travel Statistics Survey goes back to 2007 for occupancy and guest numbers but does not include prices. Prefecture-level yen levels can be traced monthly from July 2019 with MetroEngines Research’s listed prices; in Tokyo they moved from about ¥14,000 in July 2019 (N=1,468 properties) to about ¥23,300 in July 2025 (N=1,681 properties). Whichever source you use, stating the basis for price type, tax and number of guests, and comparing on a same-month year-on-year basis, is the shortest route to more persuasive materials.
* All figures in this article are for past months finalised at the time of research; listed prices for future months are not included.
Frequently Asked Questions
Q. Can I find average hotel prices in the Japan Tourism Agency’s statistics?
A. No. The Overnight Travel Statistics Survey centres on guest numbers and occupancy and does not include prices. To see price changes in public statistics, use MIC’s CPI “accommodation charges”.
Q. How far back can I look up hotel prices?
A. National rates of change can be checked monthly from January 1970 with the CPI “accommodation charges”. Prefecture-level yen levels go back to July 2019 with MetroEngines Research’s listed prices.
Q. Should I use preliminary or final figures from the Overnight Travel Statistics Survey?
A. Final figures are the default when citing past data. Preliminary figures come out sooner but may be revised at a later stage.
Related Articles
Further Reading
References and Sources
- Japan Tourism Agency, Overnight Travel Statistics Survey release page (updated August 31, 2026; in Japanese)
- e-Stat, Overnight Travel Statistics Survey (government statistics code 00601020)
- e-Stat, MIC Consumer Price Index (government statistics code 00200573) — 2020 base, item “accommodation charges” (statistical table ID 0003427113)
- MIC Statistics Bureau, Consumer Price Index — moved to a 2025 base from the July 2026 figures (index values in this article are from the 2020-base series)
- MetroEngines Research — listed prices by prefecture (area median, two guests per room, tax included, July 2019–July 2025)