

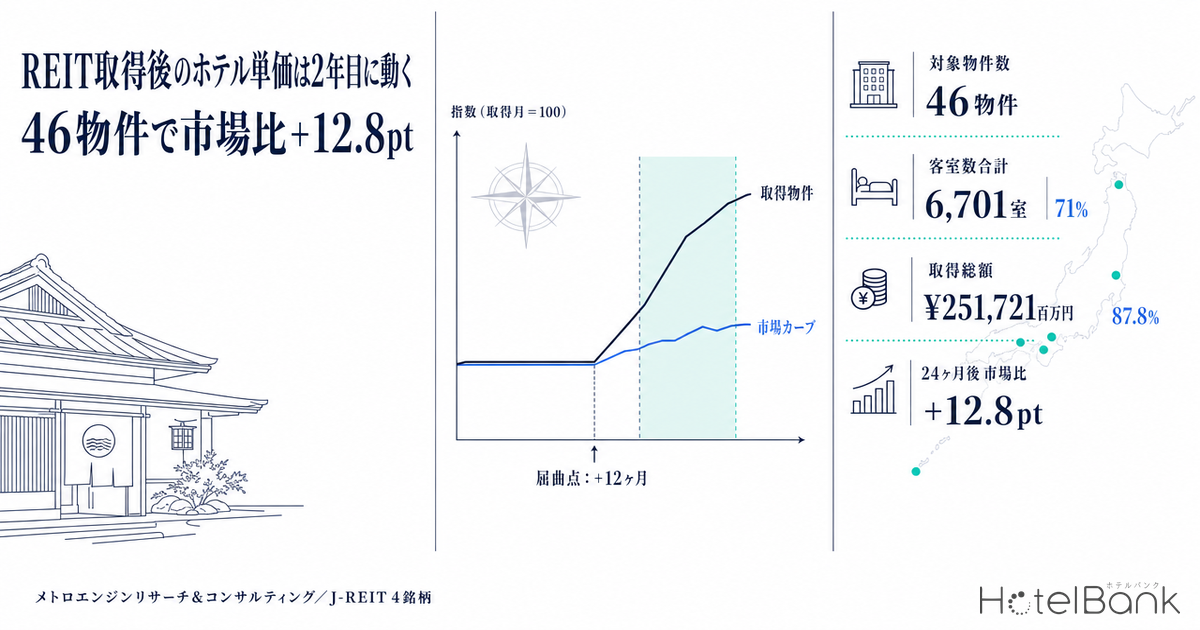
When a hotel changes hands, what happens to its room rate from that day on? We took the 46 domestic hotels (6,701 rooms in total, aggregate acquisition price ¥251,721 million) that J-REITs have acquired since January 2023, aligned each one on its acquisition month as “relative month 0”, and tracked estimated settled ADR for 24 months either side. The short answer: for the first eight months after acquisition, the acquired hotels move almost exactly in step with the market for the same prefecture and the same hotel type. The gap only starts to open in month 12, and by month 24 the acquired hotels are ahead of their market by a median +12.8pt. Repricing does not happen at the moment of acquisition; it happens in year two.
First, a note on where this study sits. Earlier HotelBank articles looked at price at the point of acquisition, i.e. how much was paid per room, or at appraisal value, which is an accounting figure. This article looks at operating results after acquisition, measured as the rate the hotel actually sells at in the market. It also differs in direction from earlier work that cross-checked disclosed ADR against estimated market ADR at a single point in time: here we follow the same assets through time. And it differs in its starting point from earlier work that measured ADR lift from a brand conversion: the starting point here is the change of ownership itself, and the sample includes many cases with no rebrand.
Metric Definitions Used in This Article
- ADR (Average Daily Rate): an estimated settled rate (tax-exclusive equivalent), calculated by applying a hotel-type-specific adjustment factor to the lowest-priced plan each property publishes on OTAs (per room, 2 guests, tax-inclusive). Checked against property-level results disclosed by listed hotel REITs (91 properties, most recent 3 months), the median error is about 7%. These are estimates and differ from each property’s actual settled prices and accounting figures. Area-level ADR is the median of the properties in scope (the level of a typical property in the area).
- Relative month: months before or after the acquisition month, which is set to 0. -12 means 12 months before acquisition; +24 means 24 months after.
- Index: each property’s 12-month moving-average ADR, rebased so that its 12-month moving average at the acquisition month (relative month 0) = 100. The moving average is used to remove seasonality.
- Market curve: the area ADR for the same prefecture and same hotel type as each property, indexed the same way. Every property has its own comparison set.
- Gap (pt): property index minus market index. The gap is calculated property by property, and the median is then taken.
- Occupancy (OCC): rooms sold as a share of total rooms in the area (an estimate based on OTA sales inventory).
- — For the first eight months after acquisition, the gap in estimated settled ADR between acquired hotels and their market stays within +3pt. Rates do not move the moment ownership changes.
- — The gap starts to open at relative months +11 to +12. At month 24, acquired hotels are ahead of their market by a median +12.8pt (fixed panel, N=24 properties).
- — In the months 13-24 window, the gap is a median +15.0pt, with 71% of properties positive. But the interquartile range runs from -7.1pt to +32.2pt, a spread of about 39pt.
- — By hotel type: onsen ryokan & resort +17.2pt, limited-service +12.9pt, full-service +1.8pt. The less the market itself moves, the bigger the gap.
- — Estimated occupancy for April-August 2026 was a median 87.8% (N=23 properties). The rate gains were not bought by selling fewer rooms.
Building the Sample: 46 Properties from 4 REITs, with 3 REITs Excluded Because of How Their Acquisition Dates Are Recorded
The starting point is our REIT ownership master. Of the seven domestic hotel REITs, only four record property-level acquisition dates that actually work as acquisition timing. Japan Hotel REIT’s property-level acquisition dates go back as far as 1975, and Mori Trust REIT’s are spread from 1989 onward. These look closer to construction or opening dates than to acquisition dates, so they cannot serve as the starting point for an event study. For Kasumigaseki Hotel REIT, we found a column misalignment in which acquisition prices appeared in the room-count field, so it was also excluded from the sample.
From the remaining four REITs, we extracted properties acquired in January 2023 or later that could be matched one-to-one to a property in our own hotel master. That gives 46 properties, broken down as follows.
| REIT | Properties | Rooms | Total acquisition price | Per room |
|---|---|---|---|---|
| Invincible Investment Corporation (インヴィンシブル投資法人) | 28 | 4,149 | ¥195,934 million | ¥47.2 million |
| Ichigo Hotel REIT Investment Corporation (いちごホテルリート投資法人) | 9 | 1,372 | ¥29,880 million | ¥21.8 million |
| Nippon Hotel & Residential Investment Corporation (日本ホテル&レジデンシャル投資法人) | 6 | 878 | ¥17,943 million | ¥20.4 million |
| Hoshino Resorts REIT (星野リゾート・リート投資法人) | 3 | 302 | ¥7,964 million | ¥26.4 million |
| Total | 46 | 6,701 | ¥251,721 million | ¥37.6 million |
In practice the acquisitions fall into four broad clusters. Invincible Investment Corporation bought 12 domestic hotels in one go in July 2024 and another 10 in August 2025; those two transactions alone account for 22 of the 46 properties. Ichigo Hotel REIT bought 5 properties as a bundle in August 2023 and then added 4 more individually in 2025. Nippon Hotel & Residential’s acquisitions were timed with its public offerings in December 2024 and December 2025. In other words, this sample is not a collection of scattered one-off deals; it is a set of a few portfolio acquisition events.
By hotel type, acquisition price levels split clearly.
| Hotel type | Properties | Rooms | Total acquisition price | Per room |
|---|---|---|---|---|
| Limited-service | 21 | 3,156 | ¥71,973 million | ¥22.8 million |
| Onsen ryokan & resort | 15 | 1,492 | ¥94,049 million | ¥63.0 million |
| Full-service | 9 | 2,001 | ¥85,253 million | ¥42.6 million |
| Other | 1 | 52 | ¥446 million | ¥8.6 million |
What the map shows is that these 46 properties are not concentrated in Japan’s three major metropolitan areas. Only 12 are located in the Tokyo, Osaka and Nagoya metro areas; the other 34 are spread across regional Japan. The list includes prefectures such as Aomori, Akita, Ibaraki, Gunma, Toyama, Kochi, Miyazaki, Kagoshima and Okinawa, where REIT investment has historically been thin. As a sample for tracking acquisition events, this is closer to reality than looking only at prime central-city assets.
Design: Without a Market Curve, the Inbound Recovery Would Be Misread as an Acquisition Effect
Hotel room rates in Japan rose from 2023 through 2026 regardless of what is in any particular sample. So the observation that “ADR rose after acquisition” tells us nothing on its own. What we need is a control group: how, on average, did properties in the same market over the same period move?
For each property, we took the area ADR for the same prefecture and the same hotel type and indexed it to the same relative months and the same base month as the property. For example, for a city hotel in Aomori acquired in July 2024, the Aomori city-hotel area ADR is set to July 2024 = 100. We then subtract the market index from the property index for each property and take the median for each relative month. This gap is what remains after stripping out the market-wide tailwind.
The other design decision is to fix the sample. The more recently a property was acquired, the shorter the period we can observe it, so if the set of properties changed as relative months progressed, the shape of the curve would reflect “who is in the sample” rather than any effect. The main charts therefore use a fixed panel of the 24 properties that can be observed for at least 24 months after acquisition (acquired in June 2023, August 2023 and July 2024). From relative month -12 through +24, the aggregation always covers the same 24 properties (4,130 rooms in total).
Results: Perfectly Parallel to the Market Before Acquisition, and Within +3pt for 8 Months After
The first thing to check is the pre-acquisition period. From relative month -12 to -1, the acquired properties’ index and the market index almost overlap. The gap stays between -2.4pt and -0.1pt, and in the three months immediately before acquisition it is -0.4pt, -0.3pt and -0.1pt, essentially zero. Before they were bought, these properties moved in parallel with the market. That satisfies a key precondition of an event study. Put the other way, the REITs were not buying “properties that were already beating the market”.
After acquisition, change does not appear right away. The gap is +0.3pt at relative month +1, +0.3pt at +3, +2.6pt at +6 and +2.7pt at +8. Eight months after acquisition, it is still within 3pt. Over this period the acquired properties’ index moves from 100.0 to 106.5 and the market’s from 100.0 to 108.6; in some months the market is actually moving faster.
The inflection point is at relative months +11 to +12: +4.8pt at +11, +7.0pt at +12, +8.4pt at +13 and +12.1pt at +16. From there to +24 the gap holds in an 11-13pt band. The market curve itself is almost flat from relative month +12 onward (111.4 to 110.8), so what creates the gap in this period is not the market but the rise in the acquired properties (112.5 to 120.2).
This shape suggests that even if a change of ownership does affect rates, it works not through an immediate price change, but only after a full annual pricing-design cycle has run. For roughly the first six months after acquisition, the existing sales plan, existing contracts and existing rate plans simply carry on. One reading is that it takes about a year for the new owner’s policy to be built into the next year’s rate design and for the result to show up as actual selling prices.
Summary by Window: No Gap at 6 Months, a Median +15.0pt in Months 13-24
Alongside the curves, here is a comparison of period averages. Each property’s average ADR in the 12 months before acquisition is the base, and the average ADR in each of three post-acquisition windows is compared against it. Because each window needs a different observation period, the number of properties (N) also differs.
| Window | N | Acquired property ADR change | Market ADR change | Gap median | Gap interquartile range (p25 to p75) | Share with positive gap |
|---|---|---|---|---|---|---|
| Months 1-6 after acquisition | 43 | +6.9% | +7.1% | -0.6pt | -7.4 to +12.9pt | 47% |
| Months 1-12 after acquisition | 29 | +16.0% | +12.7% | +5.6pt | -5.9 to +14.5pt | 66% |
| Months 13-24 after acquisition | 24 | +22.0% | +13.1% | +15.0pt | -7.1 to +32.2pt | 71% |
At six months after acquisition, the median gap is -0.6pt and 47% of properties are positive. That is no better than a coin toss. In the 12-month window the median is +5.6pt with 66% positive, and in the months 13-24 window it is +15.0pt with 71% positive: as the period lengthens, both the center and the distribution shift to the right.
The interquartile range, however, makes it clear that this does not happen uniformly across all properties. In the months 13-24 window the interquartile range runs from -7.1pt to +32.2pt, a spread of about 39pt. A median of +15.0pt and every property gaining +15pt are two completely different things. Roughly 30% of properties underperformed their market over the same period, and this dispersion is closer to the reality of how rates are formed after acquisition.
By Hotel Type: The Gap Shows Up in Onsen Ryokan & Resorts and Limited-Service; Full-Service Tracks the Market
Splitting the 24-property fixed panel by hotel type produces very different curves. The gap at relative month +24 is +17.2pt for onsen ryokan & resorts (N=6), +12.9pt for limited-service (N=9) and +1.8pt for full-service (N=9).
The reason the gap is so large for onsen ryokan & resorts lies on the market side. The market index for this type stops rising after relative month +13, and the market ADR change in the months 13-24 window was -0.2%, essentially flat. Over the same period the acquired properties moved +15.8%. Where the market as a whole is not moving, an individual property’s movement becomes the gap almost one-for-one. Regional onsen destinations have not had the same inbound tailwind as the big cities, so the operator’s own moves are relatively easy to see. Individual cases of buying a ryokan and then restructuring how it is run, such as Kasumigaseki Capital’s ryokan rebranding in Uji, are covered separately in our Japanese-language reporting.
For limited-service, the market itself rose +13.1%, but the acquired properties moved far more, +36.3%. Urban limited-service hotels are absorbing inbound demand and the whole market is growing, with an additional premium on top.
For full-service, +1.8pt is fairly described as “in line with the market”. This type’s market curve rose +14.9% in the months 13-24 window, the strongest of the three types, and the acquired properties kept pace with it. A further caveat is needed: full-service hotels earn revenue outside rooms, such as banquets and restaurants, so room rates alone do not capture their full operating performance.
| Hotel type | N | Acquired property ADR change | Market ADR change | Gap median |
|---|---|---|---|---|
| Limited-service | 9 | +36.3% | +13.1% | +16.6pt |
| Full-service | 9 | +9.4% | +14.9% | +1.9pt |
| Onsen ryokan & resort | 6 | +15.8% | -0.2% | +17.4pt |
By area, the 19 of the 34 regional properties that can be observed in the months 13-24 window had a median gap of +13.7pt, while the 5 properties in the three major metro areas came in at +24.8pt. The metro-area group is thin at N=5; all five were positive, but the sample is too small to generalize this level. It should be read only as an observation of N=5.
Checking Occupancy: The Rate Gains Were Not Bought by Giving Up Occupancy
The obvious question about any rate increase is whether occupancy was sacrificed for it. Our estimated occupancy data only goes back to April 2026, so it cannot be used for a before-and-after time series around acquisition, but it does provide a recent snapshot.
For the 23 of the 24 fixed-panel properties for which occupancy was available, estimated occupancy for April-August 2026 was a median 87.8% (simple mean 86.0%, minimum 63.8%, maximum 95.5%). Two years after acquisition, these properties are selling more than 80% of their rooms. If the rate gains had come at the cost of lower sales volume, occupancy would not be at this level. Rate and occupancy appear to be holding up together.
Note: Estimated occupancy is based on how much of the inventory sold on OTAs has been taken up, and differs from a property’s actual overall occupancy. Aggregated over the five months April-August 2026, N=23 properties.
Interpretive Guardrails: The Change of Owner Alone Cannot Be Said to Have Moved the Rate
Summarizing these results as “ADR goes up when a REIT buys” would go too far. Several factors can move at the same time as, or after, the acquisition.
Renovation and capital investment
If a major repair or guestroom renovation follows the acquisition, the rate increase is quite likely the result of that investment. A gap that starts to open around relative month +12 is also consistent with a renovation started right after acquisition and completed in about a year. The capital expenditure REITs actually disclose runs at roughly ¥130,000 to ¥620,000 per room per year.
Brand and operating structure
The sample includes many acquisitions with no rebrand, but some properties did change their name. The effect of brand conversion is mixed into the gap measured here and has not been separated out.
Uneven market recovery
The market curve is taken at prefecture-by-hotel-type granularity, but even within one prefecture, recovery speed differs between station-front and suburban locations. That coarseness remains in the gap as residual error.
There is one more important caveat specific to this sample. For a substantial share of the 46 properties, the operator did not change across the acquisition. The properties Invincible Investment Corporation acquired in July 2024 and August 2025 continue to be operated by the operating company that is the REIT’s main tenant. The business hotels acquired by Nippon Hotel & Residential also continue to operate under their existing brands.
These acquisitions, then, are not events in which the operator is replaced, but events in which only the asset owner changes, on the same operating platform. The fact that a gap versus the market still emerges in the second year after acquisition suggests that what drives repricing may not be only “who operates the hotel”, but also “the capital constraints that are released when the owner changes” or “the investment plan that gets rebuilt under the new owner”. Our data alone cannot settle this, and we leave it as a theme for further study.
We should also be explicit about the aggregation constraints. The 15 properties acquired in August 2025 or later have less than 12 months of observations and are excluded from the 12-month and 24-month windows. Aggregating the 12-month window for three properties acquired in 2025 gives a median gap of -5.4pt, but N=3 cannot be treated as a trend. The sample’s estimated settled ADR uses only monthly results that have been finalized (history basis); no estimates based on listed prices for future months are mixed in.
Properties That Beat the Market: The Top 12 by Gap
Of the 24 fixed-panel properties, 17 (71%) beat their same-prefecture, same-type market in the months 13-24 window. The 12 with the largest gaps are listed below. Figures are changes against the 12-month pre-acquisition average.
| Property | REIT | Acquired | Hotel type | Rooms | Property ADR change | Market ADR change | Gap |
|---|---|---|---|---|---|---|---|
| Art Hotel Nippori Lungwood (アートホテル日暮里 ラングウッド) | Invincible | Jul 2024 | Full-service | 128 | +79.5% | +25.0% | +54.5pt |
| Comfort Hotel Osaka Shinsaibashi (コンフォートホテル大阪心斎橋) | Ichigo Hotel REIT | Aug 2023 | Limited-service | 214 | +97.1% | +49.2% | +47.9pt |
| Quintessa Hotel Ogaki (クインテッサホテル大垣) | Ichigo Hotel REIT | Aug 2023 | Full-service | 98 | +44.1% | +3.1% | +41.0pt |
| Kamenoi Hotel Izu-Kogen (亀の井ホテル 伊豆高原) | Invincible | Jul 2024 | Onsen ryokan & resort | 55 | +34.9% | -3.0% | +37.9pt |
| THE KNOT SAPPORO | Ichigo Hotel REIT | Aug 2023 | Limited-service | 140 | +57.8% | +23.1% | +34.7pt |
| Quintessa Hotel Ise Shima (クインテッサホテル伊勢志摩) | Ichigo Hotel REIT | Aug 2023 | Full-service | 150 | +47.1% | +14.9% | +32.2pt |
| Hotel MyStays Aomori Station (ホテルマイステイズ青森駅前) | Invincible | Aug 2023 | Limited-service | 132 | +38.1% | +13.0% | +25.1pt |
| HOTEL THE KNOT YOKOHAMA | Ichigo Hotel REIT | Aug 2023 | Limited-service | 145 | +49.5% | +24.7% | +24.8pt |
| Kamenoi Hotel Nara (亀の井ホテル 奈良) | Invincible | Jul 2024 | Onsen ryokan & resort | 42 | +23.6% | +1.0% | +22.6pt |
| Tazawako Lake Resort (天然温泉 田沢湖レイクリゾート) | Invincible | Aug 2023 | Onsen ryokan & resort | 80 | +13.3% | -5.1% | +18.4pt |
| Hotel MyStays Okayama (ホテルマイステイズ岡山) | Invincible | Aug 2023 | Limited-service | 145 | +36.3% | +19.7% | +16.6pt |
| Kamenoi Hotel Hikone (亀の井ホテル 彦根) | Invincible | Jul 2024 | Onsen ryokan & resort | 41 | +15.0% | -1.4% | +16.4pt |
The top of the list is made up of two seemingly opposite groups: urban limited-service hotels and regional onsen ryokan. The limited-service hotels in Osaka, Sapporo and Yokohama added a premium on top of markets that were themselves moving +23% to +49%, while the onsen ryokan in Shiga, Nara and Shizuoka moved +15% to +35% in markets that were almost flat. The former is a premium earned on top of a tailwind; the latter is a solo rise where there was no tailwind. The same gap means something different in each case.
On the other hand, 7 of the 24 fixed-panel properties underperformed their market over the same period. They are concentrated in full-service, and many are large properties in regional core cities. Because these properties have revenue structures beyond room rates, and because larger properties are more exposed to sales restrictions during renovation, it is not appropriate to judge their operating performance on room ADR alone. The metric in this article is one cross-section of rate formation, not a measure of a property’s earning power as such.
Sensitivity Analysis: Gap Ranges by Holding Period and Quantile
So far we have talked in medians, but what underwriting needs is not the center but the range. The grid below rearranges the quantiles from the window summary on two axes: holding period (rows) and quantile (columns). All figures are gaps versus the market (pt), with each quantile taken from property-level gaps.
| Observation window | N | Downside (lower quartile, p25) | Base (median) | Upside (upper quartile, p75) | Range width | Share with positive gap |
|---|---|---|---|---|---|---|
| Months 1-6 after acquisition | 43 | -7.4pt | -0.6pt | +12.9pt | 20.3pt | 47% |
| Months 1-12 after acquisition | 29 | -5.9pt | +5.6pt | +14.5pt | 20.4pt | 66% |
| Months 13-24 after acquisition | 24 | -7.1pt | +15.0pt | +32.2pt | 39.3pt | 71% |
Reading the grid down the columns shows that time works on the median and the upper quartile. The lower quartile barely moves: -7.4pt, -5.9pt, -7.1pt. A longer holding period does not reduce how far the underperformers fall short. What grows is the median (-0.6 to +5.6 to +15.0pt) and the upper quartile (+12.9 to +14.5 to +32.2pt). What happens in year two is closer to “the upside tail getting longer” than to “everyone moving up”.
Reading across the rows shows how the range width changes. The 6-month and 12-month windows are both about 20pt wide, but the months 13-24 window is 39.3pt, almost double. Year two after acquisition is when expected value rises, and at the same time when dispersion between properties is at its widest. Putting the median +15.0pt into a business plan on its own throws that range away.
Translating This into Three Scenarios (Months 13-24 After Acquisition, N=24 Properties)
Downside: gap -7.1pt
The lower quartile, on the underperforming side. Of the 24 fixed-panel properties, 7 (29%) actually underperformed their market. They are concentrated in full-service, with many large properties in regional core cities. For properties with revenue sources beyond rooms, this gap does not equal weak operations.
Base: gap +15.0pt
The median case. Acquired-property ADR change is +22.0%, and the same-prefecture, same-type market is +13.1%. Note that each column is a property-level median, so they do not add up. The probability of a positive gap is 71%.
Upside: gap +32.2pt
The upper quartile. The top 12 range from +16.4pt to +54.5pt. Two groups with different drivers are mixed here: urban limited-service hotels (a premium on top of markets moving +23% to +49%) and regional onsen ryokan in almost flat markets (a solo rise).
How to read the sensitivity: these three scenarios are not forecasts. They are the distribution of gaps actually observed across 24 properties acquired since 2023. They are meant to be used as an empirical range when putting bounds on rate assumptions during acquisition analysis, not as a substitute for a point estimate. Because the center of the range differs by hotel type (onsen ryokan & resort +17.2pt, N=6; limited-service +12.9pt, N=9; full-service +1.8pt, N=9), it is more accurate to look first at the row matching the target property’s hotel type.
Implications for Investors and Operators
Don’t judge on year-one numbers
Six months after acquisition, the median gap is -0.6pt and the share positive is 47%. Rates at that point say almost nothing about whether the acquisition was a good one. As far as room rates are concerned, frameworks that assess performance on quarterly comparisons right after acquisition are premature.
The upside is concentrated in year two
The gap starts to rise at relative months +11 to +12. The rate gains to be built into an acquisition valuation are tied not to the acquisition year but to the rate-design cycle from the following year onward (for the cost structure on the buyer’s side, see Hotel Acquisition Costs 7.1%: A 6.5% Gross Yield Becomes 4.65% Net).
The flatter the market, the more visible the gap
Onsen ryokan & resorts had the largest gap (+17.2pt) because their market curve was flat. In areas with a weak tailwind, the operator’s moves show up directly in the rate.
From the operator’s side, the implication gets more concrete. Rates not moving in the first year after acquisition is probably not because there is little pricing discretion, but because the annual rate-design cycle has not yet come round. If so, then regardless of when ownership changes, how early work on the next year’s rate design can start determines how fast repricing happens. The “12-month lag” shown by these 46 properties is both a structural constraint and a period that has room to be shortened.
Summary
We tracked the 46 properties, 6,701 rooms and ¥251,721 million acquired by J-REITs since 2023, starting from each acquisition month. Before acquisition, the properties moved in parallel with the market. For eight months after acquisition, the gap stays within 3pt. It opens in month 12, and by month 24 the properties are ahead of their market by a median +12.8pt. On period averages too, the months 13-24 window shows a median gap of +15.0pt, with 71% of properties positive.
However, the interquartile range is wide, from -7.1pt to +32.2pt, so this is not something that happens uniformly to every property. By hotel type the results split into onsen ryokan & resort +17.2pt, limited-service +12.9pt and full-service +1.8pt, with larger gaps in types where the market itself was not moving. Occupancy two years after acquisition held at a median 87.8% (estimate, aggregated April-August 2026, N=23 properties), confirming that the rate gains did not come at the cost of lower sales volume.
Finally, what this article can show is correlation, not causation. Renovation, rebranding and market recovery can all move alongside an acquisition, and much of the sample is a transfer of asset ownership with no change of operator. Even so, the pattern of “rates start to move one year after the acquisition event” was observed consistently across a fixed panel of 24 properties spanning different hotel types and regions, and that should matter when thinking about the time horizon over which post-acquisition operations are judged.
Related Reading
References and Sources
■ Data sources
From the REIT ownership master (as of August 31, 2026), we extracted the 46 properties (6,701 rooms in total, aggregate acquisition price ¥251,721 million) held by four domestic hotel REITs that were acquired in January 2023 or later and matched one-to-one to a property in our hotel master. For each property, and for the area of the same prefecture and same hotel type, we obtained the monthly series of estimated settled ADR (an estimate derived by applying a hotel-type-specific adjustment factor to the lowest-priced plan each property publishes on OTAs). Estimated occupancy is based on how much OTA sales inventory has been taken up, covering the five months April-August 2026, N=23 properties.
■ Calculation assumptions
Each property’s 12-month moving-average ADR was indexed to acquisition month (relative month 0) = 100, and the area ADR for the same prefecture and hotel type was indexed to the same base month in the same way to form the market curve. The gap (property index minus market index) was calculated property by property, and the median taken for each relative month. The main charts use a fixed panel of the 24 properties observable for at least 24 months after acquisition (4,130 rooms in total; acquired June 2023, August 2023 or July 2024). The window summary compares period averages against the 12-month pre-acquisition average; because each window requires a different observation period, N differs. ADR uses only finalized monthly results and does not include estimates based on listed prices for future months.
■ Limitations
This article observes correlation; it does not identify causation. Renovation, rebranding and market recovery can move at the same time as an acquisition, and a substantial part of the sample is a transfer of asset ownership with no change of operator. Because the market curve is at prefecture-by-hotel-type granularity, location differences within a prefecture (station-front versus suburban, for example) remain as residual error. The gap median is a property-level median and does not add up with the “acquired property ADR change” and “market ADR change” columns in the tables. Mechanically extracting the sample from the ownership master using the criteria above yields 47 properties; the one-property difference (acquired September 2025, 146 rooms, acquisition price ¥920 million) is not included in this analysis. Because it does not meet the 12-month post-acquisition observation period, it does not affect the 12-month window, the 24-month window or the fixed-panel results. The months 13-24 window for the three major metro areas is thin at N=5, and that level cannot be generalized. Both ADR and occupancy are estimates and differ from each property’s and each REIT’s accounting figures.
■ Market data
- MetroEngines Research & Consulting — Estimated settled ADR (the 46 properties and area ADR for the same prefecture and hotel type), estimated occupancy, REIT ownership master (as of August 31, 2026)
■ REIT disclosures and IR materials (Japanese)
- Invincible Investment Corporation, “Notice concerning Acquisition and Lease of 12 Domestic Hotels” (July 2024)
- Invincible Investment Corporation, “Notice concerning Acquisition and Lease of Assets” (August 25, 2025)
- Invincible Investment Corporation, Portfolio List
- Ichigo Hotel REIT Investment Corporation, “Notice concerning Acquisition of Assets and Commencement of Leases” (August 16, 2023)
- Ichigo Hotel REIT Investment Corporation, Portfolio List
- Nippon Hotel & Residential Investment Corporation, Portfolio
- Hoshino Resorts REIT, Portfolio List
- JAPAN-REIT.COM, “Nippon Hotel & Residential Issues New Units, Acquires 8 Properties Including APA Hotel Asakusabashi-Ekimae” (2024)