

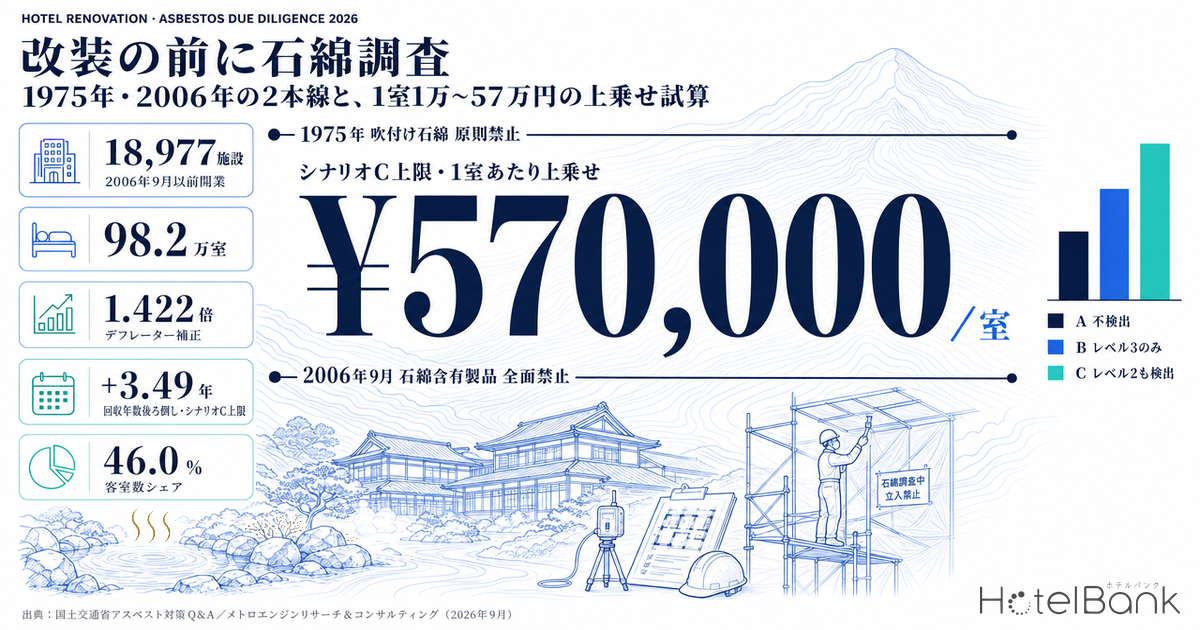
With construction costs stuck at high levels, more owners are choosing to renovate rather than build new. Yet one item is easy to miss in a renovation business plan: the pre-works asbestos survey that must happen before any interior finishes come off, and the removal cost and schedule impact if asbestos is found. For refurbishment works with a contract value of ¥1 million or more (tax included), reporting the survey results is a legal obligation, and since October 2023 the survey must be carried out by a qualified person. This article looks not at the “return side” of renovation but at the “unbudgeted cost side” that is locked in before work starts, covering the regulations, the distribution of the building stock, and a cost model, in that order.
Metric Definitions Used in This Article
- ADR (average daily rate): an estimated achieved rate (tax-excluded equivalent), calculated by applying a property-type adjustment factor to the lowest plan each property lists on OTAs (2 guests per room, price per room, tax included). Checked against the property-level results disclosed by listed hotel REITs (91 properties, most recent 3 months), the median error is about 7%. These are estimates and differ from each property’s actual achieved prices and accounting figures. Area-level ADR is the median across the properties covered (the level of a typical property in the area).
- Opening year: the opening date of each property as recorded by MetroEngines Research. Note that it does not necessarily match the construction year (year construction started): rebrandings, acquisitions of existing buildings and changes of operating company can record an opening year that is newer than the building itself. The year bands used here are only a guide to the periods when asbestos-containing materials may have been used; they do not indicate whether any individual property contains such materials.
- Data source: MetroEngines Research & Consulting (as of September 1, 2026)
Where this article fits: our earlier pieces on hotel capital expenditure (¥130k–¥620k per room per year, from REIT IR disclosures) and on lodging-industry capex (1.51x depreciation, from the Financial Statements Statistics of Corporations) covered the return side and the scale of renovation spending. Our article Japan’s Pre-1981 Hotel Stock: 236k Rooms, 19.1% dealt with 1981 as the seismic cut-off year. This article uses two different cut-offs: 1975 (the ban in principle on sprayed asbestos) and September 2006 (the total ban on asbestos-containing products). The 236k-room figure from that article is cited here as a given and has not been recalculated. Demolition costs and floor-area ratio issues for rebuilding legally non-conforming buildings are outside the scope of this article.
- — Works above ¥1 million for refurbishment or 80㎡ for demolition carry a legal duty to report the results of an asbestos pre-works survey. Since October 2023 the survey must be done by a qualified person, and the cost arises whether or not asbestos is found.
- — 18,977 properties and approx. 982k rooms opened in or before September 2006 (where opening year is known; 46.0% of rooms). Of these, 4,220 properties and approx. 181k rooms opened before 1975.
- — Hot-spring regions are the most exposed to these cut-offs. The share of rooms opened in 2006 or earlier is 65.4% in Nagano, 62.6% in Gunma and 55.6% in Shizuoka, versus 40.5% in Tokyo and 31.8% in Osaka.
- — For a 100-room, 3,500㎡ model, the add-on is ¥10k–¥570k per room. The simple payback period stretches from 7.88 years to as much as 11.38 years, a delay of up to 3.49 years.
- — The ratings that renovation moves are concentrated in rooms (+0.22) and cleanliness (+0.26), while service (+0.08) and meals (−0.01) barely move. Asbestos costs fall on exactly the parts of the building where the rating gap shows up.
Past ¥1 million for refurbishment or 80㎡ for demolition, reporting becomes mandatory
Asbestos-related procedures run on two tracks: the Air Pollution Control Act and the Ordinance on Prevention of Health Impairment due to Asbestos, which sits under the Industrial Safety and Health Act. The two differ in scope and in the authority you report to, but reports go into a single electronic system. According to a Ministry of the Environment press release, the reporting system applies to works starting on or after April 1, 2022 (Reiwa 4). It covers demolition works where “the total floor area subject to demolition is 80㎡ or more”, and refurbishment works and works on structures where “the total contract value is ¥1 million or more (tax included)”. The ministry explains that the system lets you “report to both the prefecture (or equivalent) and the Labour Standards Inspection Office in a single operation”, and the system was designed on the assumption of “around 2 million reports a year”.
The practical implication is clear. For a hotel or ryokan of around 100 rooms, a renovation that includes interior upgrades will almost never come in under a ¥1 million contract. In other words, it is safest to assume that the reporting duty applies as a matter of course once you renovate. On top of that, according to the Ministry of Health, Labour and Welfare’s asbestos information portal, the pre-works survey that the report is based on must “include both a document review of design drawings and similar records and a visual inspection”, and for buildings, since October 2023 the survey must be carried out by someone who meets set requirements, such as a certified building asbestos survey inspector. Survey records must be kept for three years and kept available at the work site.
The rate-limiting step in the schedule is the lead time from survey to contract award. The sequence runs from arranging a qualified inspector, to the site survey, to analysis where needed (sample collection and qualitative analysis), and finally to fixing the construction plan based on the results. So the timeline from the renovation decision to the start of works cannot be fixed until you know whether asbestos is present. If asbestos is found, removal of asbestos-containing insulation and similar materials must be notified at least 14 days before works begin, and after removal a qualified person must also confirm that nothing has been left behind.
| Level | Typical materials | Friability | Main measures (guide) | Schedule impact |
|---|---|---|---|---|
| Level 1 | Sprayed asbestos, sprayed rock wool containing asbestos | High | Enclosure, negative-pressure dust extraction units, work plan. Removal must be notified at least 14 days in advance | Large |
| Level 2 | Asbestos-containing thermal insulation, fireproof coating, heat insulation | Medium | Enclosure, wetting, etc. Removal of asbestos-containing insulation and similar must be notified at least 14 days in advance | Medium–large |
| Level 3 | Asbestos-containing formed boards (slate, calcium silicate board, etc.), finishing coatings | Low | In principle, wetting and removal by hand without breaking the material. Some methods require enclosure where cutting is involved | Small–medium |
It is worth stressing that even Level 3 does not mean “no survey needed”. The reporting duty is triggered by the size of the works, not by whether asbestos is present, and a survey is precisely what is needed to conclude that there is none. From the point of view of whoever plans the renovation, the asbestos survey is not “a cost that arises if something is found” but “a cost that always arises once works go ahead”.
1975 and September 2006 — two lines that split the stock, and the 18,977 properties behind them
Japan’s asbestos regulatory timeline has two cut-offs that matter in practice when reading the hotel and ryokan stock. The first is 1975 (Showa 50), when an amendment to the Ordinance on Prevention of Hazards due to Specified Chemical Substances banned, in principle, spraying work using materials with more than 5% asbestos by weight. Sprayed materials are Level 1, which carry the heaviest removal measures. The second is September 2006. According to the Ministry of Land, Infrastructure, Transport and Tourism (MLIT) asbestos Q&A, “asbestos-containing building materials (those containing more than 0.1% asbestos by weight) have been totally banned from manufacture, use, etc. under the Order for Enforcement of the Industrial Safety and Health Act since September 2006 (Heisei 18)”. Buildings whose construction started after that date should, in principle, contain no asbestos-containing materials.
We applied these two lines to the Japanese lodging properties whose opening year MetroEngines Research tracks. The population is 51,901 properties and approx. 2.136 million rooms with a known opening year (as of September 1, 2026). Because there is a known cluster of records concentrated on one particular opening year, those records are treated as “opening year unknown” and excluded from this count.
Properties that opened in 2006 or earlier number 18,977, with approx. 982k rooms, or 46.0% of the population by room count. Of these, 4,220 properties and approx. 181k rooms (8.5%) opened before 1975, a period when sprayed asbestos was not yet regulated. Compared with the 1981 seismic cut-off in our earlier article (236k rooms, 19.1% of all rooms), the asbestos cut-offs cover a far wider part of the stock. Whether a building needs seismic strengthening and whether it needs an asbestos survey are entirely separate questions. For a view of the opening-year mix itself as renewal potential, broken down by area, see 226k Hotel Rooms in 32 Regional Cities: 42.7% Built Before 1996.
Limits of this reading. The opening year used here is not the construction year (year construction started). Because of rebrandings and acquisitions of existing buildings, some properties have a newer recorded opening year while the building itself dates from the 1970s. So you cannot conclude that “it opened after 2006, so there is no asbestos”. The reverse also holds: a property with an old opening year may already have been fully rebuilt. The figures in this section do not show whether any individual property contains such materials; they show how wide the population is that due diligence needs to check.
Published statistics on report volumes — no breakdown by building use
On the scale of the system’s operation, the Ministry of the Environment’s press release gives “around 2 million reports a year” as the volume assumed when the system was designed. However, as of our research, we could find no published figures for the actual number of reports submitted to the asbestos pre-works survey reporting system by fiscal year, nor any breakdown by prefecture or by building use (such as lodging). This article therefore does not estimate a report count specific to the lodging industry and uses only the system-wide assumption above.
The fact that no breakdown by use is available itself matters for investment decisions. There is no cross-industry public baseline for how often asbestos is detected in hotel and ryokan renovations. In other words, the engineering report for each individual property is the only source of information, and if that item has not been checked at acquisition, the assumptions behind the renovation plan are not yet fixed at that point.
Three regions with a deep 1970s–80s stock — the room mix in Shizuoka, Gunma and Nagano
The year cut-offs really bite in regions where onsen ryokan and company retreats were built in large numbers from the high-growth era through the late Showa period. Here we take three regions as examples and look at the mix by opening-year band: Shizuoka Prefecture, home to Atami and Ito; Gunma Prefecture, with Kusatsu and Ikaho; and Nagano Prefecture, with Kami-Suwa, Shirahone and others.
| Prefecture | Properties | Rooms | –1974 | 1975–2006 | 2007– | Share of rooms opened by 2006 |
|---|---|---|---|---|---|---|
| Shizuoka Atami, Ito | 1,945 | 55,658 | 221 7,663 rooms | 567 23,306 rooms | 1,157 24,689 rooms | 55.6% |
| Gunma Kusatsu, Ikaho | 839 | 22,418 | 142 5,040 rooms | 262 8,998 rooms | 435 8,380 rooms | 62.6% |
| Nagano Kami-Suwa, Shirahone, etc. | 2,885 | 56,076 | 377 10,859 rooms | 987 25,789 rooms | 1,521 19,428 rooms | 65.4% |
| Tokyo (reference) | 2,656 | 238,522 | 147 18,919 rooms | 584 77,581 rooms | 1,925 142,022 rooms | 40.5% |
| Osaka (reference) | 1,592 | 150,929 | 73 7,235 rooms | 322 40,704 rooms | 1,197 102,990 rooms | 31.8% |
By room count, the share opened in 2006 or earlier is 65.4% in Nagano, 62.6% in Gunma and 55.6% in Shizuoka. For reference, Tokyo is at 40.5% and Osaka at 31.8%, so the share of rooms caught by the asbestos cut-offs is 10–30 percentage points higher in onsen regions than in the big cities. Mid-sized onsen ryokan continue to be favored as value-add investment targets, but that same population is also the one where the pre-works survey result is most likely to change the business plan.
| Shizuoka | ¥18,961 | N=444 properties |
| Gunma | ¥15,907 | N=279 properties |
| Nagano | ¥13,468 | N=503 properties |
The lower the annual revenue per room in an area, the more the same asbestos cost lengthens the payback period. Estimated achieved ADR in the three regions runs from ¥13,000 to ¥19,000, and the model in the next section is based on a level in that range.
A 100-room, 3,500㎡, 40-year-old model — ¥10k–¥570k added per room, payback pushed back by up to 3.5 years
Now we put numbers on it. The model is a 100-room onsen-ryokan-type property with 3,500㎡ of total floor area, 40 years old (construction started around 1986, i.e. in the 1975–2006 band), undergoing a full refresh of guest-room interiors. Since construction started after 1975, Level 1 sprayed asbestos is relatively unlikely, but Level 2 (insulation in machine and boiler rooms, fireproof coating on steel frames) and Level 3 (formed boards and finishing coatings) may remain.
Where the unit costs come from, and their limits, stated up front. The only unit costs for asbestos removal published by the government are, in effect, the construction-record data in Q40 of MLIT’s “Asbestos Countermeasures Q&A”. As “removal unit costs calculated from construction-record data for January to December 2007”, that Q&A gives, by treated area, up to 300㎡ = ¥20,000–¥85,000/㎡, 300–1,000㎡ = ¥15,000–¥45,000/㎡, and 1,000㎡ or more = ¥10,000–¥30,000/㎡. We converted these to current prices using MLIT’s Construction Cost Deflator (FY2015 base, building total / non-residential total): 93.8 in FY2007 → 133.4 in FY2025 (1.422x).
Three caveats apply: (1) these unit costs are based mainly on removal records for sprayed asbestos and similar, and are not broken down by level; (2) no published unit cost specific to Level 3 materials can be found in government documents; (3) local-government tender results vary by project and cannot be used as a cross-cutting unit cost. For these reasons, this model is presented as a cost envelope (a range), not a point estimate. No figures from price-summary websites have been used.
| Treated area band | 2007 records (published) | Converted to FY2025 prices (×1.422) |
|---|---|---|
| Up to 300㎡ | ¥20,000–¥85,000 | ¥28,400–¥120,900 |
| Over 300㎡ to 1,000㎡ | ¥15,000–¥45,000 | ¥21,300–¥64,000 |
| Over 1,000㎡ | ¥10,000–¥30,000 | ¥14,200–¥42,700 |
For survey costs, Q41 of the same Q&A sets the national subsidy cap for surveying sprayed materials at “¥250,000 per building in principle”. Starting from that, we set the per-building cost of a document review and on-site visual survey by a qualified inspector, plus sample analysis, at ¥500,000–¥1,500,000 (this is not a published market rate but an assumption of this article, anchored on the subsidy cap above). The removal area is assumed to be 30% of total floor area for Level 3 = 1,050㎡, and 10% for Level 2 = 350㎡.
| Scenario | Assumption | Cost scope | Low–high | Mid | Per room (mid) |
|---|---|---|---|---|---|
| Scenario A | No asbestos detected (analysis negative) | Survey and reporting only | ¥500,000 –¥1,500,000 | ¥1,000,000 | ¥10,000 |
| Scenario B | Level 3 only detected (formed boards, finishing coatings) | Survey + removal of 1,050㎡ | ¥15,432,836 –¥46,298,507 | ¥30,865,672 | ¥308,657 |
| Scenario C | Level 2 also detected (insulation, fireproof coating) | Survey + 1,050㎡ + 350㎡, 14-day advance notice, enclosure | ¥25,388,060 –¥88,608,209 | ¥56,998,134 | ¥569,981 |
The add-on per room is about ¥10k in Scenario A, about ¥309k in Scenario B and about ¥570k in Scenario C. Set against the annual capex levels disclosed by listed REITs (¥130k–¥620k per room per year, as covered in our earlier article on REIT capital expenditure), the Scenario C add-on is roughly equivalent to stacking one extra full year of capital expenditure.
Next, we look at how much this add-on moves the payback period. We set the core renovation investment at ¥2 million per room × 100 rooms = ¥200 million. Pre-renovation estimated achieved ADR is set at about ¥19,000 (measured value ¥18,961), the last-12-month average (July 2025 – June 2026) for the ryokan category in Shizuoka, with occupancy of 70% (full-year, a model assumption) and a GOP margin of 20%. After renovation we assume ADR +10%, occupancy of 73% (full-year, same basis) and a GOP margin of 22%. Under these assumptions the renovation adds about ¥25.37 million of GOP a year, and the simple payback period excluding asbestos costs is 7.88 years.
| Scenario | Level | Asbestos cost | Total investment | Simple payback | vs. no asbestos |
|---|---|---|---|---|---|
| Scenario A | Low | ¥500,000 | ¥200,500,000 | 7.90 yrs | +0.02 yrs |
| Scenario A | Mid | ¥1,000,000 | ¥201,000,000 | 7.92 yrs | +0.04 yrs |
| Scenario A | High | ¥1,500,000 | ¥201,500,000 | 7.94 yrs | +0.06 yrs |
| Scenario B | Low | ¥15,432,836 | ¥215,432,836 | 8.49 yrs | +0.61 yrs |
| Scenario B | Mid | ¥30,865,672 | ¥230,865,672 | 9.10 yrs | +1.22 yrs |
| Scenario B | High | ¥46,298,507 | ¥246,298,507 | 9.71 yrs | +1.82 yrs |
| Scenario C | Low | ¥25,388,060 | ¥225,388,060 | 8.88 yrs | +1.00 yrs |
| Scenario C | Mid | ¥56,998,134 | ¥256,998,134 | 10.13 yrs | +2.25 yrs |
| Scenario C | High | ¥88,608,209 | ¥288,608,209 | 11.38 yrs | +3.49 yrs |
| Asbestos cost | Amount | ADR +5% | ADR +7.5% | ADR +10% | ADR +12.5% | ADR +15% |
|---|---|---|---|---|---|---|
| No asbestos | — | 10.09 yrs | 8.85 yrs | 7.88 yrs | 7.10 yrs | 6.47 yrs |
| Scenario A mid | ¥1.0M | 10.14 yrs | 8.90 yrs | 7.92 yrs | 7.14 yrs | 6.50 yrs |
| Scenario B mid | ¥30.87M | 11.65 yrs | 10.22 yrs | 9.10 yrs | 8.20 yrs | 7.46 yrs |
| Scenario C mid | ¥57.00M | 12.97 yrs | 11.38 yrs | 10.13 yrs | 9.13 yrs | 8.31 yrs |
| Scenario C high | ¥88.61M | 14.57 yrs | 12.77 yrs | 11.38 yrs | 10.25 yrs | 9.33 yrs |
The payback period is pushed back by +0.04 years in Scenario A (effectively negligible), +1.22 years at the Scenario B mid point, +2.25 years at the Scenario C mid point, and +3.49 years at the Scenario C high end. A plan built on 7.88 years becoming 11.38 years is a range that directly raises questions about a fund’s holding-period design and a lender’s repayment term.
Scenario C also adds enclosure and negative-pressure dust extraction, 14-day advance notice, and a post-removal check by a qualified person for any material left behind, so you also need to allow for the number of days by which reopening is delayed. Under the assumptions above, daily GOP is about ¥265k, so a 30-day extension to the works shifts about ¥7.96 million of trading-day profit into the next period, and 45 days about ¥11.95 million. This is a question of when revenue is recognized rather than a cost, but it matters when estimating first-year debt-service capacity (daily GOP is the pre-renovation annual GOP under the assumptions above divided by 365 days. Source: estimates by MetroEngines Research & Consulting).
Where ratings move — concentrated in rooms and cleanliness, with no gap in service or meals
On the cost side alone, renovation is a heavy burden. But once you pin down which ratings a renovation actually moves, it becomes easier to see why the add-on cost is worth bearing. Here we split properties with 10 or more rooms in Shizuoka, Gunma and Nagano into three groups by opening-year band and compared the median guest-review scores by category (limited to properties with 30 or more reviews). No individual properties are identified; only cohort aggregates are used.
| Category | –1974 N=511 properties | 1975–2006 N=1,010 properties | 2007– N=758 properties | New vs. old gap (2007– minus 1975–2006) |
|---|---|---|---|---|
| Rooms | 3.92 | 3.90 | 4.11 | +0.22 |
| Cleanliness | 4.01 | 4.00 | 4.26 | +0.26 |
| Bathroom | 4.08 | 3.85 | 3.90 | +0.05 |
| Facilities & amenities | 3.71 | 3.71 | 3.90 | +0.19 |
| Service | 4.16 | 4.08 | 4.16 | +0.08 |
| Meals | 4.21 | 4.09 | 4.08 | -0.01 |
| Location | 4.11 | 4.08 | 4.16 | +0.08 |
The gaps open up in rooms (+0.22), cleanliness (+0.26) and facilities & amenities (+0.19). By contrast, service moves only +0.08 and meals actually −0.01, so they barely move at all. In fact, the group that opened in 1974 or earlier has the highest meals score, at 4.21. In other words, the rating gap that building age can explain is concentrated in the rooms themselves and cleanliness, while service and cuisine, the core value of a ryokan, cannot be explained by building age.
This feeds straight into how a renovation should be designed. The strengths of older properties are built up in cuisine and service, and renovation can be positioned as a way to lift only the parts that tend to score poorly, the rooms and wet areas, without damaging those strengths. Put the other way round, this data shows no way to raise the overall rating without touching the rooms. Even if asbestos handling adds ¥300k–¥570k per room, the investment stays on target as long as the renovation focuses on the rooms and wet areas where the rating gap actually shows up.
Note that this section compares scores between cohorts and does not deal with the number of review mentions. Mention density varies with the version of the analysis method, so the comparison is designed around rating levels rather than changes in counts.
Making it a standard due diligence item
Restated in investment terms, the points above come down to three issues.
Check whether the engineering report includes asbestos survey results and, if so, whether the survey was done by a qualified person and whether the level classification and affected areas have been identified. If this has not been checked, the total investment for the renovation plan is not yet fixed.
A range of ¥10k–¥570k per room for a 100-room model means the plan cannot be built on a point estimate. If you first confirm that the plan still works with the high end built in, you will not need to rework it once the survey results come in.
Everything from arranging a qualified inspector through analysis, reporting and, where needed, the 14-day advance notice is a precondition for starting works. The more a property wants to fit works into the off-season, the more the survey start date becomes the real deadline.
In practice, asbestos handling is better treated not as something that eats into renovation returns but as a precondition that determines whether and when a renovation can be carried out. The stock of 4,220 properties and approx. 181k rooms opened before 1975, or 18,977 properties and approx. 982k rooms if extended to 2006, makes up a substantial part of Japan’s hotels and ryokan. With value-add investment opportunities widening across this population, setting out the pre-works survey as a standard item saves reinventing it deal by deal.
Finally, every estimate in this article is a simplified model based on published unit costs and a deflator. Actual costs vary widely with the type and quantity of materials, site conditions and local disposal costs, so any investment decision requires a pre-works survey by a qualified inspector and quotes from contractors.
Related Articles
References & Sources
■ Data sources
Properties and rooms by opening-year band were aggregated from MetroEngines Research & Consulting’s lodging property database (based on OTA listings, as of September 1, 2026), using the 51,901 properties and approx. 2.136 million rooms with a known opening year as the population (the known cluster of records concentrated on one opening year is excluded as “opening year unknown”). Estimated achieved ADR is the simple average of monthly values from July 2025 to June 2026 (closed months on an actuals basis only) for the ryokan category in Shizuoka, Gunma and Nagano (Shizuoka N=444 properties / Gunma N=279 / Nagano N=503). Review scores are cohort aggregates for 2,279 properties with 10+ rooms and 30+ reviews in the same three prefectures, 3,603,297 reviews in total. Regulations and unit costs are from published documents of the Ministry of the Environment, the Ministry of Health, Labour and Welfare and MLIT.
■ Model assumptions
The model assumes a 100-room onsen-ryokan-type property with 3,500㎡ of total floor area, 40 years old (construction started in the 1975–2006 band). Removal areas are set at 30% of total floor area for Level 3 = 1,050㎡ and 10% for Level 2 = 350㎡. Removal unit costs are the 2007 construction records in Q40 of MLIT’s “Asbestos Countermeasures Q&A”, converted to FY2025 prices using the Construction Cost Deflator (FY2015 base, building total / non-residential total; FY2007 93.8 → FY2025 133.4 = 1.422x). Survey costs are set at ¥500,000–¥1,500,000 per building, anchored on the ¥250,000-per-building subsidy cap in Q41 of the same Q&A (an assumption of this article, not a published market rate). Payback assumes a core renovation of ¥200 million (¥2 million per room × 100 rooms), pre-renovation ADR ¥18,961 (July 2025 – June 2026 average), occupancy 70% (full-year) and GOP margin 20%, and post-renovation ADR +10%, occupancy 73% (full-year) and GOP margin 22% (all model assumptions); simple payback = total investment ÷ incremental annual GOP of approx. ¥25.37 million.
■ Limitations and caveats
(1) The opening year in this article is not the construction year (year construction started). It may diverge from the building’s age because of rebrandings and acquisitions of existing buildings, and the year bands do not indicate whether any individual property contains asbestos-containing materials. (2) Published removal unit costs are not broken down by level, and no unit cost specific to Level 3 materials can be found in government documents. This model is therefore presented as a cost envelope (a range) rather than a point estimate. (3) As of our research, report counts by use (lodging) from the asbestos pre-works survey reporting system could not be confirmed as published, and no lodging-specific detection frequency or report count has been estimated. (4) The sensitivity analysis varies only the ADR lift and the asbestos cost, and does not reflect lost trading days from a longer works period, interest costs, or regional differences in disposal costs. (5) No figures from unofficial sources such as price-summary websites have been used.
■ Laws and regulations (primary sources)
- Ministry of the Environment, press release: “Asbestos pre-works survey reporting system starts April 1” (Japanese) (reporting thresholds, expected report volume)
- Ministry of Health, Labour and Welfare, “Asbestos Information Portal — For prime contractors” (Japanese) (survey methods, record keeping, notifications)
- Ministry of Health, Labour and Welfare, “Key points of the amended Asbestos Ordinance” (Japanese) (effective date of surveys by qualified persons)
- Ministry of Health, Labour and Welfare / Ministry of the Environment, “Asbestos Pre-Works Survey Reporting System” (Japanese)
- Ministry of the Environment / Ministry of Health, Labour and Welfare, “Manual on Thorough Measures to Prevent Asbestos Exposure and Scattering in the Demolition of Buildings” (February 2026 edition, Japanese)
- Ministry of the Environment, Asbestos Scattering Prevention Subcommittee material: “Preventing asbestos scattering during removal of non-specified asbestos-containing materials (Level 3)” (Japanese)
■ Costs and unit prices (primary sources)
- MLIT, “Asbestos Countermeasures Q&A” (Japanese) (Q40 removal cost guide = construction-record data for January–December 2007; Q41 survey subsidy cap of ¥250,000 per building; Q43 removal subsidy rate; total ban from September 2006)
- MLIT, “Construction Cost Deflator (FY2015 base)”, building total / non-residential total (e-Stat table ID 0003447803; FY2007 93.8 → FY2025 133.4)
- MLIT, “Statistics on Building Construction Starts”, buildings for lodging use (e-Stat table ID 0003114490; 2024 planned construction cost ÷ floor area = ¥591,279/㎡, approx. ¥1.955 million per tsubo)
■ Market data
- MetroEngines Research & Consulting — Properties and rooms by opening year (based on OTA listings, opening year known, N=51,901 properties / approx. 2.136 million rooms, as of September 1, 2026); estimated achieved ADR (Shizuoka, Gunma, Nagano / ryokan category, July 2025 – June 2026)
- HotelBank Editorial Team research — Guest review scores by category (Shizuoka, Gunma, Nagano; N=2,279 properties, 3,603,297 reviews in total)