

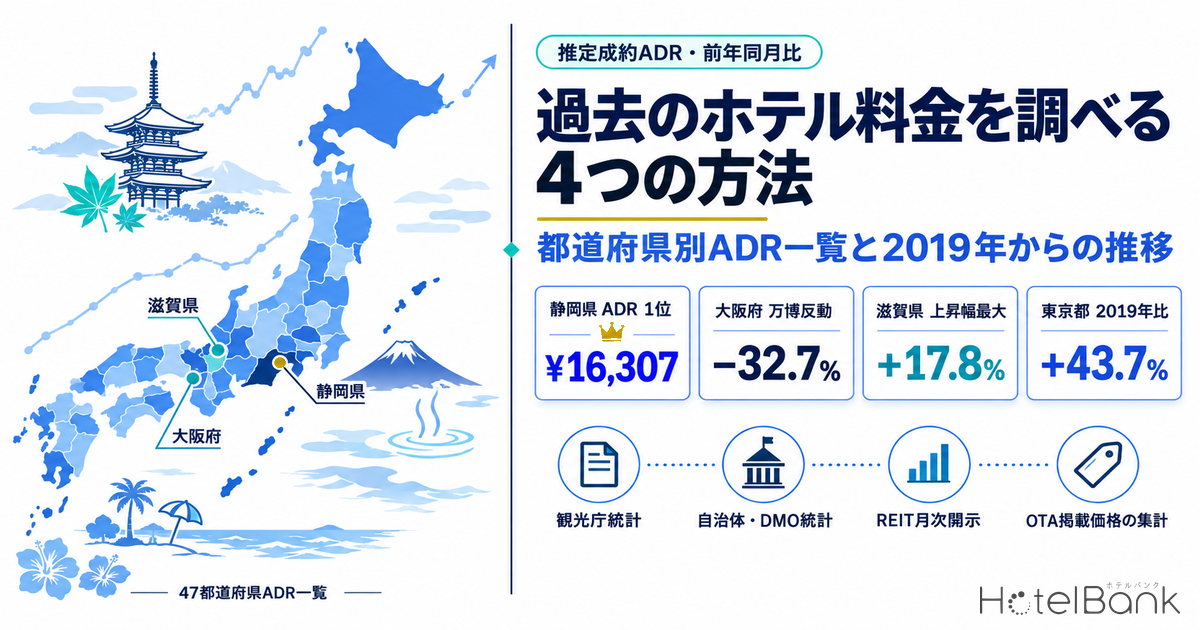
“What were hotels in this area actually selling for at this time last year?” Every budget cycle and investment decision eventually runs into this question, and no single database answers it on its own. Public statistics cover occupancy and guest nights but do not publish room rates (ADR), while listed hotel REIT disclosures are precise but cover only the properties each REIT owns. This article lays out the coverage, reporting lag and definitional differences of the four main ways to look up past hotel rates and ADR. It also includes an estimated settled ADR table for all 47 prefectures (August 2026, year-over-year) and a long-term series from 2019 to 2026.
Metric Definitions Used in This Article
- ADR (average daily rate) = an estimated settled rate (tax-exclusive equivalent), calculated by applying segment-specific adjustment factors to the lowest-plan price each property publishes on OTAs and similar channels (per room, 2 guests per room, tax included). Checked against property-level results disclosed by listed hotel REITs (91 properties, most recent 3 months), the median error is about 7%. These are estimates and differ from each property’s actual transaction prices and accounting figures. Area-level ADR is the median across covered properties (the level of a typical property in the area).
- Listed price (all-plan average, tax included) = the average published price across all plans, from room-only to plans with meals. This is a separate metric from ADR.
- OCC (occupancy rate) = rooms sold as a share of total rooms in the area (an estimate based on OTA sales inventory).
- Data source: MetroEngines Research
- — No public statistic publishes room rates. The Japan Tourism Agency’s Overnight Travel Statistics Survey (宿泊旅行統計調査) stops at guest nights and occupancy, so past rates have to be assembled from other sources.
- — Match the source to the question. Long-term demand trends suit the JTA survey, rate history for specific properties suits listed hotel REITs’ monthly disclosures, and cross-sectional comparisons by area and segment suit aggregated OTA listed prices.
- — August 2026: 14 prefectures up, 33 down. The largest decline was Osaka at −32.7% (¥13,452→¥9,058), but that is a payback from last year’s Expo, and the figure is roughly in line with August 2024’s ¥9,433.
- — The choice of base year can flip the sign. Tokyo’s August 2026 ADR is +43.7% vs 2019 but −9.2% year over year. Okinawa, at ¥14,652, set a new high for the entire period.
- — Four things to align before comparing: tax-inclusive vs tax-exclusive, per room vs per person, changes in the property sample, and preliminary vs confirmed figures. State these four, and even estimates can support decisions.
Four Ways to Research Past Hotel Rates
There are four broad sources for past room rates. Each differs in who compiles it, what it measures and at what granularity, so the first step is to work out which source can actually answer your question.
| Source | Main published items | Granularity | Available from |
|---|---|---|---|
| JTA Overnight Travel Statistics Survey | Guest nights, number of guests, room occupancy, capacity occupancy, rooms used, foreign guest nights by nationality | National / 47 prefectures / 6 facility types, monthly | 2007– |
| Local government and DMO statistics | Tourist arrival statistics, accommodation tax receipts; some municipalities publish taxed stays by price band | Municipality / tourism zone, monthly to annual | Varies widely by municipality |
| Listed hotel REIT monthly disclosures | ADR, OCC, RevPAR and revenue (with YoY); most also break out individual properties | Individual property / portfolio, monthly | From each REIT’s listing |
| Aggregated OTA listed prices (our data) | Estimated settled ADR, listed price (all-plan average), remaining inventory | National / prefecture / municipality / property, monthly and daily | July 2019– |
Source: Compiled by HotelBank Editorial Team from each published source
Free vs Paid, and How Current — A Practical Comparison of the Four Sources
In practice, the deciding factor is usually neither cost nor coverage but how recent the data goes. Here is where each source stood as of September 19, 2026.
For the JTA Overnight Travel Statistics Survey, the first preliminary release for July 2026 came out on August 31, 2026, the second preliminary release for June 2026 has also been published, and confirmed figures are final through full-year 2025. Because figures are revised in stages from preliminary to confirmed, time series need to compare preliminary with preliminary and confirmed with confirmed, or artificial breaks appear. Note also that e-Stat’s database-format API (via statsDataId) only covers this survey through 2016. For 2017 onward you need to download e-Stat’s file releases or the Excel files on the JTA website and reshape them yourself. This is the first stumbling block when designing an automated statistics pipeline.
On rate accuracy alone, listed hotel REITs’ monthly disclosures are unmatched. They are accounting actuals, and ADR, OCC and RevPAR come with year-over-year comparisons. The lag is short too: Invincible Investment Corporation (インヴィンシブル投資法人), for example, published its July 2026 operating results on August 25, 2026 (101 domestic hotels, OCC 86.3%, ADR ¥15,100, RevPAR ¥13,039, ADR −1.0% YoY). The coverage, however, is limited to each REIT’s own portfolio and does not represent an area as a whole. Citing figures from a REIT that owns nothing in your target area tells you nothing. Also note that occupancy as published by REITs and occupancy as we estimate it from OTA inventory use different denominators, and in July 2026 the two differed by as much as 10.1 percentage points — a gap that can itself be used as an early read on month-end results.
Aggregated OTA listed prices combine area-level granularity with timeliness, but they are estimates rather than transaction actuals. Our estimated settled ADR applies segment-specific adjustment factors to published prices, is validated against property-level results disclosed by listed hotel REITs, and goes back to July 2019.
| Source | Cost | Rate data | Latest month (as of Sep 19, 2026) | Best suited for |
|---|---|---|---|---|
| JTA statistics | Free | None | July 2026 (1st preliminary) | Long-term trends in demand and occupancy, shifts in the inbound mix |
| Local government / DMO statistics | Free | Partial only | Varies widely | Demand at the municipality or tourism-zone level, price-band mix in areas with an accommodation tax |
| REIT monthly disclosures | Free | Actuals | July 2026 | Rate history for specific properties or portfolios, segment benchmarks |
| Aggregated OTA listed prices | Paid | Estimates | August 2026 (finalized month) | Rate comparisons by area and segment, competitive-set price trends, listed levels for future months |
Source: Compiled by HotelBank Editorial Team from the Japan Tourism Agency, REIT investor relations materials and MetroEngines Research
Long-Term Trend Since 2019 — August ADR in Five Major Areas
Most of the work in researching past rates comes down to choosing what to compare against. The same 2026 number looks completely different depending on whether the base is pre-COVID 2019 or 2023, when demand had recovered. To remove seasonality, the chart below fixes the month at August and plots estimated settled ADR for five major areas.
Source: MetroEngines Research, compiled by HotelBank Editorial Team (August of each year; properties covered N = Tokyo 1,004–1,193 / Osaka 561–653 / Kyoto 477–605 / Hokkaido 842–960 / Okinawa 438–513)
Tokyo’s August ADR bottomed at ¥6,574 in 2021 and recovered to ¥11,810 in 2026. That is +43.7% against 2019 (¥8,216) but −9.2% against the immediately preceding 2025 (¥13,009) — a textbook case of the base year flipping the sign. Osaka is even more extreme. Its August 2025 figure of ¥13,452 includes the one-off effect of the Expo year, and August 2026 came in at ¥9,058, −32.7% year over year. Reading that as “Osaka rates have collapsed” would be premature. Compared with August 2024 (¥9,433), the level is roughly unchanged, and that interpretation is closer to reality.
Okinawa, by contrast, hit ¥14,652 in August 2026, a new high for the entire period, up 27.5% on 2019 and 2.7% year over year — a steady build-up that does not rely on one-off events. Hokkaido is also solid at ¥12,230 in August 2026, +41.0% on 2019. These are, however, yen-denominated comparisons. Converting the same five areas into foreign currency for July 2019 and July 2026 flips the sign: +38.3% in yen becomes −7.9% in US dollars (Japan Hotels 7.9% Cheaper in USD Than 2019 — But +38.3% in Yen). When explaining prices to overseas audiences, check this currency dimension as well. Note also that between March 2020 and April 2022, the unusual demand environment tends to push estimated settled ADR above actual levels, so we do not recommend using any month in that period as a base point.
Seasonality — Kyoto Monthly ADR, Three Years Overlaid
What annual comparisons hide is seasonality. Even within one area, ADR can move by nearly a factor of two from month to month, which makes month-over-month comparisons meaningless. That is why we default to year-over-year comparisons. Overlaying Kyoto’s monthly series by year shows a clear structure, with peaks in November (autumn foliage) and March–April (cherry blossoms).
Source: MetroEngines Research, compiled by HotelBank Editorial Team (Kyoto, estimated settled ADR, N = 562–607 properties; 2026 runs through August, the latest finalized month)
Kyoto’s November 2025 ADR of ¥24,800 was about 2.0 times its June 2025 level of ¥12,437. In an area with that much swing, a statement like “up 12% month over month” explains almost nothing about actual demand. In 2026, Kyoto’s January–May figures all exceeded the same months of the prior year, while June–August fell below. A verdict on the year will have to wait for the autumn foliage season.
ADR for All 47 Prefectures (August 2026, Year over Year)
The table lists estimated settled ADR by prefecture, sorted from highest to lowest for August 2026. Both months are finalized (actuals-based), and the listed price is shown alongside for reference.
Source: MetroEngines Research, compiled by HotelBank Editorial Team (August 2026 vs August 2025, estimated settled ADR basis)
| # | Prefecture | ADR Aug 2026 | ADR Aug 2025 |
YoY | Listed price (all-plan avg.) | N |
|---|---|---|---|---|---|---|
| 1 | Shizuoka | ¥16,307 | ¥16,574 | -1.6% | ¥36,282 | 867 |
| 2 | Oita | ¥14,760 | ¥15,387 | -4.1% | ¥34,567 | 466 |
| 3 | Okinawa | ¥14,652 | ¥14,272 | +2.7% | ¥31,626 | 513 |
| 4 | Kanagawa | ¥14,478 | ¥15,648 | -7.5% | ¥36,032 | 578 |
| 5 | Hyogo | ¥13,932 | ¥14,348 | -2.9% | ¥38,860 | 544 |
| 6 | Nagano | ¥13,678 | ¥13,721 | -0.3% | ¥31,140 | 823 |
| 7 | Yamanashi | ¥13,610 | ¥14,070 | -3.3% | ¥35,897 | 298 |
| 8 | Mie | ¥13,354 | ¥12,894 | +3.6% | ¥30,639 | 355 |
| 9 | Gunma | ¥13,182 | ¥12,946 | +1.8% | ¥32,511 | 429 |
| 10 | Kyoto | ¥13,099 | ¥14,305 | -8.4% | ¥28,678 | 605 |
| 11 | Nara | ¥12,982 | ¥13,672 | -5.0% | ¥26,947 | 132 |
| 12 | Fukui | ¥12,700 | ¥13,058 | -2.7% | ¥28,674 | 220 |
| 13 | Gifu | ¥12,627 | ¥12,941 | -2.4% | ¥29,451 | 380 |
| 14 | Hokkaido | ¥12,230 | ¥12,888 | -5.1% | ¥29,585 | 960 |
| 15 | Tochigi | ¥11,900 | ¥12,470 | -4.6% | ¥29,711 | 409 |
| 16 | Tokyo | ¥11,810 | ¥13,009 | -9.2% | ¥21,799 | 1,140 |
| 17 | Wakayama | ¥11,770 | ¥11,998 | -1.9% | ¥27,520 | 220 |
| 18 | Aomori | ¥11,639 | ¥10,606 | +9.7% | ¥23,487 | 185 |
| 19 | Saga | ¥11,639 | ¥12,900 | -9.8% | ¥29,954 | 157 |
| 20 | Ishikawa | ¥11,614 | ¥12,730 | -8.8% | ¥29,549 | 244 |
| 21 | Niigata | ¥11,320 | ¥11,864 | -4.6% | ¥24,826 | 419 |
| 22 | Fukuoka | ¥11,308 | ¥11,548 | -2.1% | ¥23,711 | 476 |
| 23 | Shimane | ¥10,942 | ¥11,407 | -4.1% | ¥30,446 | 180 |
| 24 | Kumamoto | ¥10,834 | ¥11,410 | -5.0% | ¥26,401 | 404 |
| 25 | Chiba | ¥10,778 | ¥11,241 | -4.1% | ¥37,452 | 422 |
| 26 | Yamagata | ¥10,472 | ¥10,373 | +1.0% | ¥27,344 | 290 |
| 27 | Hiroshima | ¥10,431 | ¥9,993 | +4.4% | ¥22,693 | 300 |
| 28 | Miyagi | ¥10,421 | ¥10,599 | -1.7% | ¥26,269 | 298 |
| 29 | Shiga | ¥10,192 | ¥8,649 | +17.8% | ¥28,417 | 157 |
| 30 | Tottori | ¥10,078 | ¥10,116 | -0.4% | ¥23,453 | 150 |
| 31 | Okayama | ¥9,736 | ¥9,624 | +1.2% | ¥23,295 | 190 |
| 32 | Kochi | ¥9,390 | ¥9,109 | +3.1% | ¥22,502 | 120 |
| 33 | Akita | ¥9,330 | ¥9,363 | -0.4% | ¥22,457 | 173 |
| 34 | Osaka | ¥9,058 | ¥13,452 | -32.7% | ¥15,476 | 653 |
| 35 | Kagawa | ¥8,994 | ¥10,627 | -15.4% | ¥25,036 | 161 |
| 36 | Toyama | ¥8,876 | ¥8,464 | +4.9% | ¥25,482 | 168 |
| 37 | Yamaguchi | ¥8,573 | ¥8,765 | -2.2% | ¥21,025 | 198 |
| 38 | Aichi | ¥8,555 | ¥9,053 | -5.5% | ¥19,320 | 505 |
| 39 | Nagasaki | ¥8,279 | ¥8,538 | -3.0% | ¥20,161 | 258 |
| 40 | Iwate | ¥8,266 | ¥8,256 | +0.1% | ¥21,287 | 253 |
| 41 | Saitama | ¥7,984 | ¥8,166 | -2.2% | ¥15,956 | 213 |
| 42 | Fukushima | ¥7,968 | ¥8,007 | -0.5% | ¥22,501 | 444 |
| 43 | Tokushima | ¥7,849 | ¥7,334 | +7.0% | ¥18,356 | 141 |
| 44 | Ehime | ¥7,378 | ¥7,086 | +4.1% | ¥19,640 | 212 |
| 45 | Ibaraki | ¥7,042 | ¥7,005 | +0.5% | ¥15,940 | 315 |
| 46 | Kagoshima | ¥6,906 | ¥7,357 | -6.1% | ¥17,918 | 320 |
| 47 | Miyazaki | ¥6,674 | ¥6,897 | -3.2% | ¥16,608 | 167 |
Source: MetroEngines Research, compiled by HotelBank Editorial Team (ADR is estimated settled ADR, tax-exclusive equivalent; listed price is per room for 2 guests, tax included. N is the number of properties covered for estimated settled ADR; total N across 47 prefectures = 17,112 properties)
Nationally, declines outnumbered gains: of the 47 prefectures, 14 rose and 33 fell. The largest gain was Shiga at +17.8% (¥8,649→¥10,192), followed by Aomori at +9.7% (¥10,606→¥11,639). On the downside, Osaka’s −32.7% stands out, and it is explained by a structural factor — the payback from Expo-driven demand the year before. Excluding Osaka, declines were mostly within a few percent, so the market as a whole has not broken down.
By level, Shizuoka (¥16,307), Oita (¥14,760) and Okinawa (¥14,652) lead the table. August is peak season for hot-spring and resort properties, so prefectures with a high share of ryokan rank near the top — a seasonal pattern. The same table taken in November or February would look very different.
Before You Line Up the Numbers — Four Definitional Differences to Watch
When putting figures from multiple sources on a single page, four points must be checked or the comparison does not hold. In practice, most wrong conclusions trace back to one of them.
First, tax treatment. Settled ADR disclosed by listed hotel REITs is customarily shown excluding consumption tax, while OTA listed prices include tax. The estimated settled ADR in this article is calibrated against REIT actuals and is therefore a tax-exclusive equivalent; placing it next to listed prices (tax included) in the same article introduces a definitional gap of about 10%.
Second, per room or per person. OTA published prices are often shown per room for two guests, but ryokan-style plans frequently mix in per-person pricing. Averaging without aligning the two can distort results by a factor of roughly two.
Third, changes in the property sample. This is the most commonly overlooked issue in time-series work. In our listed-price series, for example, the number of Tokyo properties covered grew from 1,678 in August 2025 to 2,410 in August 2026. When coverage expands, averages move, so year-over-year changes calculated on a series whose sample has changed mix rate changes with coverage changes. For long-term comparisons, the standard approach is to use a series with a stable property count or to restrict the comparison to a common set of properties.
Fourth, mixing preliminary and confirmed figures. JTA statistics are revised in three stages: first preliminary, second preliminary and confirmed. Plotting preliminary and confirmed values on the same line creates breaks that do not exist in reality. Likewise, in our data, past months with finalized actuals and the current and future months estimated from today’s listed levels are on different bases, so growth rates spanning the two should be avoided. That is why this article stops at August 2026. We measured how large these revisions actually are by comparing 13 months of first and second preliminary releases: for full-year 2025, the year-over-year change of −0.8% at the preliminary stage became +0.3% in the confirmed figures, flipping the sign.
Summary
Researching past hotel rates is not about finding a single source; it comes down to choosing sources that match the granularity of the question. A practical rule: use JTA statistics for long-term trends in area demand and occupancy, REIT monthly disclosures to benchmark rate history for specific properties, and aggregated OTA listed prices for cross-sectional rate comparisons by area and segment.
On top of that, taking the time to align the four points — tax-inclusive vs tax-exclusive, per room vs per person, changes in the property sample, and preliminary vs confirmed — is what makes an analysis reproducible. Put the other way, as long as these four points are stated explicitly, even estimates can support decisions. Heading into budget season, it is well worth taking stock of your own comparison baselines.
Further Reading
- Japan Hotels 7.9% Cheaper in USD Than 2019 — But +38.3% in Yen
- Intra-Prefecture ADR Gaps 2026: Median 2.74x, Okinawa Widest at 5.86x
- Japan Hotel ADR Swings Up to 4.9x by Season: 633 Municipalities Ranked
References and Sources
■ Data sources
Estimated settled ADR and listed prices are from MetroEngines Research monthly aggregates (July 2019 – August 2026; total N across 47 prefectures = 17,112 properties as of August 2026). Public statistics are from the Japan Tourism Agency’s Overnight Travel Statistics Survey and e-Stat; REIT actuals are from Invincible Investment Corporation’s monthly operating results (July 2026, published August 25, 2026).
■ Estimation assumptions
Estimated settled ADR is a tax-exclusive-equivalent estimate calculated by applying segment-specific adjustment factors to the lowest-plan price each property publishes on OTAs and similar channels (per room, 2 guests per room, tax included). Area-level values are the median across covered properties. All year-over-year comparisons are between finalized months, with August 2026 as the latest finalized month. Listed price (all-plan average, tax included) is shown alongside as a metric separate from ADR.
■ Limitations
ADR in this article is an estimate and differs from each property’s actual transaction prices and accounting figures (median error of about 7% against property-level results disclosed by listed hotel REITs, 91 properties over the most recent 3 months). From March 2020 to April 2022, the unusual demand environment tends to push estimates above actual levels, making that period unsuitable as a base. The number of covered properties varies by year, so year-over-year changes on a series with a changed sample also reflect changes in coverage.
- Japan Tourism Agency, Overnight Travel Statistics Survey (宿泊旅行統計調査) (release schedule and published items; accessed September 19, 2026)
- e-Stat (Portal Site of Official Statistics of Japan), Overnight Travel Statistics Survey file list (coverage of the database-format API)
- Invincible Investment Corporation, Monthly Operating Results for July 2026 (published August 25, 2026, Japanese)
- MetroEngines Research — monthly aggregates of estimated settled ADR and listed prices (July 2019 – August 2026; total N across 47 prefectures = 17,112 properties as of August 2026)