

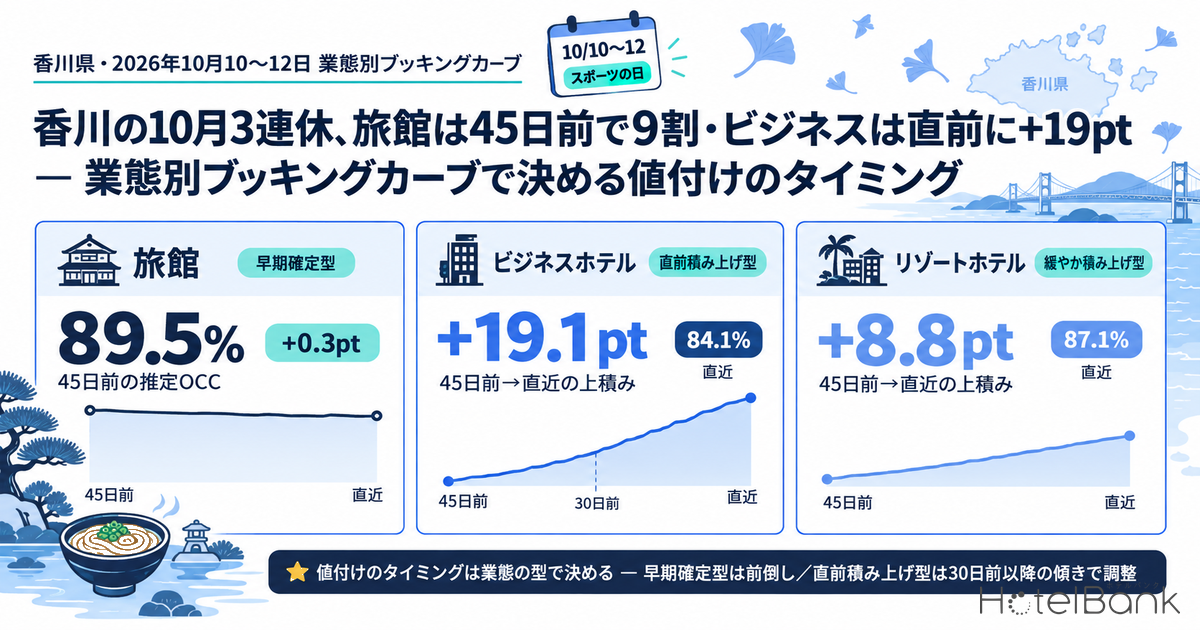
Tracking Kagawa Prefecture’s estimated OCC (based on OTA-listed inventory) by hotel category for the October 10–12, 2026 three-day weekend, which includes Sports Day (Monday, October 12), shows that the same holiday fills up on completely different timelines depending on the category. For ryokan (N=29 properties, 1,308 rooms), estimated OCC for the first night of the weekend, Saturday October 10, had already reached 89.5% 45 days before the stay date, and stood at 89.8% at the latest reading (18 days out) — a pickup of just +0.3pt. Business hotels (N=43 properties, 3,003 rooms), by contrast, built up +19.1pt, from 65.0% at 45 days out to 84.1% at the latest reading, with +9.0pt of that added after the 30-day mark alone. Resort hotels (N=11 properties, 474 rooms) sit in between at +8.8pt (78.3% → 87.1%). The last night of the weekend, October 12, drops sharply from the first night in all three categories, with business hotels at only 50.0% at the latest reading. This article uses these differences in slope to sort the categories into three types — “early-lock,” “late-build” and “gradual-build” — and lays out the decision points for moving rates.
About the data in this article | Coverage: Kagawa Prefecture business hotels N=43 properties (3,003 rooms), ryokan N=29 properties (1,308 rooms; N=28 properties / 1,302 rooms for the October 11 stay) and resort hotels N=11 properties (474 rooms). Prices in this article are estimated settled ADR (the settled price level estimated from OTA and other sales data, tax-exclusive equivalent); occupancy is an estimate based on OTA-listed inventory. Both are defined at the end of the article. Data as of: September 23, 2026.
- — Ryokan at 89.5% 45 days out: Estimated OCC for the October 10 stay (first night) was still 89.8% at the latest reading (18 days out), a pickup of only +0.3pt — an “early-lock” type.
- — Business hotels +19.1pt from 45 days out to the latest reading: They climbed from 65.0% to 84.1%, with +9.0pt coming after the 30-day mark. The pickup is larger than for business hotels in the four neighboring prefectures (Okayama, Hiroshima, Ehime, Kochi).
- — The October 12 last night is “a different day”: The estimated OCC gap versus the first night is 34.1pt for business hotels, 26.8pt for resorts and 11.1pt for ryokan. The sold-out property share for the October 12 stay is 4.7% for business hotels and 0.0% for resorts.
- — The 45-day level alone can misjudge which days are strong: Business hotels’ October 17 stay was at 72.0% 45 days out, higher than the first night of the holiday, but by 25 days out it was 68.1%, nearly 13pt below the holiday’s first night (81.0%).
- — The ryokan “early-lock” pattern is Kagawa’s shape this time: For the same October 10 stay, Okayama ryokan picked up +15.3pt, so it cannot be assumed to be a general property of ryokan that applies to other prefectures or to your own property.
Estimated OCC for the Three Nights — Snapshots at 45 Days Out, 30 Days Out and Latest
First, we line up estimated OCC (based on OTA-listed inventory) and the sold-out property share (the estimated share of properties whose listed inventory cannot be found on OTAs and other channels) for each stay date at three snapshots: 45 days out, 30 days out and latest. The latest snapshot was observed on September 22, 2026, which is 18 days before the October 10 stay, 19 days before the October 11 stay and 20 days before the October 12 stay. City hotels are excluded from the estimated OCC comparison because Kagawa has only 6 properties (578 rooms) in a fixed cohort that can be tracked as the same property set — fewer than 10.
| Category (N) | Stay date | 45 days out | 30 days out | Latest | Pickup (45 days out → latest) | Sold-out property share (45 days out → latest) |
|---|---|---|---|---|---|---|
| Business (43 properties, 3,003 rooms) | Oct 10 (Sat) | 65.0% | 75.1% | 84.1% | +19.1pt | 23.3%→44.2% |
| Business (43 properties, 3,003 rooms) | Oct 11 (Sun) | 47.5% | 62.6% | 65.7% | +18.2pt | 4.7%→9.3% |
| Business (43 properties, 3,003 rooms) | Oct 12 (Mon, holiday) | 38.8% | 46.6% | 50.0% | +11.2pt | 4.7%→4.7% |
| Ryokan (29 properties, 1,308 rooms) | Oct 10 (Sat) | 89.5% | 93.8% | 89.8% | +0.3pt | 31.0%→44.8% |
| Ryokan (28 properties, 1,302 rooms) | Oct 11 (Sun) | 81.6% | 86.4% | 82.0% | +0.4pt | 28.6%→25.0% |
| Ryokan (29 properties, 1,308 rooms) | Oct 12 (Mon, holiday) | 72.0% | 76.8% | 78.7% | +6.7pt | 13.8%→20.7% |
| Resort (11 properties, 474 rooms) | Oct 10 (Sat) | 78.3% | 83.8% | 87.1% | +8.8pt | 27.3%→36.4% |
| Resort (11 properties, 474 rooms) | Oct 11 (Sun) | 69.8% | 71.5% | 74.7% | +4.9pt | 18.2%→9.1% |
| Resort (11 properties, 474 rooms) | Oct 12 (Mon, holiday) | 57.6% | 60.3% | 60.3% | +2.7pt | 0.0%→0.0% |
Source: Compiled by HotelBank Editorial Team from MetroEngines Research
What the three categories have in common is the ordering: the first night (October 10 stay) is the highest and the last night (October 12 stay) is the lowest. The night of the 12th is the “going-home” night of the holiday, since the following day, Tuesday the 13th, is a regular weekday. At the latest snapshot, the gap between the first and last nights is 34.1pt for business hotels (84.1% → 50.0%), 26.8pt for resorts (87.1% → 60.3%) and 11.1pt for ryokan (89.8% → 78.7%) — the ryokan drop-off is the smallest.
By sold-out property share, for the first night (October 10 stay) 44.2% of business hotels, 44.8% of ryokan and 36.4% of resorts have no listed inventory visible on OTAs and other channels. For the October 12 stay, by contrast, the share is 4.7% for business hotels and 0.0% for resorts, meaning almost every property still has rooms to sell. For Kagawa as a whole (all categories, N=203 properties, 5,825 rooms), the October 10 stay shows estimated OCC of 86.1% and a sold-out property share of 61.6% at the latest reading: holiday demand is concentrated on the first night.
Three Types Defined by the Slope of the Curve
Next, we overlay the booking curves by category for the first night of the holiday, the October 10 stay. The horizontal axis is days remaining until the stay date (45 days out → latest); the further right, the closer to the stay date.
Source: Compiled by HotelBank Editorial Team from MetroEngines Research
The difference in shape is clear.
Ryokan are “early-lock.” The October 10 stay had already reached 89.5% at 45 days out, peaked at 94.0% at 33 days out, and then fell 4.0pt from 93.8% at 30 days out to 89.8% at the latest reading. The post-peak decline appears to reflect listed inventory coming back through cancellations or additional allotments. The October 11 stay was also nearly flat, from 81.6% at 45 days out to 82.0% at the latest reading, so for the first two nights of the holiday the level was largely set by 45 days out. In other words, most ryokan bookings came in earlier than 45 days out.
Business hotels are “late-build.” The October 10 stay went from 65.0% at 45 days out to 75.1% at 30 days out (+10.1pt) and then to 84.1% at the latest reading (+9.0pt), continuing to build after the 30-day mark at roughly the same pace as in the first half. Including the October 11 stay (+18.2pt) and the October 12 stay (+11.2pt), business hotels are the only category with a pickup of 10pt or more on all three nights.
Resort hotels are “gradual-build.” The October 10 stay picked up +8.8pt (+5.5pt from 45 to 30 days out, +3.3pt from 30 days out to the latest reading). The build continues, but at only about half the pace of business hotels. The October 12 stay was 60.3% at both 30 days out and the latest reading, so movement has stalled since the 30-day mark.
Source: Compiled by HotelBank Editorial Team from MetroEngines Research
Laying out the pickup by stay date shows, in addition to the difference in type, the variation within the holiday. For ryokan, the first two nights are close to 0pt, while the last night (October 12 stay) is +6.7pt, the largest of the three. The first half fills early and bookings flow into the last night, where rooms remain, later on — so for ryokan the last night alone is the day that moves close to arrival.
Does the 45-Day Level Reflect the Holiday’s Strength? — Comparison with the Surrounding Saturdays
We compare the strength of the holiday’s first night with the Saturdays before and after it (the October 3 and October 17 stays) at the same number of days remaining (25 days out). Because the comparison uses the same property set, it can be read as a relative comparison within each category.
| Category (N) | Oct 3 (Sat) | Oct 10 (Sat, first night of holiday) | Oct 17 (Sat) |
|---|---|---|---|
| Business (43 properties) | 60.2% | 81.0% | 68.1% |
| Ryokan (28–29 properties) | 76.5% | 91.9% | 81.6% |
| Resort (11 properties) | 60.1% | 84.8% | 71.3% |
All figures are estimated OCC (based on OTA-listed inventory) 25 days before the stay date. Ryokan for the Oct 3 and Oct 10 stays: 29 properties, 1,308 rooms; Oct 17 stay: 28 properties, 1,300 rooms.
Source: Compiled by HotelBank Editorial Team from MetroEngines Research
At 25 days out, the first night of the holiday is more than 10pt above the surrounding Saturdays in all three categories. The notable case is business hotels’ October 17 stay: at 45 days out it was 72.0%, higher than the holiday’s first night (65.0%), but by 25 days out it had slipped to 68.1%, nearly 13pt behind the holiday’s first night at the same point (81.0%). Judging the relative strength of each day on the 45-day level alone can mislead in late-build categories. For business hotels, pricing is better reviewed on the slope after the 30-day mark than on the 45-day number. More generally, reading a stay date at three checkpoints — 45 days out, 30 days out and last-minute — is enough to classify its character.
Compared with Four Neighboring Prefectures — How General Are Kagawa’s “Types”?
To check whether the three types seen so far are specific to Kagawa or common to each category, we line up the same October 10 stay for business hotels and ryokan in four neighboring prefectures in the Chugoku and Shikoku regions (Okayama, Hiroshima, Ehime, Kochi) at the same three snapshots (45 days out, 30 days out and the latest reading observed on September 22, 2026). Resort hotels are excluded from the comparison because none of the four prefectures has a fixed cohort of 10 or more properties that can be tracked as the same property set.
| Category | Prefecture (N) | 45 days out | 30 days out | Latest | Pickup (45 days out → latest) | Of which 30 days out → latest | Oct 12 stay (latest) | First vs. last night gap (latest) |
|---|---|---|---|---|---|---|---|---|
| Business | Kagawa (43 properties, 3,003 rooms) | 65.0% | 75.1% | 84.1% | +19.1pt | +9.0pt | 50.0% | 34.1pt |
| Business | Okayama (49 properties, 6,137 rooms) | 73.0% | 78.8% | 84.3% | +11.3pt | +5.5pt | 58.8% | 25.5pt |
| Business | Hiroshima (99 properties, 11,528 rooms) | 72.5% | 81.0% | 86.8% | +14.3pt | +5.8pt | 60.8% | 26.0pt |
| Business | Ehime (54 properties, 5,755 rooms) | 78.4% | 81.7% | 89.4% | +11.0pt | +7.7pt | 62.4% | 27.0pt |
| Business | Kochi (32 properties, 3,235 rooms) | 96.0% | 98.5% | 99.4% | +3.4pt | +0.9pt | 65.7% | 33.7pt |
| Ryokan | Kagawa (29 properties, 1,308 rooms) | 89.5% | 93.8% | 89.8% | +0.3pt | −4.0pt | 78.7% | 11.1pt |
| Ryokan | Okayama (37 properties, 796 rooms) | 73.9% | 81.5% | 89.2% | +15.3pt | +7.7pt | 50.9% | 38.3pt |
| Ryokan | Hiroshima (45 properties, 1,134 rooms) | 89.3% | 94.4% | 95.5% | +6.2pt | +1.1pt | 69.0% | 26.5pt |
| Ryokan | Ehime (50 properties, 1,523 rooms) | 94.7% | 98.5% | 99.3% | +4.6pt | +0.8pt | 80.9% | 18.4pt |
| Ryokan | Kochi (27 properties, 766 rooms) | 93.9% | 99.3% | 97.7% | +3.8pt | −1.6pt | 68.7% | 29.0pt |
All figures are estimated OCC (based on OTA-listed inventory) for the Saturday, October 10, 2026 stay. “Oct 12 stay” is the latest value for the Monday, October 12, 2026 (holiday) stay in the same prefecture and category. Property and room counts refer to the October 10 stay cohort; Okayama ryokan at 45 days out: 36 properties, 761 rooms; Ehime ryokan at 30 days out: 49 properties; Hiroshima ryokan for the Oct 12 stay: 44 properties, 1,124 rooms; Okayama business hotels for the Oct 12 stay: 48 properties, 6,038 rooms; Ehime ryokan for the Oct 12 stay: 51 properties, 1,538 rooms.
Source: Compiled by HotelBank Editorial Team from MetroEngines Research
Among business hotels, Kagawa’s “late build” is the strongest of the five prefectures. Kagawa’s 65.0% at 45 days out is the lowest of the five, yet its latest reading of 84.1% has caught up to roughly the same level as Okayama (84.3%). Both the +19.1pt pickup from 45 days out to the latest reading and the +9.0pt after the 30-day mark are the largest of the five prefectures. Kochi, conversely, was already at 96.0% at 45 days out, leaving little inventory to move close to arrival. Even within business hotels, Kagawa is a market that “fills later” than its neighbors, making it relatively more worthwhile to revisit prices after the 30-day mark.
The ryokan “early-lock” pattern cannot be called a general property of ryokan. Okayama ryokan climbed +15.3pt, from 73.9% at 45 days out to 89.2% at the latest reading, and added +7.7pt even after the 30-day mark — a shape closer to late-build. Ryokan in Hiroshima, Ehime and Kochi had reached around 90% by 45 days out and picked up little, but even so, only Kagawa (−4.0pt) and Kochi (−1.6pt) saw estimated OCC fall after the 30-day mark. The shape seen in Kagawa’s ryokan reflects how bookings came in for Kagawa this time. Ryokan operators should confirm their type from their own curves for past holidays before deciding whether to bring pricing decisions forward.
The drop-off within the holiday is smallest for Kagawa ryokan among the five prefectures. The estimated OCC gap between the first and last nights (latest) is 11.1pt for Kagawa ryokan, below ryokan in the other four prefectures (18.4–38.3pt). For business hotels, Kagawa’s 34.1pt is the largest of the five, followed by Kochi (33.7pt). Compared with neighboring prefectures, the contrast in Kagawa — ryokan staying relatively full through the last night, business hotels dropping off sharply on the last night — becomes even clearer.
October Price Levels by Estimated Settled ADR
We check prices using estimated settled ADR (tax-exclusive equivalent, monthly). First, the trend for business hotels, the category with the largest N, is shown with January–December overlaid by year (September 2026 onward is an estimate based on current sales).
Source: Compiled by HotelBank Editorial Team from MetroEngines Research
| Category | October 2024 (final) | October 2025 (final) | YoY (final months) | October 2026 (current estimate) |
|---|---|---|---|---|
| Business hotels | ¥6,258 (N=85) | ¥7,482 (N=83) | +19.6% | ¥9,484 (N=87) |
| Ryokan | ¥8,479 (N=46) | ¥13,362 (N=40) | +57.6% | ¥13,368 (N=41) |
| Resort hotels | ¥13,484 (N=11) | ¥14,270 (N=12) | +5.8% | ¥15,106 (N=13) |
October 2026 is an estimate based on current sales and may change. A direct comparison with last year’s final figure should wait until the month is finalized at month-end.
Source: Compiled by HotelBank Editorial Team from MetroEngines Research
Comparing finalized months year on year, October 2025 exceeded October 2024 in all three categories, with ryokan up a particularly large +57.6%. October 3 to November 9, 2025 was the autumn session of the Setouchi Triennale 2025 (total attendance across the three sessions: 1,084,128), so last October’s level includes that demand. Even in October 2026, with no Triennale, the current estimates stand at roughly ¥13,400 for ryokan, ¥9,500 for business hotels and ¥15,100 for resorts. Note, however, that these are monthly figures and do not represent prices for the three holiday nights alone.
For Revenue Managers at Business Hotels, Ryokan and Resorts in Kagawa — Implications and Action Plan
1. Even for the same holiday, “when to set the price” differs by category. For the first half of the holiday, ryokan estimated OCC had already reached 80–90% by 45 days out, with almost no further pickup. For ryokan, holiday prices are therefore effectively determined earlier than that — by the rates set when sales open. Business hotels, on the other hand, added +9.0pt even after the 30-day mark, leaving room to adjust prices right up to arrival.
2. Compare the market curve and your own booking pace at “the same days remaining.” Seeing where your own occupancy for the October 10 stay sits against the market at the same days remaining (for business hotels, 75.1% at 30 days out and 84.1% at the latest reading) gives a clue as to whether your price is high or low relative to the market. Days when the sold-out property share exceeds 40% are situations in which demand spilling over from sold-out properties nearby tends to flow to the remaining properties.
3. Treat the last night as “a different day.” The October 12 stay is far below the first night in all three categories, and there are almost no sold-out properties among business hotels and resorts. Rather than applying the first night’s pricing logic to the last night, there is room to create demand with multi-night or last-night products. For ryokan, only the last night moves close to arrival (+6.7pt), so that is the night to watch until the last minute.
4. Don’t judge a day’s strength on the 45-day number alone. As with business hotels’ October 17 stay, some days look strong at 45 days out but fail to grow afterward. In late-build categories, the slope after the 30-day mark is central to the decision.
| Timing | Action | Decision trigger (figures in this article) | Aim |
|---|---|---|---|
| This week (about two and a half weeks before the holiday) | Business: consider holding or raising the rate for the Oct 10 stay | Your Oct 10 stay is at or above the market’s latest 84.1%, or you still have rooms while 44.2% of nearby properties are sold out | Capture the late demand that added +9.0pt even after the 30-day mark |
| This week | Ryokan: check resale of returned inventory for the Oct 10 and 11 stays | The market’s Oct 10 stay has slipped back from 93.8% at 30 days out to 89.8% at the latest reading | Sell through inventory returned by cancellations to the end |
| This week to next week | All categories: design multi-night and last-night products for the Oct 12 stay | The market for the Oct 12 stay is at 50.0% for business hotels and 60.3% for resorts, with a sold-out property share of almost 0% | Lift occupancy on the low-demand last night |
| Next week (about 10 days before the holiday) | Resort: re-check rates for the Oct 11 and 12 stays | Pickup from 30 days out to the latest reading for the Oct 12 stay is 0pt (flat at 60.3%) | Act early on days where movement has stalled |
| After the holiday | Compare your October rate against the market’s estimated settled ADR | October estimated settled ADR (current): business hotels ¥9,484, ryokan ¥13,368, resorts ¥15,106 | Set a price-band benchmark for the next holiday and peak dates |
| Toward the next holiday (e.g., November 21–23) | Ryokan set prices before 45 days out; business hotels review twice, at 30 days out and last-minute | Ryokan’s first two nights picked up +0.3–0.4pt from 45 days out; business hotels around +18pt | Time price revisions to match each category’s type |
All of the above are guidelines based on market-wide estimates and should be weighed together with your own booking status, room mix and sales channels.
Summary — Three Yardsticks for Holiday Pricing
| Yardstick | Figure to watch | Kagawa, October 2026 three-day weekend |
|---|---|---|
| 1. Curve type | Pickup from 45 days out to latest | Ryokan +0.3pt (early-lock) / Resort +8.8pt (gradual-build) / Business +19.1pt (late-build) *all for the Oct 10 stay |
| 2. Drop-off within the holiday | Estimated OCC gap between first and last nights (latest) | Business 34.1pt / Resort 26.8pt / Ryokan 11.1pt |
| 3. Demand tightness | Sold-out property share (latest) | Oct 10 stay: business 44.2%, ryokan 44.8%, resort 36.4%; Oct 12 stay: business 4.7%, resort 0.0% |
If the type is “early-lock,” bring pricing forward; if it is “late-build,” adjust while watching the slope after the 30-day mark. Within a holiday, treat the first and last nights as different days, and on days with a high sold-out property share, price on the assumption that demand will spill over from surrounding properties. These three yardsticks can be applied as-is to the next three-day weekend and to the year-end and New Year holidays.
Frequently Asked Questions
Q. What is estimated OCC? Is it the same as actual room occupancy?
Estimated OCC is an estimate based on OTA-listed inventory, calculated as “100 − 100 × OTA-listed rooms remaining ÷ total rooms.” We build a fixed cohort of properties that list at least 30% of their total rooms on OTAs and track the same property set for each stay date. Because rooms not listed are counted as already sold, it runs higher than actual room occupancy.
Q. When should ryokan set their holiday prices?
For Kagawa ryokan, estimated OCC for the first half of the holiday (the October 10 and 11 stays) had already reached 81.6–89.5% by 45 days out, and the pickup to the latest reading was only +0.3–0.4pt. With this shape, prices are essentially determined by the rates set when sales open. However, Okayama ryokan picked up +15.3pt for the same October 10 stay, so not every ryokan fills early. The safest approach is to confirm your type from your own curves for past holidays before deciding to bring pricing forward.
Q. Do business hotels have room to adjust prices up to the last minute?
For the October 10 stay, Kagawa business hotels added +9.0pt, from 75.1% at 30 days out to 84.1% at the latest reading, and the sold-out property share rose to 44.2%. The pickup is larger than for business hotels in the four neighboring prefectures, making this a market with room to revisit prices until the last minute. One way to use this is to compare your own occupancy against the market value at the same days remaining, and consider holding or raising rates if you are above it.
Q. How should the last night of the holiday (the October 12 stay) be sold?
Estimated OCC for the October 12 stay (latest) is 50.0% for business hotels, 60.3% for resorts and 78.7% for ryokan — all well below the first night. The sold-out property share is also just 4.7% for business hotels and 0.0% for resorts, so almost every property still has rooms to sell. Rather than pricing it the same way as the first night, it is better treated as a day to create demand with multi-night or last-night products.
Q. Is estimated settled ADR for October 2026 higher than last year?
The current estimates of settled ADR for October 2026 are ¥13,368 for ryokan, ¥9,484 for business hotels and ¥15,106 for resorts. A comparison with the finalized October 2025 figures (ryokan ¥13,362, business hotels ¥7,482, resorts ¥14,270) needs to wait until the month is finalized. Note also that October 2025 included the autumn session of the Setouchi Triennale 2025. All of these are monthly figures, not prices for the three holiday nights alone.
About the Data
| Estimated OCC | Occupancy based on OTA-listed inventory = 100 − 100 × OTA-listed rooms remaining ÷ total rooms. Coverage is a fixed cohort of properties that list at least 30% of their total rooms on OTAs (the same property set for each stay date; the number of properties is shown as N). It is an estimate based on the absorption of inventory sold on OTAs and is defined differently from actual room occupancy (it runs higher because unlisted rooms are counted as sold). |
| Booking curve | Based on observations from 45 days before the stay date to the latest reading. Covers the October 3, 10, 11, 12 and 17, 2026 stay dates (the comparison with four neighboring prefectures covers the October 10 and 12 stays). The latest reading was observed on September 22, 2026. |
| Sold-out property share | The estimated share of properties whose listed inventory cannot be found on OTAs and other channels. |
| Estimated settled ADR | The settled price level (tax-exclusive equivalent) estimated from OTA and other sales data (lowest-plan level × category-specific coefficient, ensembled across multiple channels). Past months are final values; current and future months are estimates based on current sales. Median error of 6.6% against published operating results. |
| Coverage (N) | Estimated OCC: Kagawa business hotels 43 properties (3,003 rooms), ryokan 29 properties (1,308 rooms; 28 properties / 1,302 rooms for the Oct 11 stay and 28 properties / 1,300 rooms for the Oct 17 stay), resort hotels 11 properties (474 rooms), all categories 203–205 properties (5,819–5,829 rooms). City hotels (6 properties, 578 rooms) are excluded as fewer than 10. Comparison with four neighboring prefectures: property and room counts for each prefecture and category are shown in the table. Estimated settled ADR: the number of properties for each month is shown as N= in the table. |
| Data as of | September 23, 2026. Sales status and inventory change daily, so the figures in this article are a snapshot as of the time of retrieval. |
References and Sources
■ Data sources
Daily observations of OTA-listed inventory and prices collected by MetroEngines Research (Kagawa and the four neighboring prefectures [Okayama, Hiroshima, Ehime, Kochi]; stay dates October 3, 10, 11, 12 and 17, 2026; observations from 45 days before each stay date through September 22, 2026), and monthly estimated settled ADR by category for Kagawa based on the same data (January 2024 – February 2027). National holidays are per the Cabinet Office; Triennale attendance is per figures published by the Setouchi Triennale Executive Committee.
■ Calculation assumptions
Estimated OCC = 100 − 100 × OTA-listed rooms remaining ÷ total rooms. A fixed cohort is built from properties that list at least 30% of their total rooms on OTAs, and the same property set is tracked for each stay date. Segments with a fixed cohort of fewer than 10 properties (Kagawa city hotels at 6 properties; resort hotels in the four neighboring prefectures) are excluded from the comparison. The sold-out property share is the share of properties whose listed inventory cannot be found on OTAs and other channels. Estimated settled ADR is a tax-exclusive-equivalent estimate based on lowest-plan level × category-specific coefficient; past months are final values, and September 2026 onward are estimates based on current sales.
■ Limitations and caveats
Estimated OCC is based on OTA-listed inventory and runs higher than actual room occupancy because unlisted rooms are counted as sold. Post-peak declines can also result from cancellations or added allotments and do not necessarily indicate weaker demand. The comparison with the four neighboring prefectures is a cross-sectional comparison on the same observation dates and does not adjust for differences in each prefecture’s guest mix or property composition. October 2026 estimated settled ADR may change until the month is finalized, and as a monthly figure it is not the price for the three holiday nights alone.