

Restarting a nuclear power plant involves a long construction phase after regulatory approval and local consent: seawalls, emergency equipment installation, and, once the reactor is running again, periodic inspections that come around every 13 months. Each of these phases brings hundreds to a thousand engineers and workers on site for months at a time, and every one of them has to sleep somewhere. This article measures how many hotel rooms are actually on sale within a 10km radius of each of Japan’s 15 nuclear power plant sites, and organises that supply structure as input for location assessment.
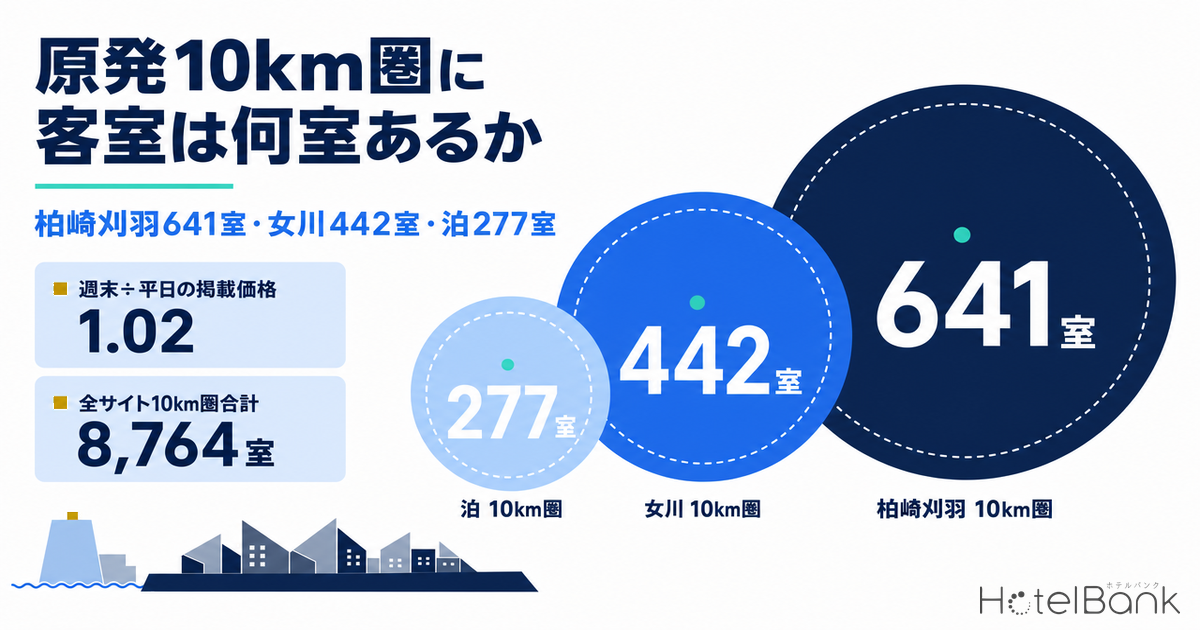
The conclusion first. Within 10km of Kashiwazaki-Kariwa we confirmed 641 rooms across 15 properties on sale; Onagawa has 442 rooms across 8 properties, and Tomari 277 rooms across 12 properties. But what matters for an investment decision is not the total. It is two things: when those rooms were built, and how much back-up supply sits within 20km. Those two differences explain why prices move in opposite directions in markets that receive the same kind of business demand.
Metric Definitions Used in This Article
- ADR (Average Daily Rate) = estimated settled rate (tax-exclusive equivalent), calculated by applying a segment-specific correction factor to each property’s lowest published plan rate (per room, 2 guests, tax-inclusive). Checked against property-level results disclosed by listed hotel REITs (91 properties, most recent 3 months), the median error is about 7%. These are estimates and differ from each property’s actual settled prices and accounting figures. Area-level ADR is the median of the properties covered (the level of a typical property in the area).
- Listed price = rate per room for 2 guests (tax-inclusive). Day-of-week comparisons use the all-plan average listed price, labelled separately from estimated settled ADR.
- OCC (Occupancy) = rooms sold as a share of total rooms in the area (an estimate based on OTA sales inventory; consistency checks against REIT monthly disclosures show accuracy within a few points). In this article it is used only as a prefecture-level macro indicator.
- Room-count scope = the sum of rooms at properties with confirmed sales since March 2026, out of the roughly 168,000 properties in Japan tracked by MetroEngines Research. Ryokan, minshuku and simple lodgings not listed on major booking sites, and company dormitories or worker housing leased directly by the plant operators, are not included.
- 10km / 20km radius = straight-line distance (concentric circles) from a representative point on the plant site. These do not coincide with municipal boundaries.
This article deals only with supply-side facts: lodging demand and room stock. It does not address plant safety or whether reactors should restart.
- — 292 properties and 8,764 rooms across the 15 sites. What sets 10km room volume is not the plant but whether an existing town lies within range: the gap between the largest (Shimane, 2,159 rooms) and the smallest (Higashidori, 1 room) exceeds 2,000×.
- — Kashiwazaki-Kariwa 641 rooms, Onagawa 442, Tomari 277. What matters for investment is not the total but two things: when the rooms were built, and how much back-up supply sits within 20km.
- — Building vintage splits the sites into three types. In Kashiwazaki, 79% of the 583 rooms with a known opening year date from 1999 or earlier; in Onagawa 88% date from 2010 or later; in Tomari, 33 rooms were added in December 2025 in step with the construction schedule.
- — Thin back-up supply shows up in price. In Iwanai, where the 20km circle adds only 1.45×, median estimated ADR rose from ¥6,600 to ¥8,300 (+25%) over 15 months; Onagawa, at 3.50×, held flat at ¥5,800–6,800.
- — Weekend ÷ weekday: Kashiwazaki 1.02, Onagawa 1.03, Tomari 0.94. This is a different kind of demand from Echigo-Yuzawa’s 1.18, and the band of 40–100 rooms × estimated ADR ¥8,000–12,000 is almost empty.
Room Stock Within 10km of 15 Sites — 8,764 Rooms in Total, the Smallest Just 1
Start with the big picture. For each of Japan’s 15 nuclear power plant sites, we extracted lodging properties within a 10km radius of a representative point on the site and summed the rooms at those with recently confirmed sales. The total is 292 properties and 8,764 rooms. But the gap between sites is large: the largest, Shimane (2,159 rooms), and the smallest, Higashidori (1 room), differ by more than 2,000×.
The main driver of that gap is not the plant but whether a city falls inside the 10km circle. Shimane Nuclear Power Station lies within 10km of central Matsue, so the prefectural capital’s business hotels are counted in full. Tsuruga (1,730 rooms) likewise includes the lodging cluster in front of Tsuruga Station. Conversely, at sites such as Higashidori, Ikata and Sendai, where the 10km circle stays within farming and fishing communities, there are almost no rooms. In other words, the relationship is not “hotels get built near nuclear plants” but “was there a town there to begin with”.
| Site | Prefecture | Properties | Rooms | Largest property | Est. ADR | Construction / operating status |
|---|---|---|---|---|---|---|
| Shimane | Shimane | 48 | 2,159 | 199 | ¥11,322 | Unit 2 operating; Unit 3 in preparation |
| Tsuruga | Fukui | 36 | 1,730 | 199 | ¥7,521 | Under review |
| Hamaoka | Shizuoka | 26 | 951 | 181 | ¥5,938 | Under review |
| Tokai No. 2 | Ibaraki | 30 | 705 | 91 | ¥7,278 | Safety upgrade works under way |
| Kashiwazaki-Kariwa | Niigata | 15 | 641 | 169 | ¥7,462 | Unit 6 entered commercial operation in April 2026 |
| Takahama | Fukui | 25 | 517 | 219 | ¥8,410 | Units 3 & 4 operating |
| Onagawa | Miyagi | 8 | 442 | 204 | ¥6,152 | Unit 2 operating; Unit 3 preparing for review |
| Shika | Ishikawa | 23 | 417 | 234 | ¥6,151 | Under review |
| Ohi | Fukui | 23 | 352 | 80 | ¥8,460 | Units 3 & 4 operating |
| Tomari | Hokkaido | 12 | 277 | 64 | ¥8,362 | Unit 3 seawall under construction |
| Genkai | Saga | 21 | 247 | 44 | ¥19,960 | Units 3 & 4 operating |
| Mihama | Fukui | 15 | 177 | 21 | ¥11,503 | Unit 3 operating |
| Sendai | Kagoshima | 7 | 110 | 34 | ¥5,934 | Units 1 & 2 operating |
| Ikata | Ehime | 2 | 38 | 26 | ¥8,233 | Unit 3 operating |
| Higashidori | Aomori | 1 | 1 | 1 | — | Safety upgrade works under way |
If you use this table for investment decisions, look less at the “Rooms” column itself and more at how rooms relate to the largest property. Onagawa’s largest property holds 204 of its 442 rooms, for example, and at Shika one building accounts for 234 of 417. In markets heavily dependent on a single property, local capacity runs out the moment that one building fills. By contrast, in a market of dispersed small properties such as Tokai No. 2 (705 rooms, largest 91), the “sell-out wall” arrives gradually even though the total is only mid-sized.
The Demand Signature — Near Nuclear Plants, Weekdays and Weekends Cost the Same
Total room count alone cannot tell you what kind of demand a market runs on. Day-of-week pricing can. In leisure-driven markets Saturday rates sit well above weekdays, but in markets driven by business demand, demand concentrates on weekdays and the weekend premium disappears.
For the 92 days from June 1 to August 31, 2026 (66 weekdays, 26 weekend days), we took the daily average listed price (2 guests per room, tax-inclusive) at the main properties in each area and compared the weekday and weekend medians. The result was clear. The four business-type properties within 10km of Kashiwazaki-Kariwa came out at weekend ÷ weekday = 1.02. The three within 10km of Onagawa: 1.03. The five within 10km of Tomari: 0.94, i.e. weekends were cheaper. By contrast, leisure markets in the same Niigata Prefecture came out at 1.18 (Echigo-Yuzawa) and 1.13 (Tsukioka Onsen), and Naruko Onsen in Miyagi at 1.08.
| Area | Properties | Weekday median | Weekend median | Weekend ÷ weekday |
|---|---|---|---|---|
| Kashiwazaki (Kashiwazaki-Kariwa 10km, business) | 4 | ¥11,825 | ¥12,074 | 1.02 |
| Onagawa / Ishinomaki (Onagawa 10km, business) | 3 | ¥11,617 | ¥11,968 | 1.03 |
| Around Tomari Village (Tomari 10km) | 5 | ¥30,362 | ¥28,519 | 0.94 |
| Naruko Onsen (Miyagi, leisure) | 12 | ¥44,008 | ¥47,740 | 1.08 |
| Tsukioka Onsen (Niigata, leisure) | 12 | ¥70,348 | ¥79,617 | 1.13 |
| Echigo-Yuzawa (Niigata, leisure) | 12 | ¥50,730 | ¥59,901 | 1.18 |
That 1.02 and 1.18 sit side by side within one prefecture shows that Kashiwazaki’s lodging market runs on a construction calendar, not a tourism calendar. Operationally this is an easy trait to work with: there is no need to staff up for weekend peaks or design premium weekend plans, because occupancy is levelled from the start. On the other hand, the structural room to raise weekend rates is small, so revenue comes down almost entirely to how thickly weekday occupancy can be stacked.
The macro occupancy environment is worth checking too. By our estimates, business-hotel occupancy in June, July and August 2026 was 85.5%, 84.7% and 89.4% in Niigata (44 properties, 5,619 rooms), 87.1%, 89.7% and 92.3% in Miyagi (58 properties, 8,464 rooms), and 88.5%, 92.6% and 90.9% in Hokkaido (219 properties, 25,415 rooms). All are high, but there is still room to absorb new supply.
Three Types Split by Building Vintage — Kashiwazaki 79% Pre-2000, Onagawa 88% Post-2010
This is the core of the article. Even among towns hosting the same kind of restart construction, the period in which the room stock was built differs completely from site to site. Tallying rooms by decade, limited to properties with a known opening year, separates three clear types.
| Site | 10km total | Year known | 1989 or earlier | 1990s | 2000s | 2010s | 2020 or later | Share 1999 or earlier | Share 2010 or later |
|---|---|---|---|---|---|---|---|---|---|
| Kashiwazaki-Kariwa | 641 | 583 | 161 | 300 | 7 | 52 | 63 | 79% | 20% |
| Onagawa | 442 | 388 | 38 | 7 | 0 | 109 | 234 | 12% | 88% |
| Tomari | 277 | 259 | 101 | 0 | 10 | 81 | 67 | 39% | 57% |
| Tokai No. 2 | 705 | 680 | 126 | 57 | 86 | 204 | 207 | 27% | 60% |
| Tsuruga | 1,730 | 1,494 | 192 | 282 | 488 | 152 | 380 | 32% | 36% |
Type A Legacy-stock dependent (Kashiwazaki-Kariwa)
Of the 583 rooms with a known opening year, 461 (79%) date from 1999 or earlier. The three largest properties (169, 161 and 100 rooms = 430 rooms, 67% of the circle) all opened between 1988 and 1997, and no new supply of comparable scale has arrived in nearly 30 years since. The restart construction is effectively being housed by stock built up to the 1990s.
Type B Supply-ahead (Onagawa)
Of the 388 rooms with a known opening year, 343 (88%) date from 2010 or later, and 234 from 2020 or later. Rooms were rebuilt during recovery from the Great East Japan Earthquake, so capacity was in place before construction demand ramped up.
Type C Construction-synchronised (Tomari)
Of the 259 rooms with a known opening year, 148 (57%) date from 2010 or later. What stands out is the timing of additions: 33 rooms explicitly aimed at construction workers opened on December 17, 2025. Inventory is added in step with the construction schedule.
Here is Type C in concrete terms. At Tomari Unit 3, construction of a seawall 19m high, about 1,200m long and costing about ¥180bn began in March 2024. Hokkaido Electric Power passed the Nuclear Regulation Authority’s conformity review under the new regulatory standards in July 2025, and in December that year the Governor of Hokkaido consented to the restart. Winter blizzards and additional ground improvement have put the works about four months behind the original plan; the seawall is now expected to be completed around mid-August 2027, and Unit 3 to restart in summer 2027 or later.
In step with this schedule, a lodging facility for construction workers opened in Iwanai on December 17, 2025. All 33 rooms are private, each with a unit bath including a toilet, and the design assumes long stays. Its operator opened 7 new facilities in Hokkaido in FY2025, bringing the total of such facilities to 29. According to press reports, “80% of 2026 and 70% of 2027 are already booked”, suggesting bookings made with the construction schedule in view are running ahead. (Source: Hokkaido Shimbun, “Workman House lodging for construction workers opens in Iwanai; bookings strong ahead of Tomari restart”) It shows that supplying rooms to construction demand has become a stand-alone business format. How much of this format is accumulating elsewhere in Hokkaido is tracked, by openings, in Chitose & Tomakomai Worker Lodging — 7 New Hotels, 738 Rooms in 2026.
Onagawa (Type B) is also a market where capacity was deliberately put in place. The largest property in the circle, with 204 rooms, opened in April 2023. It was developed on leased town-owned land by a business cooperative formed by five local companies, including seafood businesses, with the stated aim from the outset of serving both construction workers and tourists and revitalising the town. (Source: Kahoku Shimpo, February 17, 2023; Japan Finance Corporation) Local businesses jointly taking on the lodging function is a useful model for making supply viable in a market too small to justify investment by a single operator.
Back-Up Supply Sets the Price — Within 20km, Onagawa Grows 3.5×, Tomari Only 1.45×
The 10km figures alone do not explain the market. Construction workers do not necessarily stay right in front of the plant; they commute from existing lodging clusters 20–30 minutes away by car. Widening the circle to 20km and re-tallying makes the difference in character between the three sites even sharper.
| Site | 10km properties | 10km rooms | 20km properties | 20km rooms | Increase | Multiple |
|---|---|---|---|---|---|---|
| Kashiwazaki-Kariwa | 15 | 641 | 25 | 1,002 | +361 | 1.56× |
| Onagawa | 8 | 442 | 34 | 1,545 | +1,103 | 3.50× |
| Tomari | 12 | 277 | 17 | 403 | +126 | 1.45× |
Onagawa swells from 442 rooms within 10km to 1,545 within 20km, 3.50×. That is because central Ishinomaki falls inside the 20km circle, and the added 1,103 rooms include properties of 198, 150 and 135 rooms. Kashiwazaki-Kariwa goes from 641 to 1,002 rooms, 1.56×; the area around the interchanges towards Nagaoka is added, but central Nagaoka lies outside the 20km circle. Tomari goes from 277 to 403 rooms, only 1.45×, still in the 400s even at 20km. There is almost no back-up supply.
This difference in back-up supply directly explains how prices behave. Below, our estimated settled ADR for three municipalities is plotted month by month, with years overlaid.
In Iwanai, estimated ADR held steady in a ¥6,500–7,000 range (median ¥6,600) for the nine months from September 2024 to May 2025. In the 15 months from June 2025, however, the median stepped up to ¥8,300, +25%, and in 14 of those 15 months it exceeded the previous high (¥7,000). This is a shift in level, not a one-month swing. Checking the two largest properties in the circle individually, the 64-room property moved from around ¥7,300 to ¥10,400–12,800 and the 37-room property from around ¥10,700 to ¥14,100–16,900, both shifting up over the same period. It reads as a market-wide change in level rather than one property’s price move. Note, however, that Iwanai’s monthly sample is thin at 4–7 properties: the change in level can be read with confidence, but its size should be interpreted with a margin.
Onagawa is the contrast. Onagawa Nuclear Power Station Unit 2 resumed commercial operation on December 26, 2024, and then entered a periodic operator inspection of about five months from January 14, 2026. The inspection was completed on May 11 and the reactor restarted, with operation planned to resume in early-to-mid June. A five-month inspection brings a considerable volume of business demand, yet Onagawa Town’s estimated ADR stayed almost flat: ¥6,300 in January 2026, ¥6,000 in February, ¥5,800 in March, ¥6,000 in April and ¥6,100 in May. With 1,545 rooms of back-up supply within 20km, and the 204-room property opened in 2023 inside the 10km circle, demand can be read as having been absorbed by inventory before it could pass through to price.
That said, the largest property in the circle, with 204 rooms, rose about 28% from ¥5,300 in December 2025 to ¥6,800 in January 2026, and held ¥6,100–6,800 throughout the inspection period. Even though the town-wide average did not move, the property at the centre of demand raised its prices appropriately — an example of meeting a demand upswing with rate.
Kashiwazaki City’s estimated ADR ranged from ¥7,200 to ¥9,700 through 2026. Since March it has stayed within a narrow ¥7,200–7,900 range, with no noticeable step around Unit 6 entering commercial operation on April 16, 2026. That was the first commercial operation at any TEPCO nuclear plant since the 2011 earthquake, and the first for that unit in 14 years.
Assessing Kashiwazaki as a Location — Land Prices Down 8 Years Running; Commercial Land at 400% FAR, 450m From the Station
Of the three types, Type A (legacy-stock dependent) offers the most room for new supply. Taking Kashiwazaki as the case, we check its location conditions against public data.
| Official land price (January 1, 2026) | ¥51,500/m² |
| Year-on-year | −3.4% |
| Zoning | Commercial district |
| Floor-area ratio / building coverage | 400% / 80% |
| Fire-prevention designation | Quasi-fire prevention district |
| Area classification | City planning area without urbanisation-control zoning |
| Nearest station | Kashiwazaki Station, 450m |
| Frontage road | Prefectural road, 18.0m |
The official land price of commercial land in front of Kashiwazaki Station fell from ¥64,900/m² in 2018 to ¥51,500/m² in 2026, declining for 8 straight years, −20.6% cumulatively. A residential reference point also fell from ¥23,800 to ¥18,200, −23.5%. Meanwhile one reference point in Onagawa Town has been completely flat at ¥30,400 since 2020, and another has not moved from ¥23,400 since 2022.
As a development premise, this land-price level is no barrier. Commercial land at ¥51,500/m² with a 400% floor-area ratio and 80% building coverage, 450m from the station and fronting an 18.0m-wide prefectural road, is a comfortably easy site for a limited-service hotel. Land acquisition is a far smaller share of total investment than in major cities. The key judgement shifts from whether a site can be secured to how many years demand will last.
To form that view, we look at the surrounding population and employment structure.
Resident population within 3km of Kashiwazaki Station fell from 48,314 in 2020 to an estimated 45,057 in 2025, and is projected at 37,849 in 2040 (−21.7% vs 2020). The age mix is 57.3% working-age and 32.3% elderly. The 3km area around Onagawa Station is declining faster still, from an estimated 4,973 in 2025 to 3,470 in 2040 (−37.6% vs 2020), with an elderly share of 36.2%.
On the employment side, 1,836 establishments and 15,908 employees are concentrated within 2km of Kashiwazaki Station (69 districts). But the share of office-type employees is only 9.0%. Onagawa has 158 establishments and 1,267 employees with an office share of 7.3%, and Iwanai 677 establishments and 4,259 employees at 5.8%. None of these is an office business-trip market; all have an on-site employment structure of manufacturing, construction and fisheries. This fits the flat day-of-week pricing seen earlier. Stays are tied to work processes rather than meetings or sales calls, so they are long and the weekend swing is small.
The nature of demand that follows is clear. In Kashiwazaki, Onagawa and Tomari alike, resident population will fall by 20–40% over the next 15 years. Baseline local demand (weddings and funerals, family visits, local corporate travel) is shrinking. Construction and periodic-inspection demand, on the other hand, arises from the project schedule regardless of demographics. In other words, lodging demand in these three markets follows the capital-investment schedule, not the size of the local economy. The indicator to reference in an investment decision is not catchment population but published construction plans and periodic-inspection cycles. This pattern of the construction process itself creating lodging demand is not limited to nuclear power: Data Center Construction Needs 364–725 Hotel Rooms per 50MW in Japan measured room stock in 13 municipalities and found the same shape.
A Framework for Entry — Where Are the Gaps in Size and Rate?
We plotted the properties with confirmed sales within 10km of the three sites on two axes: rooms and estimated ADR. Limited-service hotels targeting business demand generally aim for 40–150 rooms and an estimated ADR of ¥6,000–10,000.
Two things can be read from the plot. First, the three Kashiwazaki-Kariwa properties (169, 161 and 100 rooms) cluster at an estimated ADR of ¥7,100–7,700, and that band defines the going rate for business demand. Second, the zone of 40–100 rooms at an estimated ADR of ¥8,000–12,000 is almost empty. The only property in it is Tomari’s 64-room property, and as the previous section showed, it moved into that position after its rates stepped up from mid-2025. When construction demand is heavy, the lack of inventory in this band is what pushes rates up.
This gap can be read as room for mid-sized properties designed for long stays. As noted above, the employment structure is on-site work, and stays tend to run in weeks or months. Indeed, the property that opened near Tomari in December 2025 is built to long-stay spec, with all private rooms and unit baths including toilets, and is attracting bookings as a different product from the existing business-hotel stock.
How to Frame the Assessment for Each Type
| Item | Type A Kashiwazaki-Kariwa | Type B Onagawa | Type C Tomari |
|---|---|---|---|
| Rooms within 10km | 641 rooms / 15 properties | 442 rooms / 8 properties | 277 rooms / 12 properties |
| Rooms within 20km | 1,002 rooms (1.56×) | 1,545 rooms (3.50×) | 403 rooms (1.45×) |
| Share of rooms built 1999 or earlier | 79% | 12% | 39% |
| Top-3 property concentration | 67.1% | 72.2% | 48.4% |
| Weekend ÷ weekday listed price | 1.02 | 1.03 | 0.94 |
| Recent estimated ADR trend | Flat (¥7,200–7,900) | Flat (¥5,800–6,800) | Shifted up (¥8,200–10,400) |
| Population within 3km, change to 2040 (vs 2020) | −21.7% | −37.6% | (Iwanai area) |
| Room for new supply | Mid-size gap | Limited (already supplied) | Thin back-up supply |
For Type A, with the three existing properties converging on a ¥7,100–7,700 rate band, a design that targets the band above rather than competing within it is the consistent choice. The land is commercial-district zoning with a 400% floor-area ratio at ¥51,500/m², while construction cost per room for a limited-service hotel varies widely by format, so the scale of investment is set by the assumed building cost rather than by the land.
For Type B, capacity within 10km is already in place and there are 1,545 rooms of back-up supply within 20km. The central question is less new entry than an operational one: how existing properties capture long-stay demand.
For Type C, inventory is thin relative to demand and rates are rising, but building a permanent property in a market with only 403 rooms even within 20km depends heavily on the demand outlook after construction ends. Once operation resumes, from summer 2027 or later, construction demand will fall and give way to periodic-inspection demand. How to factor in that transition is the decisive question, and it is also why construction-synchronised facilities are the format being chosen.
Points to Note
| Issue | Detail |
|---|---|
| Schedule changes | Construction can be extended by weather or additional measures. The Tomari Unit 3 seawall slipped about four months from the original plan because of winter blizzards and additional ground improvement. The start and end of demand should be viewed as a range. |
| Inventory not counted | Room counts in this article are limited to properties listed on major booking sites. Company dormitories and worker housing leased directly by operators, and properties not sold to the general public, are not included. Actual accommodation capacity is larger than the figures here. |
| Single-property dependence | The top three properties account for 72.2% in Onagawa and 67.1% in Kashiwazaki-Kariwa. Because one building’s occupancy determines local capacity, the unit of competitive analysis is “a specific handful of properties” rather than “the area”. |
| Shrinking baseline demand | Resident population within 3km is projected to change by −21.7% in Kashiwazaki and −37.6% in Onagawa by 2040 (both vs 2020). The local demand that would carry periods without construction work is shrinking. |
| Sample depth | Monthly estimated ADR is based on 4–7 properties in Iwanai and 3–4 in Onagawa. The direction of the level can be read, but the precision of the size of change is limited. |
Sensitivity of Entering the Gap — How Far Room Revenue Moves With Estimated ADR and Occupancy
If new supply were placed in the gap identified in the previous section (40–100 rooms, estimated ADR ¥8,000–12,000), what range would room revenue fall in? We check with an illustrative case. The following is an illustrative 60-room limited-service hotel assuming Type A (Kashiwazaki-Kariwa); it is not a revenue projection for any specific business plan. Construction costs, land costs, operating costs, financing costs and taxes are excluded; only room revenue is covered.
| Scenario | Est. ADR (assumed) | Occupancy (assumed) | RevPAR | Annual room revenue |
|---|---|---|---|---|
| Downside | ¥8,000 | 70% | ¥5,600 | ¥123M |
| Base | ¥9,500 | 80% | ¥7,600 | ¥166M |
| Upside | ¥11,000 | 88% | ¥9,680 | ¥212M |
In the base case (estimated ADR ¥9,500, occupancy (assumed) 80%), annual room revenue is about ¥166M, and the gap between the downside and upside cases is about ¥90M. Competing in the ¥7,100–7,700 estimated-ADR band where the three existing properties cluster would pull results towards the low end of the downside case, so whether a property can position itself in the gap makes a large difference to the outcome.
| Est. ADR (assumed) \ Occupancy (assumed) | 65% | 70% | 75% | 80% | 85% |
|---|---|---|---|---|---|
| ¥8,000 | 5,200 | 5,600 | 6,000 | 6,400 | 6,800 |
| ¥9,000 | 5,850 | 6,300 | 6,750 | 7,200 | 7,650 |
| ¥10,000 | 6,500 | 7,000 | 7,500 | 8,000 | 8,500 |
| ¥11,000 | 7,150 | 7,700 | 8,250 | 8,800 | 9,350 |
| ¥12,000 | 7,800 | 8,400 | 9,000 | 9,600 | 10,200 |
There are two ways to read the sensitivity. First, a 5-point change in occupancy moves RevPAR by ¥400 at an estimated ADR of ¥8,000 and by ¥600 at ¥12,000, so choosing the rate band tends to matter more than an upside in occupancy. Second, because construction demand follows the schedule, the swing in occupancy is relatively predictable, but if the schedule is extended or brought forward, the start and end of demand shift. As the roughly four-month slip in the Tomari Unit 3 seawall shows, what a sensitivity analysis should focus on is not the revenue level in a single year but the view on how many years demand will last. Periodic inspections continue on a roughly 13-month cycle after operation begins, so the sound approach is to set the level of demand remaining after the construction peak on the downside-case side.
Summary
Restart construction and periodic inspections at nuclear power plants create business demand that arises independently of the tourism calendar. The rooms receiving that demand numbered 641 within 10km of Kashiwazaki-Kariwa, 442 at Onagawa and 277 at Tomari. Across all 15 sites the total is 292 properties and 8,764 rooms, and their distribution is determined almost entirely by whether an existing town lies within 10km, not by the plant itself.
What matters for investment is not the total but two structures. The first is building vintage. At Kashiwazaki-Kariwa, 79% of rooms with a known opening year date from 1999 or earlier, and the top three properties, opened 1988–1997, have seen no new supply of comparable scale in nearly 30 years. At Onagawa, by contrast, 88% date from 2010 or later, and the 204-room property opened in 2023 was in place before construction demand ramped up. At Tomari, 33 rooms were added in December 2025 in step with the construction schedule. The second is back-up supply: rooms within 20km swell to 3.50× the 10km figure at Onagawa, but only 1.45× at Tomari.
These two factors split how prices moved. In Onagawa, with deep back-up supply, the town-wide estimated ADR stayed flat at ¥5,800–6,800 through the five-month periodic inspection from January 2026. In Iwanai, with thin back-up supply, the median estimated ADR stepped up from ¥6,600 to ¥8,300 (+25%) over the 15 months from June 2025, exceeding the previous high in 14 of those months. Whether demand shows up in price or is absorbed by inventory is determined by the room count within 20km.
And the nature of the demand shows in day-of-week pricing. Weekend ÷ weekday ratios of 1.02 in Kashiwazaki, 1.03 in Onagawa and 0.94 in Tomari are clearly different from Echigo-Yuzawa’s 1.18 and Tsukioka Onsen’s 1.13 in the same Niigata Prefecture. The share of office-type employment is also low at 5.8–9.0%, and demand is dominated by long on-site stays. If you are considering hotel investment in markets whose population will fall by 20–40% by 2040, the reference point is not catchment population but the published construction schedules and periodic-inspection cycles. The fact that there is almost no inventory in the band of 40–100 rooms at an estimated ADR of ¥8,000–12,000 points to room for product design matched to those schedules.
Related Articles
References and Sources
■ Data sources
Property locations and room counts are drawn from lodging data we collect on an ongoing basis, extracted within concentric 10km/20km circles centred on a representative point on each plant site and limited to properties with confirmed sales since March 2026 (10km: 292 properties, 8,764 rooms). Estimated settled ADR applies a segment-specific correction factor to each property’s lowest published plan rate; checked against property-level results disclosed by listed hotel REITs (91 properties, most recent 3 months), the median error is about 7%. Day-of-week listed prices are the median of daily averages over the 92 days from June 1 to August 31, 2026 (66 weekdays, 26 weekend days). Estimated occupancy is a monthly estimate by prefecture × segment (Niigata 44 properties / 5,619 rooms; Miyagi 58 / 8,464; Hokkaido 219 / 25,415; June–August 2026). Land prices, zoning and floor-area ratios are from the MLIT Real Estate Information Library; population projections from the 250m-mesh National Land Numerical Information; establishment and employee counts from the Economic Census for Business Activity (2021). Construction and operating status is based on disclosures by each utility and the Nuclear Regulation Authority (as of September 2026).
■ Calculation assumptions
The sensitivity analysis (Tables 8 and 9) uses an illustrative 60-room limited-service hotel placed in the band identified in the text as empty (40–100 rooms, estimated ADR ¥8,000–12,000). Annual room revenue = estimated ADR × occupancy × 60 rooms × 365 days. The base case is estimated ADR ¥9,500 with occupancy (assumed) 80%; downside ¥8,000 / 70%; upside ¥11,000 / 88%. The upper end of occupancy references Niigata’s estimated business-hotel occupancy of 84.7–89.4% (June–August 2026), with the base case set at 80% after allowing for differences in segment and location. Only room revenue is covered; construction costs, land costs, operating costs, financing costs and taxes are excluded. Yields, IRR and investment-decision metrics are not calculated.
■ Limitations and caveats
Room counts are the sum of properties with confirmed sales on major booking sites and exclude unlisted ryokan, minshuku and simple lodgings, as well as company dormitories and worker housing leased directly by the plant operators. Actual accommodation capacity is larger than the figures here. The 10km and 20km circles are concentric from a representative point on each site and do not coincide with municipal boundaries. Iwanai (4–7 properties per month) and Onagawa (3–4) have thin samples: the direction of the level can be read, but the precision of the size of change is limited. Estimated settled ADR and estimated occupancy are both estimates based on inventory listed on major booking sites, not the properties’ actual accounting figures. Tables 8 and 9 are illustrative and do not represent revenue projections or investment decisions for any specific business plan. This article deals only with the facts of lodging demand and room stock generated by construction and periodic inspections, and does not address plant safety or whether reactors should restart.
■ Market data
- MetroEngines Research & Consulting — property room counts and locations (confirmed-sales basis), estimated settled ADR, day-of-week listed prices, estimated occupancy
■ Government statistics and public data
- MLIT Real Estate Information Library — official land prices (2018–2026), zoning, floor-area ratio, building coverage, fire-prevention designation
- MLIT National Land Numerical Information (250m-mesh future population projections, 2024 MLIT estimates) — resident population around Kashiwazaki and Onagawa stations and 2040 projections
- MIC / METI Economic Census for Business Activity (2021); boundaries = 2020 Census small areas — establishments, employees and office-type employment share
■ Primary sources on plant construction and operation
- Agency for Natural Resources and Energy, “Kashiwazaki-Kariwa Unit 6 restarts — the road to resuming operation (Part 1)” (in Japanese)
- Agency for Natural Resources and Energy, “Kashiwazaki-Kariwa Unit 6 restarts — why resuming operation matters (Part 2)” (in Japanese)
- Tokyo Electric Power Company Holdings, “(Comment) On commercial operation of Kashiwazaki-Kariwa Unit 6” (April 16, 2026, in Japanese)
- Hokkaido Electric Power, “Start of construction of a new seawall at Tomari Nuclear Power Station” (in Japanese)
- Japan Atomic Industrial Forum, “Hokkaido Electric to build new 19m seawall at Tomari” (in Japanese)
- Nikkei, “Tomari restart in Hokkaido delayed to summer 2027 or later as seawall works extended by four months” (in Japanese)
- Tohoku Electric Power, “Information on Onagawa Nuclear Power Station Unit 2” (in Japanese)
- Nikkei, “Tohoku Electric begins periodic inspection of Onagawa Unit 2” (in Japanese)
■ Press reports and disclosures on lodging facilities
- Kahoku Shimpo, “Lodging facility to open in central Onagawa this spring; five local seafood firms team up for new revenue” (in Japanese)
- Japan Finance Corporation, “Co-financing support for the opening of Swimmy Inn Onagawa” (in Japanese)
- Hokkaido Shimbun, “Workman House lodging for construction workers opens in Iwanai; bookings strong ahead of Tomari restart” (in Japanese)
- Red Horse Trust Co., Ltd., “Meal-inclusive business lodging Workman House opens 7 new locations in FY2025, expanding to 29 in Hokkaido” (in Japanese)