

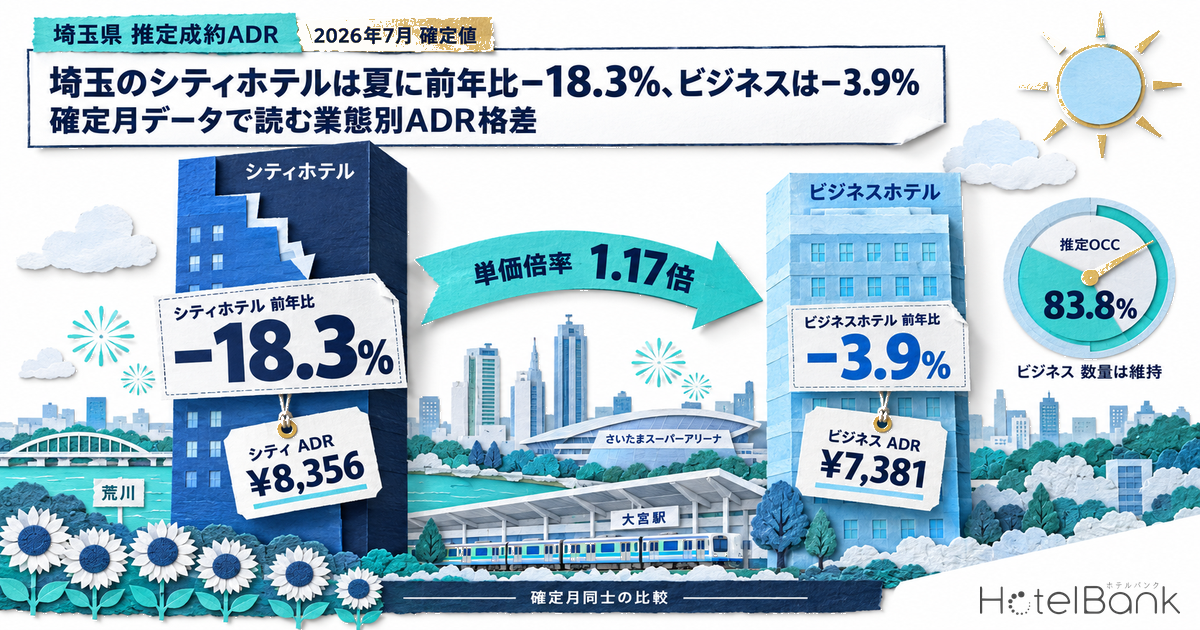
The estimated settled ADR of city hotels in Saitama Prefecture was ¥8,356 in July 2026 (¥10,229 a year earlier, −18.3% YoY) and ¥8,911 in August (¥11,746 a year earlier, −24.1%) — a double-digit year-on-year decline in both summer months. Business hotels in the same prefecture, by contrast, came in at ¥7,381 in July (¥7,680 a year earlier, −3.9%) and ¥7,593 in August (¥7,901, −3.9%), keeping the decline in single digits. Both comparisons are finalized month against finalized month: same market, same period, yet the year-on-year drop differed by roughly a factor of five depending on hotel type. This article breaks down where that gap came from using finalized monthly data, then layers on a same-period comparison across the four Greater Tokyo prefectures and measured volume (estimated OCC).
Coverage: city hotels in Saitama Prefecture, N=12 properties (2026 finalized months); business hotels, N=147 properties (same). Occupancy covers 58 business hotels with about 5,700 rooms (based on listings on major booking sites). The price metric in this article is estimated settled ADR (the settled price level estimated from OTA and other sales data, tax-excluded equivalent); occupancy is an estimate based on OTA-listed inventory. Both are defined at the end of the article. Data as of September 22, 2026.
- — Estimated settled ADR for Saitama city hotels was −18.3% in July 2026 and −24.1% in August (finalized vs. finalized, N=12 properties). Business hotels were −3.9% in both months (N=147), a gap of roughly five times in the size of the decline.
- — City hotels grew +6.5% to +18.6% from January to May, and the turning point was June. Rates did not fall all year; the pattern has two phases — a first-half rise and a sharp summer drop.
- — The main driver of the summer drop is a base-year effect. August 2025 stood out at +37.4% vs. 2024; against August 2024 two years earlier (¥8,550), August 2026 (¥8,911) is +4.2%.
- — The city-to-business rate ratio narrowed from 1.49x (August 2025) to 1.17x (August 2026). In three of the four Greater Tokyo prefectures, city hotels fell further than business hotels.
- — Estimated OCC for business hotels was 83.8% in July 2026 (N=58) and 82.7% in August, so volume held above 80%. The starting point is to treat the YoY decline as a pricing issue, not lost demand.
Finalized Figures for January–August 2026 — Up in the First Half, Below Last Year in Summer
We start by lining up the finalized monthly estimated settled ADR for the two hotel types in Saitama Prefecture. Every month from January to August 2026 is finalized, as is each prior-year month, so each year-on-year figure is a comparison between finalized values.
| Stay month | City 2026 | City 2025 | YoY | Business 2026 | Business 2025 | YoY |
|---|---|---|---|---|---|---|
| Jan | ¥9,028 | ¥8,458 | +6.7% | ¥7,849 | ¥7,343 | +6.9% |
| Feb | ¥8,691 | ¥8,102 | +7.3% | ¥7,654 | ¥7,353 | +4.1% |
| Mar | ¥8,975 | ¥8,340 | +7.6% | ¥7,780 | ¥7,553 | +3.0% |
| Apr | ¥10,192 | ¥8,596 | +18.6% | ¥7,800 | ¥7,703 | +1.3% |
| May | ¥9,260 | ¥8,698 | +6.5% | ¥7,820 | ¥7,748 | +0.9% |
| Jun | ¥8,410 | ¥9,352 | −10.1% | ¥7,357 | ¥7,504 | −2.0% |
| Jul | ¥8,356 | ¥10,229 | −18.3% | ¥7,381 | ¥7,680 | −3.9% |
| Aug | ¥8,911 | ¥11,746 | −24.1% | ¥7,593 | ¥7,901 | −3.9% |
| Jan–Aug average | ¥8,978 | ¥9,190 | −2.3% | ¥7,654 | ¥7,598 | +0.7% |
Estimated settled ADR (tax-excluded equivalent). City N=12 properties (2026) / N=13–14 (2025); business N=147–150 (2026) / N=147–149 (2025). Source: Compiled by HotelBank Editorial Team from MetroEngines Research data
What the table shows is that Saitama’s city hotels did not decline across the whole year. January through May were consistently positive at +6.5% to +18.6%, with April especially strong at +18.6%. The turning point came in June, after which the decline widened month by month through August: −10.1% → −18.3% → −24.1%. As a result, the January–August average of ¥8,978 (¥9,190 a year earlier, −2.3%) looks like only a small annual dip, but underneath it are two opposing phases — a first-half rise and a sharp summer drop.
Business hotels moved differently: the positive margin narrowed gradually from +6.9% in January to +0.9% in May, and June–August landed in shallow negative territory at −2.0% to −3.9%. The January–August average was ¥7,654 (¥7,598 a year earlier, +0.7%), essentially flat year on year. Small swings are characteristic of this segment: across eight months, YoY ranged from a high of +6.9% to a low of −3.9%, a spread of just under 11 points. Over the same period, city hotels ranged from +18.6% to −24.1% — a spread of 43 points.
Estimated settled ADR (tax-excluded equivalent) for Saitama city hotels, overlaid by year. Solid line = finalized values; dotted line = estimates based on current sales (wait for month-end finalization before comparing directly with finalized values). Source: Compiled by HotelBank Editorial Team from MetroEngines Research data
Where Did the Summer Drop Come From? — Last Year’s Level Was High
To understand the summer 2026 decline, we need to look at the comparison base: summer 2025. Estimated settled ADR for Saitama city hotels was ¥10,229 in July 2025, +23.6% over July 2024 (¥8,273), and ¥11,746 in August 2025, +37.4% over August 2024 (¥8,550) — large increases in both months. In other words, the double-digit declines of summer 2026 are the reversal of a year in which rates were pushed up a full step. Placing August 2024 (¥8,550) next to August 2026 (¥8,911) gives +4.2% over two years, showing that summer 2025 alone was the outlier.
In that same summer of 2025, business hotels rose +6.1% in July and +6.0% in August (vs. 2024) — up, but nowhere near as much as city hotels. When last year’s gain is small, this year’s pullback is small too. The 2026 summer gap between hotel types is largely explained by how much each segment had built up the year before.
Year-on-year change in estimated settled ADR (finalized vs. finalized). City N=12 properties; business N=147–150. Source: Compiled by HotelBank Editorial Team from MetroEngines Research data
Another lens makes the structure clearer: the rate ratio between city and business hotels within the prefecture (city ÷ business). In 2025 it widened toward summer — 1.25x in June, 1.33x in July, 1.49x in August — while in 2026 it was nearly flat at 1.14x, 1.13x and 1.17x. The widest ratio of 2026 was 1.31x in April: spring, not summer. The way to read the numbers is that, for Saitama’s city hotels, the summer premium of the upper segment did not materialize the way it did the year before.
A Pattern Shared Across Greater Tokyo — Not Unique to Saitama
To check whether this movement is specific to Saitama, we compared the June–August average estimated settled ADR year on year for the four Greater Tokyo prefectures, again using finalized values only.
Year-on-year change in June–August 2026 average estimated settled ADR (finalized vs. finalized). Properties covered: Saitama city 12 / business 147–150; Tokyo city 107–109 / business 913–915; Chiba city 52–53 / business 162–165; Kanagawa city 42 / business 210. Source: Compiled by HotelBank Editorial Team from MetroEngines Research data
Saitama posted city −18.0% and business −3.3%. Tokyo came in at city −16.9% and business −6.3%, a shape very similar to Saitama’s. Chiba was shallower at city −6.1% and business −1.2%, while Kanagawa was the only one of the four with a positive city figure (+6.6%) and business at −2.5%. In three of the four prefectures, city hotels fell further than business hotels, so the pattern that “the upper segment swings more year on year” is not unique to Saitama. In Chiba, city hotels reversed from early-year gains to a year-on-year decline in July, as covered in our analysis Chiba Settled ADR: H1 2026 Beats Last Year, July Turns −8.2%. In Kanagawa, even though city hotels were positive on a June–August average, August alone came in below last year at city −3.3% and business −4.8%.
Two hypotheses follow. The first is a spillover path: when upper-segment rates in central Tokyo fall by double digits year on year, the incentive for demand that had been shifting to neighboring prefectures on price (so-called substitute demand) weakens, making it harder for suburban city hotels to capture the same premium as the year before. The second is a base-year effect: the exceptional upswing across Greater Tokyo in summer 2025 remains as the comparison base for the following year. Saitama city’s −18.0% is almost the same as Tokyo’s −16.9%, which suggests the latter effect is the larger one. Neither can be proven directly from the data in this article, but when building your own property’s budget, they are useful lenses for separating “market-wide base-year effects” from “property-specific factors.”
Volume Has Not Fallen — Estimated OCC Held Above 80%
When rates fall short of last year, whether volume has also fallen determines which response is right — and the responses are opposite. Estimated OCC (OTA-listed inventory basis) for Saitama business hotels averaged 83.8% in July 2026 and 82.7% in August (58 properties, about 5,700 rooms, based on listings on major booking sites). Averaged by day of week, the figures are as follows.
| Day | Mon | Tue | Wed | Thu | Fri | Sat | Sun |
|---|---|---|---|---|---|---|---|
| July 2026 | 79.2% | 83.6% | 85.4% | 86.7% | 81.7% | 92.7% | 76.6% |
| August 2026 | 79.8% | 84.5% | 85.2% | 85.5% | 83.6% | 87.9% | 73.8% |
Estimated OCC (OTA-listed inventory basis) for Saitama business hotels, averaged by day of week. 58 properties, about 5,700 rooms (based on listings on major booking sites); observation coverage 100%. Source: Compiled by HotelBank Editorial Team from MetroEngines Research data
In both months Saturday was the highest (92.7% in July, 87.9% in August) and Sunday the lowest (76.6% and 73.8%). Wednesday and Thursday ran at 85–87%, so midweek nights filled solidly. The single highest day was 97.1% on July 18 and 95.1% on August 8 — both Saturdays. Volume held above 80%, which is a separate matter from rates failing to reach last year’s level. This occupancy level suggests the YoY rate decline may be “the result of pricing decisions” rather than “demand disappearing.” The 14-point gap between Saturday (87.9%) and Sunday (73.8%) in August is the most immediate place to look for gains; for an earlier cut of the same day-of-week pattern in this market, see Saitama Business Hotels: Sat 77.2% vs Sun 70.1%, Gap Widens to 11pt.
For Revenue Managers Running City and Business Hotels in Saitama — Implications and Action Plan
Operational Insights
1. Split a “below last year” result into base-year effect and property-specific factors. The market’s city hotels rose a full step in 2025 (+23.6% in July and +37.4% in August vs. 2024) before posting −18.3% and −24.1% in 2026. Against two years earlier, August 2026 was ¥8,911 versus ¥8,550 in August 2024. When evaluating your own summer results, put the same month from two years ago alongside the prior year, and distinguish whether you are pulling back in the same shape as the market or falling further.
2. The ratio between hotel types is a yardstick for upper-tier pricing headroom. The city-to-business ratio in the prefecture narrowed from 1.49x in August 2025 to 1.17x in August 2026. The widest point in 2026 was 1.31x in April. Checking whether the price gaps on your upper room types and value-added packages widened and narrowed in the same months the market ratio moved makes it easier to pinpoint where rate fences need revisiting.
3. If occupancy is above 80% and rates are below last year, look first at where declines can be stopped. Estimated OCC for business hotels was 83.8% in July and 82.7% in August, with Wednesday and Thursday above 85%. If rates are below last year on days when you are getting volume, the logical order is to review discount depth and the step structure of your rate plans first.
4. What the seasonal shape means for your rate-change calendar. The market’s city hotels had a two-phase pattern: positive in January–May (+6.5% to +18.6%) and negative in June–August. It is worth keeping two separate calendars — one designed to capture everything in the spring demand period, and one for summer that does not assume last year’s premium.
Action Plan by Time Horizon — This Week, Within Two Weeks, Toward Next Month
| Horizon | Action | Decision trigger | Goal |
|---|---|---|---|
| Today–this week | Line up your June–August actual ADR against the market’s finalized values and compare the sign and size of the YoY change | If your summer decline is deeper than the market’s (city −18.3% in July / −24.1% in August; business −3.9% in both months), look for causes beyond market factors | Separate market-driven from property-driven factors |
| Today–this week | Tally your own inventory pickup by day of week and overlay it on the market’s day-of-week shape | If your Sunday is well below the market’s 76.6% (July) / 73.8% (August), revisit Sunday floor rates and length-of-stay conditions | Lift weak days of the week |
| Within 2 weeks | Take stock of rate fences (room-type, meal and cancellation-policy differentials) | If your upper-to-lower tier gap simply mirrors the market ratio’s narrowing from 1.49x (Aug 2025) to 1.17x (Aug 2026), consider room to restore the gap | Recover upper-tier rates |
| Within 2 weeks | Redesign weekday base rates (anchored on Wednesday and Thursday) | If your Wed/Thu occupancy is at or above the market level (85%+) but ADR is below last year, consider room to raise base rates | Improve midweek rates |
| Toward next month | Review segment mix (check the share of segments you captured in peak periods) | If you did not post gains in January–May while the market’s city hotels ran +6.5% to +18.6%, consider reallocating toward the segments that drove those months | Avoid missing first-half demand |
| Toward next month | Redraw the rate calendar through year-end, reflecting summer results | If there were summer months where last year’s premium did not hold, check first the settings for later months built on the same assumption | Stop assumption errors from cascading |
Source: Compiled by HotelBank Editorial Team from MetroEngines Research data
Note that estimated settled ADR from September 2026 onward is an estimate based on current sales and will move toward month-end. September stands at ¥11,613 for city hotels (N=12 properties) and ¥9,701 for business hotels (N=143); October at ¥12,356 (N=12) and ¥9,858 (N=142); November at ¥12,587 (N=11) and ¥9,937 (N=138); and December at ¥11,553 (N=11) and ¥9,927 (N=128). These are calculated on a different basis from finalized values, so wait for month-end finalization before comparing them directly. The further out the month, the less of it has been sold and the more it can move, so it is safest to treat these figures on the assumption that they will be re-tracked weekly.
Summary — Three Yardsticks
Comparing the two hotel types in Saitama on a finalized-month basis, the results can be organized into three points you can apply at your own property.
1. Look at two years, not a single-month YoY figure. City hotels in August 2026 were −24.1% year on year, but against August 2024 two years earlier (¥8,550), ¥8,911 is +4.2%. Without lining up two years, you cannot tell whether last year was high or this year is low.
2. Track the hotel-type ratio at fixed points. The city-to-business ratio went from 1.49x in August 2025 to 1.17x in August 2026. As an indicator of how much of a premium the upper tier is actually achieving, it is worth following monthly.
3. Always read rate and volume together. Business hotels kept estimated OCC above 80% (83.8% in July, 82.7% in August) while ADR was −3.9% in both months. A YoY decline without a fall in volume is best treated, as a starting point, as a pricing issue rather than lost demand.
As the four-prefecture comparison shows, the YoY decline for city hotels in summer 2026 was a movement shared across the wider region. Continuing to check each month whether you are moving in the same shape as the market, or falling further, is what determines the accuracy of your next rate change.
Frequently Asked Questions
Q. How much did city hotel ADR in Saitama fall in summer 2026?
On finalized estimated settled ADR (tax-excluded equivalent), July 2026 was ¥8,356 (¥10,229 a year earlier, −18.3%) and August was ¥8,911 (¥11,746 a year earlier, −24.1%). The sample is 12 city hotels. June was also down at ¥8,410 (−10.1%), and the decline widened month by month from June to August.
Q. Why did business hotels fall less than city hotels?
Most likely because their gain the previous year was smaller. In summer 2025, city hotels jumped +23.6% in July and +37.4% in August vs. 2024, while business hotels rose only +6.1% and +6.0%. With less built up the year before, the pullback was smaller too, and business hotels landed at −3.9% in both July and August 2026.
Q. Is the fall in city hotel rates unique to Saitama?
No, it is a movement shared across Greater Tokyo. The June–August 2026 average YoY was −18.0% for Saitama city hotels versus −16.9% for Tokyo city hotels — nearly the same — and −6.1% for Chiba city hotels. Kanagawa city hotels were the only positive result among the four at +6.6%, but August alone was below last year at −3.3%.
Q. Has occupancy fallen?
Volume has not fallen. Estimated OCC (OTA-listed inventory basis) across 58 Saitama business hotels was 83.8% in July 2026 and 82.7% in August, with Wednesday and Thursday above 85%. The natural reading is that the YoY rate decline is the result of pricing decisions, not lost demand.
Q. How should I evaluate my own property’s summer results?
Line up the same month from two years ago, not just last year, and check whether you are pulling back in the same shape as the market. The market’s city hotels were at ¥8,911 in August 2026, +4.2% versus ¥8,550 in August 2024. If your decline is deeper than the market’s (city −18.3% in July / −24.1% in August), the next step is to look for causes beyond market factors.
About the Data
- Definition of estimated OCC (OTA-listed inventory basis): OTA-listed inventory occupancy = 100 − 100 × OTA-listed remaining rooms ÷ total rooms. The sample is a fixed cohort of properties that list at least 30% of their total rooms on OTAs (the same set of properties on every stay date). It is an estimate based on the pickup of inventory sold on OTAs and is defined differently from actual room occupancy (rooms not listed are counted on the sold side, so it tends to read high). In this article the sample is 58 business hotels in Saitama Prefecture with about 5,700 rooms (based on listings on major booking sites), for July and August 2026, with 100% observation coverage.
- Booking curves: based on observations from 45 days before the stay date up to the most recent date.
- Definition of estimated settled ADR: the settled price level (tax-excluded equivalent) estimated from OTA and other sales data (lowest-plan level × hotel-type coefficient, ensembled across multiple channels). Past months are finalized values; current and future months are estimates based on current sales. Median error against published operating results is 6.6%.
- Sample sizes: Saitama city hotels N=12 properties (finalized months, Jan–Aug 2026) / N=13–14 (same period 2025); Saitama business hotels N=147–150 (finalized months, Jan–Aug 2026) / N=147–149 (same period 2025). For the Greater Tokyo comparison for June–August 2026: Tokyo city 107–109 / business 913–915; Chiba city 52–53 / business 162–165; Kanagawa city 42 / business 210. Estimates for September–December 2026: city 11–12 / business 128–143.
- All year-on-year comparisons are limited to finalized values against finalized values. We do not directly compare estimates based on current sales with prior-year finalized values.
- Data as of September 22, 2026. Sales status and inventory change daily, so the figures in this article are a snapshot at the time of retrieval.
References and Sources
■ Data sources
Public rate and inventory data from major booking sites collected by MetroEngines Research, aggregated monthly by prefecture × hotel type (city hotels / business hotels) by the HotelBank Editorial Team. Estimated settled ADR covers January 2024 to December 2026; estimated OCC covers Saitama business hotels for July and August 2026; the Greater Tokyo comparison uses Saitama, Tokyo, Chiba and Kanagawa for June–August 2025 and June–August 2026. Data as of September 22, 2026.
■ Calculation assumptions
Estimated settled ADR is a monthly value that aggregates per-property estimates (lowest-plan level × hotel-type coefficient) as the median for the area, tax-excluded equivalent, per room. Year-on-year changes are limited to finalized months (January–August 2026 vs. the same months of 2025), and the June–August average is the simple mean of the monthly values. The hotel-type ratio is the monthly ratio of city ÷ business. Estimated OCC is 100 − 100 × OTA-listed remaining rooms ÷ total rooms, calculated on a fixed cohort of properties that list at least 30% of their total rooms on OTAs.
■ Limitations and caveats
Estimated settled ADR is an estimate with a median error of 6.6% against published operating results and will not match any individual property’s actual ADR. Saitama city hotels are a small sample (N=12), so a price change at a single property can move the median (in 2025 N was 13–14, so the population also differs by one or two properties). Estimated OCC is based on OTA-listed inventory and counts unlisted rooms on the sold side, so it reads higher than actual room occupancy. Figures from September 2026 onward are estimates based on current sales and cannot be compared directly with finalized values. The demand factors discussed in the text (substitute demand, base-year effect) are hypotheses; this article does not establish causation from the data.
Related Articles
- Saitama Business Hotels: Sat 77.2% vs Sun 70.1%, Gap Widens to 11pt
- Kanagawa ADR Splits: City Hotels +20.9%, Business −1.7% in June 2026
- Chiba Settled ADR: H1 2026 Beats Last Year, July Turns −8.2%
- Tokyo 2026: 2,055 New Rooms, 55.6% Business Hotels, ADR Turns Negative
- Saitama Hotel Rates Vary 4.8x by Municipality: 35 Areas, 5 Tiers