

About two months after the 2026 Kumamoto Earthquake (令和8年熊本地震, July 28, 2026), lodging demand in Kyushu has begun to come back. The recovery, however, is not uniform across prefectures, and even within a single prefecture it diverges sharply by accommodation type. This article lines up monthly OTA inventory sell-through by accommodation type for Kumamoto and Kagoshima, and measures which types filled up first and which still have inventory headroom. It then works through which types stand to gain the most, in yen terms, from the Kyushu Fukko Ouenwari (Kyushu Recovery Support Discount), which applies to stays from October 1, 2026.
Metric Definitions Used in This Article
- OCC (occupancy rate): rooms sold as a share of total rooms in the area (an estimate based on OTA sales inventory). This article also refers to it as “inventory sell-through.” It is an estimate based on how inventory listed on OTAs is being consumed, and differs from a property’s actual overall occupancy. Inventory not listed on OTAs — direct bookings via official websites, travel-agency allotments, long-term corporate contracts and the like — is not included. Accommodation types with many high-direct-sales properties therefore tend to read lower than their actual in-house occupancy.
- Listed price: the selling price published on OTAs and similar channels. The per-room rate for two guests sharing one room (tax included), averaged across all plans (from room-only to meal-inclusive), is calculated daily for each property; the area median is then averaged over the month. It represents the price level of a typical property in the area and differs from actual transacted prices.
- Unit of aggregation: prefecture × accommodation type × month. Accommodation types are business hotels, city hotels, resort hotels and ryokan (four categories). September 2026 covers the 21 days from September 1 to 21 (observation in progress).
- Data source: MetroEngines Research
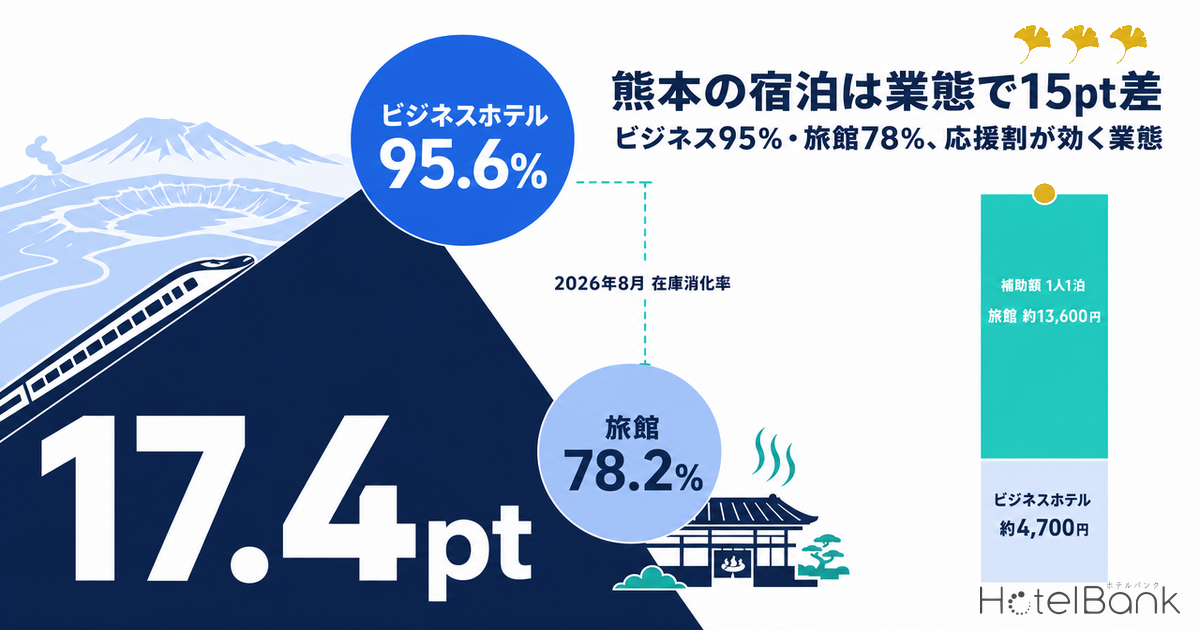
- — In Kumamoto, the sell-through gap between business hotels and ryokan widened from 1.5pt in June 2026 to 17.4pt in August (business hotels 95.6%, ryokan 78.2%).
- — In neighbouring Kagoshima, all four types stayed roughly within 70–85%, and in August ryokan (76.2%) actually outsold business hotels (72.2%). The divergence by type is strongest in the prefecture at the centre of the disaster.
- — Listed prices at Kumamoto business hotels are up +15.9% YoY for September and +14.9% for October. The tighter a type’s inventory, the larger its price increase.
- — At a 60% subsidy rate, the estimated October subsidy per person per night in Kumamoto is approx. ¥13,600 for ryokan and approx. ¥15,400 for resort hotels — 2.9–3.3 times the business-hotel figure (approx. ¥4,700).
- — The types with the most inventory headroom are the same types on which the subsidy has the largest yen impact. That is where the upside lies for October–November.
Kumamoto: a 1.5pt gap by type in June widened to 17pt in August
First, Kumamoto’s inventory sell-through by accommodation type. In June 2026, before the earthquake, business hotels stood at 78.1%, city hotels at 85.8%, resort hotels at 76.3% and ryokan at 76.6% — all four types sat within a range of roughly 76–86%. The gap between business hotels and ryokan was just 1.5pt.
In August, that pattern broke down. Business hotels rose to 95.6% and city hotels to 95.6%, while resort hotels stayed at 77.0% and ryokan at 78.2%. The gap between business hotels and ryokan widened to 17.4pt. September (1st–21st) shows the same structure: business hotels at 93.0% and city hotels at 94.2%, against 77.3% for resort hotels and 80.0% for ryokan.
Source: MetroEngines Research; compiled by HotelBank Editorial Team
The key point is the different nature of the two types that rose and the two that stayed flat. What business and city hotels are absorbing is demand whose timing cannot easily be pushed back at the traveller’s own convenience: business trips, recovery-related work and other work-purpose travel. Resort hotels and ryokan, by contrast, mainly serve leisure demand, where both destination and timing are discretionary. The former takes the post-disaster increase in activity within the prefecture directly, while the latter is prone to an “it doesn’t have to be this year” decision. The measured 17pt gap is consistent with this difference in the nature of demand.
Note that the sample for Kumamoto covers 58–59 business hotels (7,123–7,399 rooms) and 122–155 ryokan (2,419–2,898 rooms), both large enough to read the trend for each type. Resort hotels, however, number only 13–17 properties (787–987 rooms), so their month-to-month swings are larger than those of the other types.
Kagoshima: same island, but no comparable divergence by type
Viewed the same way, neighbouring Kagoshima looks quite different. Business hotels ran at 73.5% in June, 78.9% in July, 72.2% in August and 75.2% in September; ryokan at 71.1%, 74.6%, 76.2% and 69.7%. All four types moved roughly within a 70–85% range. In August, ryokan (76.2%) actually outsold business hotels (72.2%), so the ranking by type seen in Kumamoto does not hold at all.
Source: MetroEngines Research; compiled by HotelBank Editorial Team
Immediately after the earthquake, Kagoshima was affected by the transport disruption from the suspension of the Kyushu Shinkansen. Service between Shin-Minamata and Kagoshima-Chuo resumed on August 7 and between Kumamoto and Shin-Minamata on September 18, restoring the full line. Within Kagoshima, however, recovery-related business demand did not arise in the concentrated way it did in Kumamoto, and no outsized filling of business-oriented types has been observed. In other words, the phenomenon of “recovery timing diverging by accommodation type” is not occurring uniformly across Kyushu; it is particularly strong in the prefecture at the centre of the disaster.
| Prefecture / type | Jun | Jul | Aug | Sep* | Properties | Rooms |
|---|---|---|---|---|---|---|
| Kumamoto Business hotels | 78.1% | 81.9% | 95.6% | 93.0% | 58–59 | 7,123–7,399 |
| Kumamoto City hotels | 85.8% | 87.1% | 95.6% | 94.2% | 13–15 | 1,481–1,659 |
| Kumamoto Resort hotels | 76.3% | 73.5% | 77.0% | 77.3% | 13–17 | 787–987 |
| Kumamoto Ryokan | 76.6% | 73.0% | 78.2% | 80.0% | 122–155 | 2,419–2,898 |
| Kagoshima Business hotels | 73.5% | 78.9% | 72.2% | 75.2% | 69–72 | 5,794–5,868 |
| Kagoshima City hotels | 76.6% | 81.3% | 79.0% | 80.4% | 14–16 | 1,844–1,931 |
| Kagoshima Resort hotels | 79.0% | 81.5% | 84.8% | 79.7% | 26–30 | 1,401–1,548 |
| Kagoshima Ryokan | 71.1% | 74.6% | 76.2% | 69.7% | 51–60 | 1,259–1,340 |
*September covers the 21 days from September 1 to 21 (observation in progress). Property and room counts vary by month and are shown as ranges.
Source: MetroEngines Research; compiled by HotelBank Editorial Team
Prices: the tighter the inventory, the larger the YoY increase
Next, listed prices for the same accommodation types compared with the same month a year earlier. The measure is the area median of each property’s daily average price, calculated the same way throughout the year, so the basis does not shift in cross-month comparisons.
Kumamoto business hotels list at ¥15,500 for September 2026 (n=121 properties), +15.9% YoY, and ¥15,600 for October (n=120 properties), +14.9%. The type whose sell-through has tightened to 93–96% is also well above last year on price. City hotels list at ¥24,500 for September (+8.8%) and ¥24,800 for October (+0.3%).
Ryokan, which still have inventory headroom, are also running above last year: ¥43,500 for September (+9.2%, n=243 properties), ¥45,200 for October (+10.9%, n=242 properties) and ¥46,900 for November (+11.5%). Resort hotels show the largest increase, ¥51,300 for October at +43.6%, but with only 25 properties in the sample the figure is sensitive to changes in the property mix and should be discounted accordingly.
Kagoshima lines up differently again. Business hotels list at ¥13,400 for October (+7.4%, n=155 properties), ryokan at ¥36,100 (+11.7%, n=82 properties) and resort hotels at ¥48,800 (+24.6%, n=53 properties), all rising, whereas city hotels, at ¥19,800 for October, are −6.3% YoY (n=25 properties) — the only type below last year.
Source: MetroEngines Research; compiled by HotelBank Editorial Team
To sum up: in Kumamoto, the business-oriented types with the tightest inventory are also furthest above last year on price, while in Kagoshima, with a flat sell-through ranking, pricing strategies diverge by type. In both prefectures, ryokan and resort hotels are listing above last year’s prices while still holding spare inventory, which leaves open the question, from October onward, of what price level to move that inventory at.
The subsidy’s yen impact is largest for the types with the most headroom
The Kyushu Fukko Ouenwari starts with stays from October 1, 2026. Funded by ¥15.5 billion from the Ministry of Land, Infrastructure, Transport and Tourism’s reserve fund and allocated to Kyushu’s seven prefectures, it discounts at 50% in five prefectures and at 60% in Kumamoto and Kagoshima, the two at the centre of the disaster. The cap per person per night is ¥20,000 for accommodation only, ¥30,000 for transport-inclusive stays of two nights or more, and ¥35,000 for multi-prefecture itineraries covering two or more prefectures. Booking start dates and end dates are set by each prefecture; in Kumamoto, bookings opened at 10:00 on September 15. For the overall design of the scheme and the price bands where the ¥20,000 cap binds, see Kyushu Recovery Subsidy Set: 60%/50% Split, ¥20,000 Cap Hits Top 10%.
What we want to see here is which types the subsidy reaches most “in yen terms.” With a 60% rate and a ¥20,000 cap, the cap starts to bind above ¥33,333 per person per night. Dividing Kumamoto’s October listed prices by two guests per room to get a per-person-per-night figure, the estimated subsidy is as follows.
| Type | Listed price 2 guests/room, tax incl. |
Per person per night |
Subsidy per person per night |
Sep sell-through |
|---|---|---|---|---|
| Business hotels | ¥15,580 | ¥7,790 | approx. ¥4,700 | 93.0% |
| City hotels | ¥24,780 | ¥12,390 | approx. ¥7,400 | 94.2% |
| Ryokan | ¥45,176 | ¥22,588 | approx. ¥13,600 | 80.0% |
| Resort hotels | ¥51,318 | ¥25,659 | approx. ¥15,400 | 77.3% |
Listed price is the area median of each property’s daily average price. Per-person-per-night is a simple split of a two-guest room. The subsidy is an estimate at the 60% discount rate and does not reach the ¥20,000 cap. Actual subsidy amounts vary with each property’s selling price, plan content and each prefecture’s implementation.
Source: MetroEngines Research and Japan Tourism Agency publications; compiled by HotelBank Editorial Team
The ryokan subsidy of approx. ¥13,600 per person per night is about 2.9 times the approx. ¥4,700 for business hotels. Resort hotels are larger still, at approx. ¥15,400. In other words, the two types with the lowest sell-through and the most headroom as of September are exactly the two on which the subsidy has the largest yen impact. Because a 60% rate with a ¥20,000 cap gives larger per-person discounts to higher-priced types, conditions line up with plenty of upside for ryokan and resort hotels, where the return of leisure demand is lagging.
Business and city hotels, conversely, had already sold 93–94% of their inventory by September, and many dates fill even without the subsidy. With subsidies of only a few thousand yen per person, the additional lift the scheme can deliver for them appears relatively small.
Options by accommodation type for October–November
Based on these measurements, the directions for October–November split by type as follows. These are presented as inputs to decision-making, not as definitive conclusions.
Business-oriented (business and city hotels): conditions to push price, and preparing for what comes after
In Kumamoto, sell-through is running at 93–96%, and listed prices are up YoY by +14.9–15.9% for business hotels and +0.3–8.8% for city hotels. Strong demand is actually being reflected in price, and conditions for pushing price are in place for October–November too. Recovery-related business demand will, by its nature, normalise eventually, however, so looking beyond that, one option is to prepare by differentiating how inventory is released on weekdays versus weekends (for Kumamoto’s day-of-week patterns by type, see Kumamoto Day-of-Week Occupancy Inverts by Type: Thu 88.3% vs Sat 89.9%). Business-oriented types in Kagoshima are running at 72–81% sell-through, leaving room to prioritise moving inventory over price.
Ryokan and resort hotels: concentrate subsidy-eligible plans on the dates with the most headroom
In both prefectures sell-through sits in the 70–85% range, and once the subsidy applies from October it works as an effective discount of ¥13,000–15,000 per person. Because the subsidy is limited in both duration and funding, a design that releases inventory first on the dates where sell-through is lagging tends to work well. Kumamoto’s ryokan in particular are numerous (122–155 properties), so availability by date is likely to vary even under the same subsidy rate. A realistic option is an allocation that holds normal price levels on dates where the property’s own inventory is selling well, and concentrates subsidy-eligible plans on dates with the most headroom.
A cross-prefecture view: the two 60% prefectures and the ¥35,000 multi-prefecture cap
Kumamoto and Kagoshima both get the 60% rate, more favourable than the 50% in the other five prefectures. In addition, with the full Kyushu Shinkansen line restored on September 18, October is the first full month of operation without travel constraints. For multi-prefecture itineraries covering two or more prefectures, the cap rises to ¥35,000 per person, so properties with routes that cross prefectural borders can draw on larger funding than a single-prefecture stay allows.
Summary
The recovery after the 2026 Kumamoto Earthquake is not uniform even at prefecture level: within the same prefecture, timing diverges by accommodation type. In Kumamoto, the sell-through gap between business hotels and ryokan, 1.5pt in June 2026, widened to 17.4pt in August. The numbers confirm a sequence in which work-purpose demand returns first and discretionary leisure demand follows. Neighbouring Kagoshima has not diverged in the same way, with all four types moving within a 70–85% range.
On price, Kumamoto business hotels are listed +14.9% YoY for October, a level that matches their tight inventory, while ryokan and resort hotels are listing above last year’s prices while still holding spare inventory. And the Kyushu Fukko Ouenwari starting in October, by design (60% rate, ¥20,000 cap), yields the largest per-person subsidy at higher-priced ryokan and resort hotels. The types with the most inventory headroom and the types on which the subsidy works hardest are one and the same — that is the starting point for reading Kyushu in October–November.
Related Articles
- Kyushu Recovery Subsidy Set: 60%/50% Split, ¥20,000 Cap Hits Top 10%
- Kyushu Subsidy: 10pt Border Step Cuts Kurokawa-Yufuin Gap to ¥665
- Kumamoto Day-of-Week Occupancy Inverts by Type: Thu 88.3% vs Sat 89.9%
References and Sources
■ Data sources
Daily observations of OTA-listed inventory and listed prices collected by MetroEngines Research, aggregated by prefecture × accommodation type (business hotels, city hotels, resort hotels, ryokan) × month. Inventory sell-through covers June–September 2026 (September: 1st–21st); listed prices compare the same months from June 2025 to December 2026. Property and room counts vary by month and are shown as ranges.
■ Calculation assumptions
The subsidy amounts in Table 2 take Kumamoto’s October 2026 listed prices by accommodation type (two guests per room, tax included, area median of the all-plan average), split them equally between two guests to get a per-person-per-night figure, and multiply by the Kyushu Fukko Ouenwari’s 60% discount rate for Kumamoto. No type reaches the cap (¥20,000 per person per night for accommodation only). YoY comparisons compare area medians of each property’s daily average price.
■ Limitations
Inventory sell-through is an estimate based on how OTA-listed inventory is being consumed; it excludes direct bookings, travel-agency allotments and long-term contracts, and does not match properties’ actual occupancy. Listed prices are selling prices, not transacted prices. The resort-hotel sample is small (13–30 properties), so monthly values are prone to swings from changes in the property mix. Subsidy amounts are estimates; actual discounts vary with each property’s plans, each prefecture’s implementation and how quickly funding is used up.
■ Market data
- MetroEngines Research — inventory sell-through by accommodation type (estimate, OTA-listed inventory basis; Kumamoto and Kagoshima, June–September 2026) and listed prices by accommodation type (June 2025–December 2026)
■ Policy and official sources
- Japan Meteorological Agency, “2026 Kumamoto Earthquake portal site” (in Japanese)
- Japan Tourism Agency to launch “Kyushu Fukko Ouenwari” in October: 50% off travel and lodging, 60% in Kumamoto and Kagoshima (Travel Voice, August 28, 2026; in Japanese)
- “Kyushu Fukko Ouenwari” travel support confirmed from October: ¥20,000 off per night, up to ¥35,000 for tours (Travel Watch; in Japanese)
- Kagoshima Prefecture, “Survey of accommodation cancellations related to the 2026 Kumamoto Earthquake” (in Japanese)
■ News