

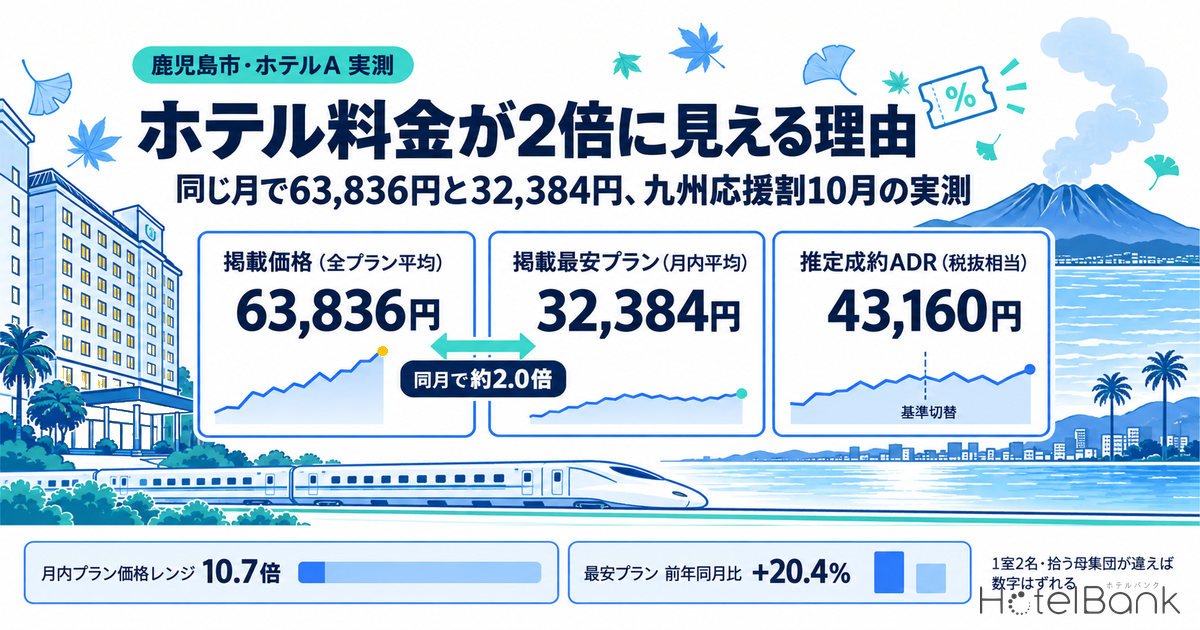
The “average rate” for the same hotel in the same month can look almost twice as high in one document as in another. For a large full-service hotel in Kagoshima City (more than 200 rooms; “Hotel A” below), October 2026 shows an average of ¥63,836 across every plan listed on the major booking sites, ¥32,384 when only the cheapest plan of each day is averaged over the month, and an estimated settled ADR of ¥43,160 (all figures for two guests per room; listed prices are tax-inclusive). All three describe the same property over the same period — they diverge because each one draws on a different population of plans.
With the Kyushu Fukko Ouenwari recovery subsidy starting in October 2026, the question facing hotel PR and revenue teams is not “did rates go up” but which number you use, and what you compare it against. This article does not evaluate any individual property’s pricing decisions; it builds a reusable template for explaining rates, measured against public data from Kagoshima City.
Metric Definitions Used in This Article
- Listed price (all-plan average): the average of every plan listed on the major booking sites. Per-room rate for two guests per room (tax-inclusive). It counts room-only stays, half-board plans and upper-tier rooms alike, so the average rises whenever higher-priced plans are what remain in inventory.
- Cheapest listed plan (monthly average): the daily cheapest available rate, averaged across the month. Two guests per room, tax-inclusive. Because the population it draws on is defined identically from month to month, it is the right anchor for year-on-year comparison.
- ADR (average daily rate / estimated settled ADR): an estimated transacted rate (tax-exclusive equivalent) derived by applying a segment-specific correction factor to each property’s cheapest-plan level. Cross-checked against per-property results disclosed by listed hotel REITs (184 property-months, April-May 2026), the median error is roughly 7% (about 6% for business and city hotels). It is an estimate and differs from any individual property’s actual transacted rates or accounting figures. Area-level ADR is the median of the properties covered. Figures through August 2026 are on a settled-month basis, while September 2026 onward are estimated forward from listings observed at the time of research. Because the basis switches, changes spanning the two periods cannot be read as movement.
- Occupancy (estimated, based on listed OTA inventory): sold rooms as a share of total rooms in the area, estimated from inventory offered on booking sites. It is an estimate based on how listed inventory is taken up and differs from a property’s actual overall occupancy.
- Data source: MetroEngines Research
- — The same property in the same month produces three different averages. For October 2026: ¥63,836 all-plan listed average, ¥32,384 cheapest-plan monthly average, ¥43,160 estimated settled ADR (two guests per room; listed prices tax-inclusive) — a spread of about 2.0x.
- — The measured within-month plan price range is 10.7x (Sep 14 – Oct 19, 2026; 5,022 listings, from ¥21,780 to ¥233,530). Because cheap allocations sell out first, the listed average rises even with no price increase.
- — Anchor year-on-year comparison on the cheapest-plan monthly average, because its definition does not shift from month to month. October was +20.4% year on year, and the September-to-October rise was +17.6% in 2025 versus +38.4% in 2026 — letting you separate the seasonal component from what is specific to this year.
- — Year-on-year changes across the same area range from +39.5% to −15.2%, with the median listed ADR for Kagoshima City at +15.3% (96 to 113 properties covered). Always give readers the context they need to place your own property.
- — A percentage-rate subsidy pushes prices up in theory. In Kagoshima Prefecture, where the subsidy covers 60%, the ¥20,000 cap starts to bind above ¥33,333 per person per night. Put three things in place before the program starts: a pricing decision log, an explicit cheapest-plan floor, and voluntary disclosure of year-on-year change.
Three numbers for one month — how different populations create a 2x spread
Start with where the gap comes from. The all-plan listed average picks up every plan sold that month with equal weight: a room-only single-occupancy stay and a suite with breakfast and dinner each count as one listing. So when the cheap plans sell out first and disappear from inventory, the mix of what remains shifts upward, and the average rises even if nothing was repriced by a single yen.
The cheapest-plan monthly average, by contrast, tracks only the lowest rate obtainable on each day. It is far less sensitive to changes in plan mix, and its definition does not move from month to month. The estimated settled ADR is a third thing again: it applies a segment-specific correction to the cheapest-plan level to estimate the rate that was likely actually transacted, expressed as a tax-exclusive equivalent — it is not the listed price itself.
Lining up all three for Hotel A from June 2026 onward makes the size of the gap visible. In October the all-plan average of ¥63,836 sits against a cheapest-plan average of ¥32,384 — a ratio of almost exactly 2.0x. Mix those two together and you can argue for any conclusion you like.
Source: MetroEngines Research; compiled by the HotelBank Editorial Team
One thing to watch: the estimated settled ADR changes method between August and September 2026 (settled-month basis to forward estimate). The sequence ¥35,083 in August to ¥26,694 in September does not mean demand fell. It simply places two figures built on different bases side by side. If you are assembling a time series for internal use, do not report change across that seam. For the main year-on-year anchor, the safer choice is the cheapest-plan monthly average, whose method is consistent throughout.
| Metric | Sep 2026 | Oct 2026 | Population it draws on |
|---|---|---|---|
| Listed price (all-plan average) | ¥49,701 | ¥63,836 | Every plan remaining in inventory (affected by mix shift) |
| Cheapest listed plan (monthly average) | ¥23,395 | ¥32,384 | Only each day’s lowest rate (constant definition) |
| Estimated settled ADR (tax-exclusive equivalent) | ¥26,694 | ¥43,160 | Cheapest level x segment correction (forward estimate from September) |
Source: MetroEngines Research; compiled by the HotelBank Editorial Team
Where “it doubled” comes from — a measured 10.7x within-month plan price range
Collecting every plan Hotel A listed across the 36 days from September 14 to October 19, 2026 gives a low of ¥21,780, a high of ¥233,530, an average of ¥57,296, and 5,022 plan listings in total. The range multiple is 10.7x. For the same property in the same period, the number you see differs by an order of magnitude depending on which plan you happened to look at.
Now consider what happens as inventory sells into a spread that wide. Cheaper plans drop out first, so the floor of what is still listed ratchets upward. Month by month: October 2025 ran from ¥20,770 to ¥200,050 across 2,042 listings, while October 2026 ran from ¥26,620 to ¥231,110 across 3,188. The high rose only +15.5%, while the floor moved a much larger +28.2%.
Source: MetroEngines Research; compiled by the HotelBank Editorial Team
In other words, the “it got expensive” that guests experience is usually not the top price rising — it is the flip side of cheap allocations thinning out. Put a single range box in your explanatory materials and you no longer have to convey that distinction in words alone.
Rebuttal technique 1: line up the same month and same weekday a year earlier
Prices rising from September into October is an annual event, and not only in Kagoshima. Hotel A’s cheapest-plan monthly average rose from ¥22,872 in September 2025 to ¥26,903 in October, +17.6%. In 2026 it went from ¥23,395 to ¥32,384, +38.4%. That lets you decompose the September-to-October rise: roughly 17.6 points’ worth is the usual seasonality, and the remainder is specific to this year. On a year-on-year basis, October is +20.4%.
For more precision, align the days of the week. The number of Saturdays in October varies by year, so a comparison of monthly averages mixes in differences in weekday composition. Averaging the daily cheapest listed price by day of week gives the following.
Source: MetroEngines Research; compiled by the HotelBank Editorial Team
What this shows is that the largest increases fall on weekdays (Thursday +39.1%, Tuesday +35.4%, Wednesday +33.8%), while Saturday — already expensive — rose +20.5% and Friday only +12.9%. The weekend peak did not get higher; the weekday trough got shallower. The Kyushu Shinkansen resumed service between Kumamoto and Shin-Minamata on September 18, restoring the full line, which makes October 2026 the first month of full operation since the restoration. When weekday business and corporate-travel demand returns, the first thing to disappear is the cheap weekday allocation — and splitting by day of week brings that outline into focus.
Rebuttal technique 2: don’t look only at your own property — the area spans +39.5% to −15.2%
Present your own numbers alone and readers cannot tell whether they are unusual or simply the market moving. Matching the October cheapest-plan monthly average for major properties in Kagoshima City against the same month a year earlier gives a notably wide distribution.
Source: MetroEngines Research; compiled by the HotelBank Editorial Team (property names anonymized)
The strongest gainer is +39.5% and the largest decliner −15.2%. Hotel A’s +20.4% sits toward the upper part of that distribution without standing out on its own. Across the market as a whole, the listed ADR for Kagoshima City (median of properties covered) went from ¥14,137 in October 2025 (96 properties) to ¥16,295 in October 2026 (113 properties), +15.3%. The growth in the number of listed properties calls for some discount in reading that figure, but the upward trend itself is shared citywide.
Source: MetroEngines Research; compiled by the HotelBank Editorial Team
Supply and demand deserve a look too. Estimated occupancy for Kagoshima Prefecture based on listed OTA inventory was 63.0% in June 2026 (292 properties, roughly 11,252 rooms), 74.7% in July, 63.4% in August and 71.4% in September (September observed as of the 21st). By segment, September ran 81.0% for city hotels, 80.3% for resorts, 72.2% for ryokan and 64.9% for business hotels — pickup speed varies considerably by property type. When you discuss your own rate trajectory, it lands better placed within the range for your own segment.
Show the out-of-pocket cost after the subsidy — the ¥20,000 cap binds above ¥33,333 per person
The Kyushu Fukko Ouenwari runs across the seven Kyushu prefectures for stays from October 1, 2026, with a subsidy rate of 50% in five prefectures and 60% in Kumamoto and Kagoshima. The ceiling per person per trip is ¥20,000 for lodging only or for a one-night package including transport, ¥30,000 for a package of two nights or more including transport, and ¥35,000 for a multi-area itinerary staying in two or more prefectures (Japan Tourism Agency, announced August 28, 2026). Rather than restate the program’s overall design and the prefecture-by-prefecture allocations, this section covers the last slide your explanatory materials need: the guest’s out-of-pocket cost after the subsidy.
In Kagoshima Prefecture, at a 60% subsidy rate, the ¥20,000 ceiling starts to bind above ¥33,333 per person per night (¥20,000 ÷ 0.6). Below that, the flat 60% applies in full.
| Displayed price (per person per night) | Subsidy (60%, ¥20,000 cap) | Out of pocket | Effective discount |
|---|---|---|---|
| ¥10,000 | ¥6,000 | ¥4,000 | 60.0% |
| ¥16,200 (Hotel A’s October cheapest level) | ¥9,720 | ¥6,480 | 60.0% |
| ¥25,000 | ¥15,000 | ¥10,000 | 60.0% |
| ¥33,333 | ¥20,000 | ¥13,333 | 60.0% |
| ¥40,000 | ¥20,000 | ¥20,000 | 50.0% |
| ¥60,000 | ¥20,000 | ¥40,000 | 33.3% |
Compiled by the HotelBank Editorial Team from the Japan Tourism Agency’s “Kyushu Fukko Ouenwari” (announced August 28, 2026). Per-person figures are listed prices for two guests per room divided by two.
Hotel A’s October cheapest-plan monthly average of ¥32,384 (two guests per room) works out to roughly ¥16,200 per person. At a 60% rate, the out-of-pocket cost is about ¥6,500 — a price band still short of the cap. A room at the ¥63,836 all-plan average, meanwhile, is about ¥31,900 per person, which sits just below the cap as well. Tabulating which of your own price bands the cap starts to bind in, at the announcement stage, clears most inquiries before they arrive.
A percentage-rate subsidy pushes prices up in theory — a separate layer from any single operator’s intent
This part is worth setting out neutrally. A percentage-rate lodging subsidy lowers the effective price uniformly from the guest’s point of view, shifting the demand curve to the right. At a property whose supply — its room count — is fixed for the month, the theoretical consequence is that the increase in demand is absorbed through price. That is a property of the market mechanism, and it says nothing about the intent of any individual operator. Listed prices moving up when a subsidy is introduced is not peculiar to any particular property; it is widely observed whenever a percentage-rate subsidy is applied to a good whose supply cannot be expanded in the short run.
Which is precisely why what operators can do is not to assert “rates went up” or “rates did not go up,” but to disclose, first and on their own initiative, which numbers moved, when, and by how much. The three items below fit in the window between the program’s announcement and its start.
| Preparation item | What to actually do | Where it pays off |
|---|---|---|
| (a) Pricing decision log | Record one line per change: the date of the revision, the stay dates affected, the level before and after, and the basis for the judgment (rooms remaining, group bookings, events and so on). For revisions made before the program’s announcement date, make sure you can show that with a date. | Answering questions about sequence from records rather than memory |
| (b) State the cheapest-plan floor | Write the floor on your announcement page: “the cheapest plan for this period starts at ¥XX,XXX (two guests per room, tax-inclusive).” Publishing the cheapest floor rather than the all-plan average leaves less room for the gap against the listed average to be misread. | Inquiries on dates when only upper-tier plans remain |
| (c) Voluntary year-on-year disclosure | Using the cheapest-plan monthly average, publish the year-on-year change alongside the same month-to-month change a year earlier (the seasonal component). Better still if you can build a comparison table with days of the week aligned. | Setting the reference point before a third party starts comparing on a different definition |
Deciding the number of slides in advance speeds things up too. Slide 1: a year-on-year bar chart (cheapest-plan monthly average, by day of week). Slide 2: a box for the within-month plan price range (low, average and high, plus the count of listed plans). Slide 3: a comparison against the area and the market average. Slide 4: the out-of-pocket calculation after the subsidy. With those four, the threshold argument over which number is being looked at rarely gets started.
Conclusion
Three average rates emerging from the same month at the same property is not a sign that the data is unstable — it is a consequence of drawing on different populations. At Hotel A in Kagoshima City, the October 2026 all-plan listed average of ¥63,836 and the cheapest-plan monthly average of ¥32,384 are about 2.0x apart, and the measured within-month plan price range reached 10.7x.
What belongs at the center of any explanation is the cheapest-plan monthly average, whose definition does not shift from month to month, together with the measured within-month plan price range. Line those up against the same month and the same weekday a year earlier and the seasonal component separates from what is specific to this year (for Hotel A, September to October was +17.6% in 2025 versus +38.4% in 2026, with October +20.4% year on year). Set them against the distribution across the area (+39.5% to −15.2%) and the market median (+15.3%), and readers can place your property for themselves.
As long as a percentage-rate subsidy shifts the demand curve to the right, prices moving up in a month when supply is fixed is a possible theoretical consequence. What can be defended in that moment is not an assertion but records and consistency of definition. Before the program takes effect, put the three items in place: a pricing decision log, an explicit cheapest-plan floor, and voluntary year-on-year disclosure.
⚠ Note on prices for future dates: figures in this article from September 2026 onward are estimates based on rates listed on the major booking sites at the time of research, and they move as the check-in date approaches. Please note that current levels may rise or fall as plans are added and inventory is adjusted. Because the estimated settled ADR is calculated on a different basis before and after September 2026, it is not used for comparisons of change spanning the two periods.
Related Reading
References and Sources
- Japan Tourism Agency, “Kyushu Fukko Ouenwari” (disaster-related information) — subsidy rates, ceilings and program period
- “Kyushu Fukko Ouenwari travel support confirmed for October: ¥20,000 off per night, up to ¥35,000 for tours” (Travel Watch, August 28, 2026)
- MetroEngines Research — listed prices (all-plan average / cheapest-plan monthly average), within-month plan price range, estimated settled ADR, estimated occupancy based on listed OTA inventory
- HotelBank Editorial Team research — aggregation of guest reviews
■ Data sources
Listed prices (all-plan average and cheapest-plan monthly average), the within-month plan price range, the estimated settled ADR and estimated occupancy based on listed OTA inventory are drawn from aggregated data collected daily from public listings on the major booking sites (MetroEngines Research). Coverage is listed properties in Kagoshima City (96 in October 2025; 113 in October 2026); for the single property discussed in the text, 5,022 plan listings from September 14 to October 19, 2026. Subsidy rates, ceilings and timing come from materials published by the Japan Tourism Agency (August 28, 2026).
■ Calculation assumptions
All listed prices are per-room rates for two guests per room (tax-inclusive). The out-of-pocket calculation applies Kagoshima Prefecture’s 60% subsidy rate to a per-person, per-night figure obtained by halving the listed price for two guests per room, capped at the ¥20,000 per-person ceiling (the cap starts to bind above ¥20,000 ÷ 0.6 = ¥33,333). Year-on-year comparison is anchored on the cheapest listed plan’s monthly average, whose population definition is constant from month to month; the day-of-week comparison averages the daily cheapest listed price by weekday.
■ Limitations and caveats
The estimated settled ADR is on a settled-month basis through August 2026 and a forward estimate from listings observed at the time of research from September 2026, so change spanning the two bases cannot be read and it is not used as the main year-on-year anchor. Figures from September 2026 onward are estimates based on listed prices for future dates and may move as inventory is adjusted and plans are added. Because the number of listed properties has grown from the prior year, changes in area aggregates include a shift in the underlying population. Occupancy is an estimate based on how listed OTA inventory is taken up and differs from a property’s actual overall occupancy. This article does not evaluate any particular lodging operator’s pricing decisions, nor does it infer operators’ intent.