

Hotels where you “stay the way you live” — extended stay — have emerged as a distinct category in Japan, driven by longer inbound trips, medium- to long-term domestic business travel, and dual-residence lifestyles. This article lays out the 10 major brands that place long-stay capability at the core of their proposition in Japan (listed in Japanese syllabary order), with each company’s published scale and its source. Using the listed-price data we collect, we also measured where long-stay plans are priced relative to standard plans.
- — The 10 major brands built around long stays fall into three lineages: international serviced-apartment groups, domestic developer brands, and hotel-tech start-ups. Room design and operations differ by origin.
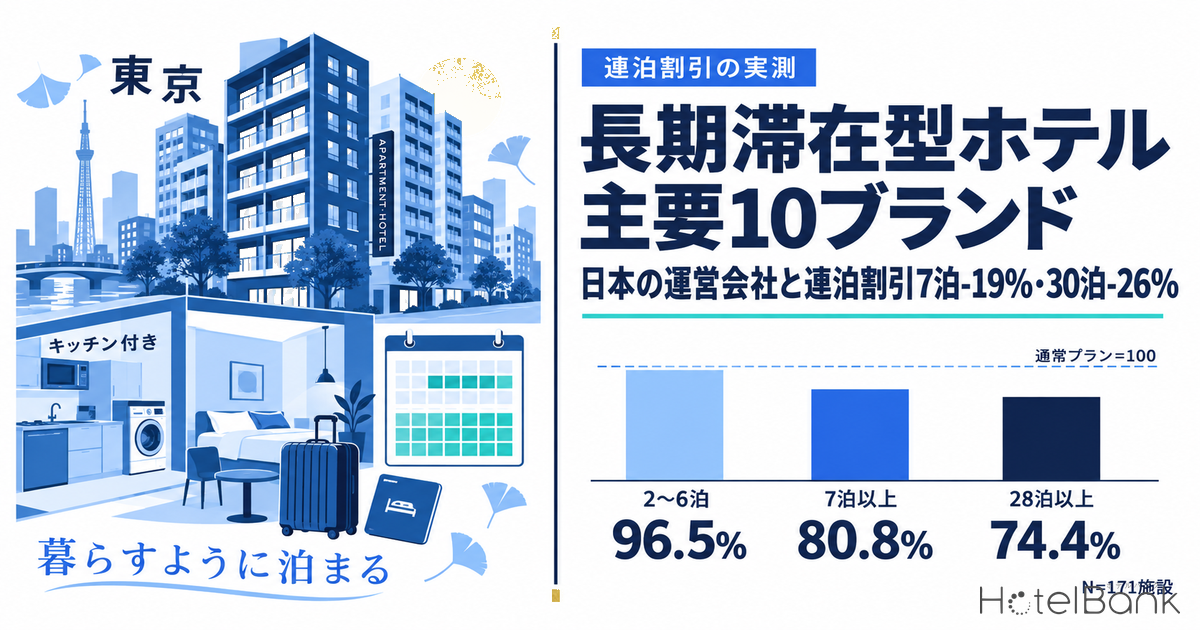
- — Long-stay discounts step down at two thresholds: 7 nights and 30 nights. Relative to standard plans, prices sit at 96.5% for 2–6 nights, 80.8% for 7–13 nights, and 74.4% for 28+ nights (N=171 properties, measured medians).
- — In high-demand areas such as Chuo Ward, Taito Ward (Tokyo) and Shimogyo Ward (Kyoto), the ratio to standard plans is around 100%, with almost no step-down. The same “long-stay plan” plays a different role depending on the area.
- — About 74% (by property count) of the major brand groups’ 215 properties and 28,452 rooms are concentrated in Japan’s three largest metropolitan areas, while expansion into regional hubs such as Hokkaido, Ishikawa and Hiroshima is also under way.
- — Tokyo’s ADR paused its growth in August 2026 at ¥11,800, -9.2% YoY. As rates flatten, models that lengthen stays and reduce how often variable costs are incurred gain an advantage.
Metric Definitions Used in This Article
- Listed price: The selling price each property publishes on OTAs and similar channels — the per-room rate for two guests sharing one room (tax included). Note that apartment-type properties include rooms for 4–6 guests, so their per-room listed prices are higher than those of limited-service hotels.
- Long-stay plan: A plan whose name explicitly states a length-of-stay condition, such as consecutive nights, weekly, monthly, long stay, or “X nights or more”.
- Ratio to standard plans: For the same property and the same check-in date, the median listed price of long-stay plans ÷ the median listed price of all other plans. It is calculated daily for each property, and the median is used as the property’s representative value. Differences in room type and meal conditions are not fully removed, so this is not the designed discount rate itself but an indicator of the relative level of prices actually offered in the market.
- ADR (average daily rate): An estimated settled rate (tax-exclusive equivalent), calculated by applying segment-specific adjustment factors to the lowest-plan level each property publishes on OTAs (two guests per room, per-room rate, tax included). Checked against property-level results disclosed by listed hotel REITs (91 properties, most recent 3 months), the median error is about 7%. These are estimates and differ from each property’s actual settled prices and accounting figures. Area-level ADR is the median of the properties covered (the level of a typical property in the area).
- Data source: MetroEngines Research
The 10 Major Brands Shaping Extended Stay in Japan (Japanese Syllabary Order)
“Extended stay” covers brands of three broadly different origins: (1) international brands run by Singapore-based serviced-apartment operators, (2) brands launched as hotel businesses by domestic developers and real estate companies, and (3) hotel-tech start-ups founded on inbound group and family demand. Room size, whether a kitchen is provided, front-desk staffing, and assumed length of stay all follow a different design philosophy depending on that origin.
The table below lists 10 brands that promote long-stay capability as a core feature, in Japanese syllabary order. Scale figures are quoted as published by each company or source, and the basis of the count (directly operated only, whole group, or single brand) differs by operator. The table therefore does not rank the brands against each other; read it as a list of the scale each company itself discloses.
| Brand | Operator / developer | Published scale (date, source) | Long-stay features |
|---|---|---|---|
| Ascott / Oakwood / Citadines and others (アスコット/オークウッド/シタディーン) | Ascott Japan (The Ascott Limited) | Plans to roughly double its lodging properties in Japan to 40 within the next five years (November 2024, Nikkei) | The international standard for serviced apartments. Full kitchens, weekly housekeeping, and long-term corporate contracts |
| Villa Fontaine (ヴィラフォンテーヌ) | Sumitomo Realty Villa Fontaine (Sumitomo Realty & Development) | 23 properties listed on the official hotel list (as of September 11, 2026, official website) | Concentrated in Tokyo’s three central wards. Strengths in slightly larger rooms and corporate-member bookings |
| Section L (セクションL) | Section L Inc. | 12 buildings in Tokyo since its founding in 2020 (as of January 2026, company announcement) | Specializes in inbound long stays with an average stay of 6 nights. Grows through management contracts with institutional real estate investors |
| Tokyu Stay (東急ステイ) | Tokyu Stay Service (Tokyu Land Corporation) | 31 hotels, 5,192 rooms (as of April 1, 2023, Tokyu Land official website). Openings have continued since; Shibuya Ebisu, opened March 17, 2026, is the chain’s 33rd hotel | Washer-dryers and mini-kitchens standard in guest rooms. Official medium- to long-stay plans of up to 31 nights |
| Hyatt House (ハイアット ハウス) | Hyatt Japan | 2 hotels in Japan (Tokyo Shibuya, 126 rooms / Kanazawa, 92 rooms; as of April 2026) | An international chain’s extended-stay format centered on suites with kitchens |
| FAV HOTEL (ファブ ホテル) | fav hospitality group (Kasumigaseki Capital) | The group’s hotels total 22 properties and 2,058 rooms across several brands (as of August 12, 2026, company announcement) | Condominium-style, with a kitchen and washing machine in every room. Notable for expansion into major regional cities |
| Flexstay Inn (フレックステイイン) | Iconia Hospitality (formerly MyStays Hotel Management) | The company manages 179 buildings and 24,122 rooms (as of May 2025, company); Flexstay Inn is one of its brands for medium- to long-term stays | Rooted in weekly-apartment operations; flexible from one night to monthly stays |
| MONday Apart (マンデイ アパート) | JHAT Inc. | As hotel MONday Group: 24 properties in Tokyo, 5 in Kyoto and 1 in Osaka (as of the January 30, 2026 announcement, company) | An “apart-hotel” including a premium line with all rooms 35㎡ or larger. Equipped with kitchens for self-catering and automatic washer-dryers |
| MIMARU (ミマル) | Cosmos Hotel Management (Cosmos Initia / Daiwa House Group) | 28 properties, 1,500 rooms in total (as of the September 1, 2026 opening). Targets 3,000 rooms by 2030 | Spacious rooms from about 40㎡ serving family and group demand. Kitchens and dining areas included |
| Minn (ミン) | SQUEEZE Inc. | “Minn Namba South,” opened July 10, 2026, is its 7th property in the Osaka area (company announcement) | Apartment-type, including rooms for up to 10 guests. Operated remotely through a cloud reception system |
Source: Compiled by the HotelBank Editorial Team from company disclosures and press reports (Hyatt House: Hyatt Japan, “Press Release, April 2026”)
Many other chains also offer medium- to long-stay plans beyond those in the table. Chains such as Kyoritsu Maintenance’s Dormy Inn — limited-service hotels with large public baths that still capture multi-night demand — serve as an option when business trips grow longer. Treating extended stay as “a market for dedicated brands only” misreads the actual competitive landscape.
Long-Stay Discounts Step Down at 7 Nights and 30 Nights — Measured Listed Prices
A list of brands alone does not reveal how this market makes money. The economics of long stays come down to a trade-off: how much of the nightly rate to give up as the stay lengthens, and in return how many nights of inventory to lock in. We therefore aggregated the prices that properties in the brand groups above actually offer in the market.
The sample is the 171 properties, out of the major brand groups promoting long-stay capability (11 groups, 215 properties), for which both long-stay and standard plans were listed on at least 10 check-in dates between September 15 and October 15, 2026. For each property and check-in date, we compared the median listed prices of the two and derived a representative value for each property.
Overall, long-stay plans were listed at 95.0% (median) of standard plans. That single figure, however, mixes plans with different conditions. Split by the length-of-stay condition stated in the plan name, pricing clearly steps down.
Source: MetroEngines Research; compiled by the HotelBank Editorial Team
Plans conditioned on 2–6 nights stay at 96.5% of standard plans (N=50 properties), so the nightly level barely moves. For 7–13 nights the ratio drops to 80.8% (N=44), and for 28+ nights to 74.4% (N=29). The picture is one of step-downs of about 19% and about 26% at two thresholds — one week and one month. Plans conditioned on 14–27 nights were found at only 2 properties and are excluded here.
| Length-of-stay condition | Ratio to standard plans (measured median) | Example length of stay | Locked-in revenue at standard rate | Check-ins incurred |
|---|---|---|---|---|
| 2–6 nights | 96.5% | 3 nights | 2.9 nights’ worth | 1 |
| 7–13 nights | 80.8% | 7 nights | 5.7 nights’ worth | 1 |
| 28+ nights | 74.4% | 28 nights | 20.8 nights’ worth | 1 |
Source: MetroEngines Research; compiled by the HotelBank Editorial Team (ratios to standard plans are measured medians, N=171 properties. Lengths of stay illustrate the lower bound of each band, not the actual distribution of booked stays)
Table 3 simply multiplies the measured ratio to standard plans by the length of stay. A single 7-night booking gives up 19.2% per night but locks in 5.7 nights’ worth of revenue at the standard rate in one booking; a 28-night booking locks in 20.8 nights’ worth. Filling the same nights with one-night bookings would nominally yield 7.0 or 28.0 nights’ worth, but booking acquisition, check-in work and cleaning would then occur as many times as there are nights, and any unfilled night stays empty. The rate concession is, in effect, the price paid for that difference in frequency and for the vacancy risk.
From the operator’s side, the meaning of these steps is easy to see. Stays of a few nights are an extension of ordinary lodging demand, so there is little need to concede on price. Bookings of 7 or 30 nights, by contrast, compress cleaning frequency, check-in work and vacancy risk all at once, so a lower rate can still pay off on a GOP basis. Indeed, many long-stay plans are designed together with operating conditions such as “no room cleaning” or “linen change every few days.” The rate concession can be read directly as a reflection of variable-cost savings and operational design.
These levels are also deeper among long-stay-focused brands than in our measurement of consumer long-stay discounts (about 15% at 7 nights and about 20% at 30 nights). Dedicated brands build their rooms and operations around long stays, which likely makes it easier for them to fund the discount.
Price Levels by City — In Central Districts, Long-Stay Plans Don’t Discount Either
Looking at the same data by city (ward or municipality) shows that where long-stay plans are priced changes with supply and demand. The table covers the 10 areas with 5 or more properties in the sample.
| Area | Properties | Long-stay plan listed price (median, per room) | Ratio to standard plans |
|---|---|---|---|
| Tokyo, Chuo Ward | 16 | ¥58,000 | 102% |
| Tokyo, Minato Ward | 15 | ¥41,000 | 100% |
| Tokyo, Taito Ward | 13 | ¥65,200 | 101% |
| Tokyo, Shinjuku Ward | 9 | ¥43,500 | 95% |
| Tokyo, Chiyoda Ward | 8 | ¥30,100 | 96% |
| Osaka, Chuo Ward (Osaka City) | 8 | ¥22,800 | 90% |
| Kyoto, Shimogyo Ward (Kyoto City) | 7 | ¥67,400 | 101% |
| Hokkaido, Chuo Ward (Sapporo) | 6 | ¥19,500 | 88% |
| Kyoto, Nakagyo Ward (Kyoto City) | 6 | ¥53,800 | 98% |
| Tokyo, Ota Ward | 5 | ¥20,200 | 93% |
Source: MetroEngines Research; compiled by the HotelBank Editorial Team (N=171 properties; check-ins September 15 – October 15, 2026)
Absolute listed prices directly reflect differences in room design. Taito Ward and Shimogyo Ward (Kyoto) are high at around ¥65,000 because apartment-type properties for 4–6 guests are concentrated there; converting the per-room rate to a per-person rate changes the picture. These figures should not be compared on the same yardstick as Chiyoda Ward, Ota Ward and Chuo Ward (Sapporo), where business-oriented properties dominate and prices fall in the ¥19,000–¥30,000 range.
The column worth attention is the ratio to standard plans on the far right. In areas with strong inbound demand — Chuo Ward, Taito Ward and Shimogyo Ward (Kyoto) — long-stay plans are listed at the same level as standard plans or slightly above. Beyond the fact that long-stay plans themselves are tied to larger room types, when demand is strong there is little need to trade rate for length of stay. By contrast, some areas concede relatively more: Chuo Ward (Osaka City) at 90% and Chuo Ward (Sapporo) at 88%. Even under the same “long-stay plan” label, whether it acts as a demand-generation tool or as a way to lock in inventory differs by area.
Where Supply Is Concentrated — Properties and Rooms by Prefecture
Next, we look at where in Japan these major brand groups’ properties are located. The sample is the same 11 groups and 215 properties as in the previous section (28,452 rooms in total; median of 108 rooms per property). It does not cover all long-stay supply in the market; read it strictly as the distribution of the major brand groups.
Source: MetroEngines Research; compiled by the HotelBank Editorial Team (N=215 properties, 28,452 rooms)
Tokyo accounts for more than half of both properties and rooms, with 116 properties and 14,407 rooms. Osaka (25 properties, 2,873 rooms) and Kyoto (17 properties, 1,211 rooms) follow, and the three largest metropolitan areas make up about 74% of the total by property count. Kyoto has few rooms relative to its property count — an average of 71 rooms per property — showing a small, dispersed format. This reflects a different supply model that includes machiya townhouses and conversions of existing buildings.
At the same time, expansion into regional hubs is progressing: Hokkaido with 13 properties and 2,332 rooms, Ishikawa with 4 properties and 819 rooms, and Hiroshima with 2 properties and 466 rooms. Acquisition prices in the regions are lower than in city centers, making it easier to secure larger rooms. In some areas, capturing long-staying inbound visitors and medium- to long-term business travel tied to construction or projects could smooth occupancy more than in urban locations. Regional long-stay supply also connects to Japan’s dual-residence policy: across the 28 municipalities designated for dual-residence promotion, long-stay-type rooms account for only 6.0% of 27,123 rooms at 1,363 properties.
What Long Stays Mean in a Market Where Rates Have Flattened
The growth of the long-stay segment is not unrelated to the changing rate environment. Overlaying Tokyo’s ADR (estimated settled rate) year by year shows that the rise from 2024 to 2025 paused in 2026, and recent months have repeatedly come in below the same month of the prior year.
Source: MetroEngines Research; compiled by the HotelBank Editorial Team (Tokyo; N=1,100–1,150 properties per month)
Tokyo’s ADR in August 2026 was ¥11,800, down 9.2% from the same month a year earlier (¥13,000). April, the spring peak, held at ¥17,800 (+5.2% YoY), so the year is not weak throughout, but summer levels have clearly stepped down. When rate growth slows, stable occupancy and lower variable costs drive profitability. The long-stay model — lengthening stays to reduce how often cleaning and check-in work occur — is exactly what pays off in this phase.
Demand-side conditions are also in place. According to the Japan National Tourism Organization (JNTO), international visitor arrivals in 2025 reached 42.68 million, up 15.8% year on year and a record high. As Section L reports an “average stay of 6 nights” among its own guests, stays are clearly lengthening in certain segments. Domestically, demand premised on stays of several weeks — such as dual residence and workations — is also being supported by policy.
Four Points Operators and Investors Should Keep in Mind
1. Evaluate room design by “area per guest,” not by “area.” From MIMARU’s roughly 40㎡ to MONday Apart’s premium line with every room at 35㎡ or more, rooms at dedicated brands are about twice the size of limited-service hotel rooms. Per-room listed prices look high because capacity is larger; what matters for investment decisions is not the per-room rate but revenue per unit of floor area. The per-floor-area NOI structure of apartment hotels is a separate topic for analysis in its own right.
2. Design the discount together with the variable-cost savings. As shown above, market-level step-downs of about 19% at 7+ nights and about 26% at 28+ nights exist. Treating this gap as a mere discount hurts profitability, but designing it together with operating conditions — cleaning frequency, linen changes and amenity replenishment — preserves gross margin even with a lower rate. Indeed, many long-stay plans on the market state their cleaning conditions explicitly.
3. The cost structure of operations creates brand differences. Designs that bundle multiple sites onto a single operating platform — such as SQUEEZE’s cloud reception and remote operations — have become a prerequisite for dominant rollout of small properties. Section L’s growth in building count through management contracts with institutional real estate investors likewise depends on standardized operations. Because long stays involve less frequent guest contact, they pair well with technology-driven labor savings.
4. The longer the stay, the larger the share of direct and corporate sales. Stays beyond 30 nights fit well with direct sales and corporate contracts, both in terms of OTA commission structures and the practicalities of credit checks and billing. Tokyu Stay promoting medium- to long-stay plans of up to 31 nights on its official site, and Villa Fontaine maintaining corporate-member bookings, are designs consistent with this logic. Competition for long stays is becoming less about price and more about contract structure and operational design.
Conclusion
Japan’s extended-stay market is structured around three parallel lineages: international serviced apartments, domestic developer brands, and hotel-tech start-ups. Published scale ranges from a handful to several dozen properties per company, and the basis of the counts differs, so ranking them side by side by scale means little. What matters instead is the difference in design: which length-of-stay band each brand targets, and with what room design and operations.
On pricing, our measurements confirmed step-downs of about 19% and about 26% relative to standard plans at two thresholds, 7 nights and 30 nights (N=171 properties). In central areas where demand is concentrated, those step-downs barely occur. In a market where rates have flattened, the advantage of models that lengthen stays and compress variable costs is likely to become even clearer.
Related Articles
- Japan Hotel Long-Stay Discounts: 15% at 7 Nights, 20% at 30 Nights
- Business Hotels for Long Stays: 6 Checks and ¥16,722 a Night in Tokyo
- 60 Nights in a Japanese Hotel: ¥790,000 in Tokyo, ¥488,000 in Osaka
References and Sources
■ Data Sources
We collected the listed prices published on OTAs and similar channels by 215 properties (28,452 rooms in total) across 11 brand groups that promote long-stay capability as a core feature. Price comparisons use check-in dates from September 15 to October 15, 2026, and cover the 171 properties where both long-stay and standard plans were observed on at least 10 dates. ADR (estimated settled rate) uses the monthly aggregate for Tokyo (1,100–1,150 properties per month). Brand scale figures are quoted directly from company disclosures and press reports.
■ Calculation Assumptions
The ratio to standard plans is the median listed price of long-stay plans divided by the median listed price of other plans for the same property and check-in date, calculated daily; the median of those values is each property’s representative value, and the median across properties is reported. Length-of-stay bands are stratified by the condition stated in the plan name. “Locked-in revenue” in Table 3 is arithmetic multiplying the measured ratio by the lower-bound nights of each band; it is not a profit-and-loss estimate reflecting cost structure or the actual distribution of booked stays.
■ Limitations
Listed prices are not settled prices, and differences in room type, meal conditions and capacity are not fully removed. The ratio to standard plans is therefore not the designed discount rate itself but an indicator of the relative level of prices offered in the market. Plans conditioned on 14–27 nights were found at only 2 properties and were excluded. The property distribution covers only the major brand groups and does not represent all long-stay supply. Because each company’s published scale differs in date and basis (directly operated / whole group / single brand), the figures cannot be read as a ranking.
■ Market Data
- MetroEngines Research — listed-price data (long-stay plan price aggregation N=171 properties; brand-group property distribution N=215 properties), ADR (estimated settled rate)
■ Company Disclosures and Press Reports
- Cosmos Initia targets 3,000 apartment-hotel rooms by 2030; 28th property opens in Shinsaibashi, Osaka (Housing Industry Newspaper, September 8, 2026; Japanese)
- Apartment hotel “MIMARU” resumes new openings toward 3,000 rooms by 2030 (Daiwa House Group, August 26, 2026; Japanese)
- [New opening] “Premium Apart MONday Hamamatsucho Station” in Hamamatsucho, Tokyo (JHAT Inc., January 30, 2026; Japanese)
- SQUEEZE opens “Minn Namba South,” accommodating up to 157 guests, on July 10 (SQUEEZE Inc., July 10, 2026; Japanese)
- SQUEEZE expands partnership with Kasumigaseki Capital; “FAV LUX Asahikawa” to open February 2027 (August 12, 2026; Japanese)
- “Section L Akihabara” opens February 1, 2026 — first entry into Chiyoda Ward (Section L Inc., January 29, 2026; Japanese)
- Tokyu Stay | Hotels | Wellness Business (Tokyu Land Corporation; Japanese)
- Sumitomo Realty Hotel Villa Fontaine official website
- MyStays Hotel changes its name to “Iconia Hospitality” (Travel Voice, May 30, 2025; Japanese)
- Ascott to double its lodging properties in Japan to 40, expanding into regional areas (Nikkei, November 2024; Japanese)
- Hyatt Japan, “Press Release, April 2026”
■ Government and Official Statistics