

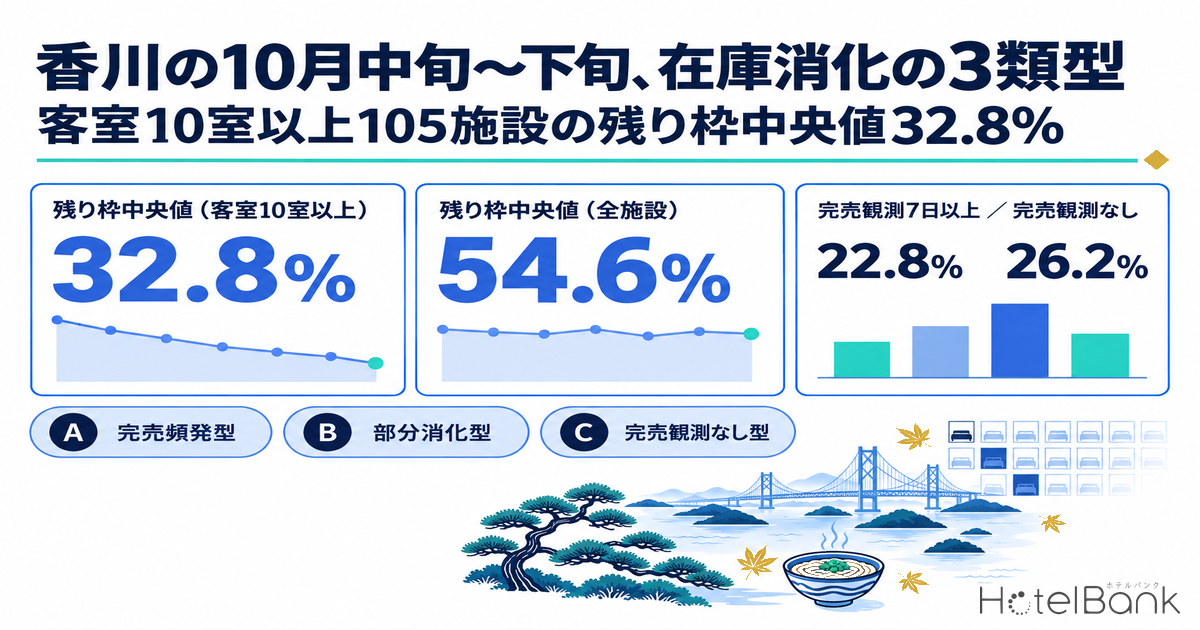
We measured how listed inventory was being absorbed across accommodation properties in Kagawa Prefecture’s 17 municipalities over the 14 stay dates from October 11 to 24, 2026. Across the 237 properties and 7,574 rooms in scope, the median share of remaining inventory (listed inventory as a percentage of total rooms, averaged over the 14 days) was 54.6%. That figure is heavily pulled by property size, however: narrowing to the 105 properties with 10 or more rooms (7,257 rooms), the median falls to 32.8% (p25 15.9%, p75 57.4%). The median number of days on which listed inventory could no longer be observed (hereafter “sold-out observation days”) was 2 out of 14. Fifty-four properties (22.8%) had seven or more such days, while 62 (26.2%) had none — within the same prefecture, over the same two weeks, the shape of absorption splits sharply. This article groups that distribution into three anonymous types and sets out what each one suggests a hotel should check in its own inventory design.
About the data in this article | Scope: Kagawa Prefecture (Takamatsu and the Seto Inland Sea area), all property categories, N=237 properties / 7,574 rooms (properties meeting the listing conditions, across 17 municipalities). The estimated occupancy series uses a fixed cohort of N=199-201 properties / 5,799 rooms in the same prefecture. Occupancy is an estimate based on listed OTA inventory; the definition is given at the end of the article. This article covers the distribution of inventory absorption and does not address price levels (estimated settled ADR). Data as of September 13, 2026.
- — 32.8%: median remaining inventory across the 105 properties with 10 or more rooms (p25 15.9%, p75 57.4%). That is roughly 22 points below the 54.6% for all 237 properties, so a hotel needs to benchmark itself within its own size band.
- — 3 rooms vs 24 rooms: the median room count of the 54 properties with seven or more sold-out observation days, versus the 62 properties with none. Sold-out day counts tend to reflect how small the inventory is rather than how far absorption has progressed.
- — 21.4 points: the spread in latest estimated OCC across stay dates (74.3% on Friday, October 23 down to 52.9% on Tuesday, October 20; N=199-201 properties). Peak days and trough days call for different moves.
Demand across mid-to-late October — peaks on the holiday Sunday and Saturdays, a trough on Tuesday
Start with the backdrop for the period, measured as prefecture-level estimated OCC (listed-inventory basis). The chart below places, for each stay date from October 11 to 24, the estimated OCC as of 45 days before the stay date alongside the latest observation (fixed cohort of N=199-201 properties / 5,799 rooms; the latest observation sits 29 to 42 days before each stay date).
Source: MetroEngines Research; compiled by the HotelBank Editorial Team
At the latest observation, the highest reading is 74.3% on Friday, October 23, followed by 71.5% on Saturday, October 17 and 70.8% on Sunday, October 11. The lowest is 52.9% on Tuesday, October 20, leaving a spread of 21.4 points between top and bottom. October 11 falls in the middle of the three-day weekend running from Saturday, October 10 through Monday, October 12 (Sports Day), and it gained 9.6 points from 61.2% at the 45-day mark — the largest build of any of the 14 dates. On the weekday side, Monday, October 19 added 3.8 points and Tuesday, October 20 added 3.1 points, but the levels themselves stay in the low 50s.
Saturday, October 17, by contrast, reads 71.5% at the latest observation against 73.3% at the 45-day mark — slightly down in numerical terms. Because estimated OCC on a listed-inventory basis falls when the denominator (listed rooms) grows, that movement does not indicate bookings being lost; it suggests inventory was added to the market during the period. The natural reading is that a number of properties released additional rooms once Saturday demand had become legible. The same thing shows up on Saturday, October 24, which moved from 67.1% at 45 days out to 67.3% at the latest observation — essentially flat.
To see how the build-up differs, we overlaid the booking curves from 45 days out to the latest observation for three dates: the two peaks (Sunday, October 11 and Saturday, October 17) and the trough (Tuesday, October 20).
Source: MetroEngines Research; compiled by the HotelBank Editorial Team
The three curves are clearly different in shape. Sunday, October 11 climbs consistently from 61.2% at 45 days out to 70.8% with 29 days to go. Saturday, October 17 starts high — already 73.3% at the 45-day mark — and then moves sideways in a 70-74% band, either because it finished building early or because added inventory and absorption are offsetting each other. Tuesday, October 20 moves from 49.8% to 52.9%, a gain of 3.1 points, with the slope essentially flat throughout. Even within one prefecture and one two-week window, where the remaining headroom sits is a different question for every stay date.
Three types of inventory absorption — sorted by sold-out days, properties split into roughly quarters
From here the unit of analysis shifts to the individual property. The scope is the 237 properties across Kagawa’s 17 municipalities whose maximum listed inventory during the observation window reached at least 30% of total rooms (a condition that excludes properties listing only a small slice of their rooms). Sorting them by the number of days out of 14 on which listed inventory could no longer be observed (sold-out observation days) produces three types.
| Type | Definition (out of 14 days) | Properties | Share | Median remaining inventory | Median room count | Main property categories |
|---|---|---|---|---|---|---|
| A Frequently sold out | 7 or more sold-out days | 54 | 22.8% | 21.4% | 3 rooms | Vacation rentals 13, guesthouses 10, ryokan 7, business hotels 7 |
| B Partial absorption | 1-6 sold-out days | 121 | 51.1% | 64.3% | 4 rooms | Vacation rentals 34, business hotels 27, guesthouses 14, hostels 13 |
| C No sold-out observed | 0 sold-out days | 62 | 26.2% | 65.7% | 24 rooms | Business hotels 27, guesthouses 10, ryokan 8, resort hotels 6 |
Source: MetroEngines Research; compiled by the HotelBank Editorial Team (N=237 properties, as of September 13, 2026)
A total of 175 properties had at least one sold-out observation day. Of those, 162 included a day on which listed inventory had already become unobservable 45 or more days before the stay date. Limiting to the 105 properties with 10 or more rooms, 59 of the 64 with any sold-out observation show the same pattern. These are records of past observations, though, and every stay date in scope still lies in the future, so the picture can change as inventory is added or cancellations come back. This article does not forecast future sell-outs; it describes whether listed inventory could be observed at the time of measurement. For the same “sold-out days × remaining inventory” lens applied to a single property category, see Yamagata Business Hotels: 3 Absorption Types, 7.2% vs 19.9% Left.
“Sold-out days” reflects inventory size, not how far absorption has progressed
The striking thing in the three-type table is that Type A — the most frequently sold out — has a median of 3 rooms, while Type C, with no sold-out observations at all, has a median of 24 rooms: the opposite of the intuitive ordering. Breaking the data out by room-count band makes the structure plain.
Source: MetroEngines Research; compiled by the HotelBank Editorial Team
| Room-count band | Properties | Median remaining inventory | Median sold-out days | No sold-out observed | 7 or more sold-out days |
|---|---|---|---|---|---|
| 1-4 rooms | 113 | 71.4% | 3 days | 16 properties (14.2%) | 32 properties (28.3%) |
| 5-9 rooms | 19 | 42.0% | 2 days | 5 properties (26.3%) | 7 properties (36.8%) |
| 10-29 rooms | 35 | 54.6% | 1 day | 12 properties (34.3%) | 7 properties (20.0%) |
| 30-99 rooms | 41 | 27.1% | 1 day | 20 properties (48.8%) | 5 properties (12.2%) |
| 100 rooms or more | 29 | 22.3% | 1 day | 9 properties (31.0%) | 3 properties (10.3%) |
Source: MetroEngines Research; compiled by the HotelBank Editorial Team (N=237 properties, as of September 13, 2026)
The 29 properties with 100 or more rooms show the most advanced absorption, with a median remaining inventory of 22.3%, yet only 3 of them (10.3%) had seven or more sold-out observation days. The 113 properties with 1-4 rooms are the mirror image: they hold the most inventory back, with a median of 71.4% remaining, but 32 of them (28.3%) recorded seven or more sold-out days — the highest share of any band. When a property lists only a handful of rooms, a single booking fills the entire allocation, so sell-outs occur frequently on a daily basis and reverse the next day. In other words, a ranking by sold-out days is less a measure of absorption progress than a reflection of how small the inventory is. Mixing the two when discussing absorption across the prefecture leads a hotel to misread where it stands. On how absorption speed itself varies with property size, Do Big Hotels Fill Last? 200+ Rooms Lead by 25.8pt at LT90 digs into the question using national data.
Narrowing to the 105 properties with 10 or more rooms (7,257 rooms), which is closer to hotel operating practice, median remaining inventory is 32.8%, with a quartile range of 15.9% to 57.4%. The median number of sold-out observation days is 1; 41 properties (39.0%) had none and 15 (14.3%) had seven or more. Compared with the full distribution (median 54.6%, median 2 sold-out days), remaining inventory is distinctly lower and sell-outs appear more muted. For comparing properties that carry hotel-scale inventory against one another, the distribution across these 105 properties is the realistic benchmark.
By property category (measured across all 237 properties, not only those with 10 or more rooms), the 7 city hotels show the most advanced absorption at a median of 15.7% remaining, and all 7 recorded at least one sold-out observation day. The 26 ryokan sit at a median of 22.6% remaining with a median of 3 sold-out days. The 61 business hotels post a median of 41.9% remaining and a median of 1 sold-out day, with 27 of them (44.3%) recording none — the largest such group. The 12 resort hotels show a median of 50.3% remaining and a median of 0.5 sold-out days.
Sell-outs by day of week — concentrated on the holiday Sunday and Saturdays
Looking at the share of the 237 properties with a sold-out observation on each of the 14 stay dates, Sunday, October 11 (the middle of the three-day weekend) is highest at 44.3%, followed by Saturday, October 24 at 40.5% and Saturday, October 17 at 37.1%. The lowest is Tuesday, October 20 at 14.8%, with weekdays generally sitting in a 15-25% band. Restricting to the 105 properties with 10 or more rooms compresses the range: the peak becomes 25.7% on Saturday, October 17 and the floor 9.5% on Monday, October 19 and Tuesday, October 20.
Sell-outs clustering later in the week is not unusual in itself. What deserves attention is not the difference in level but the difference in range. The 29.5-point gap between days of the week across all properties narrows to 16.2 points among those with 10 or more rooms. Properties with small inventories close all at once at the weekend and open all at once on weekdays — a far more volatile pattern. Applying the prefecture-wide sold-out share directly to a hotel’s own read on supply and demand will lead larger properties, in particular, to overestimate the weekend.
For revenue managers running properties in Kagawa (Takamatsu and the Seto Inland Sea area) — implications and an action plan
(1) Benchmark against your own size band, not the prefecture as a whole. The 54.6% median remaining inventory for all properties and the 32.8% for those with 10 or more rooms differ by nearly 22 points. The median is 27.1% for the 30-99 room band and 22.3% for 100 rooms or more. If your average remaining inventory over these 14 days sits well above that level, it is worth separating out whether absorption is genuinely lagging or inventory is being held back deliberately.
(2) Do not read a high sold-out day count as proof of strong sales. The 54 properties with seven or more sold-out days have a median of 3 rooms: the smaller the inventory, the more often it closes. The 62 properties with no sold-out observations, by contrast, have a median of 24 rooms. Even with zero sold-out observations, if your remaining inventory is in line with the median for your size band, absorption itself is most likely average.
(3) The headroom left differs by stay date. Sunday, October 11 built estimated OCC by 9.6 points between the 45-day mark and the latest observation, whereas Saturday, October 17 was already at 73.3% at 45 days out and has since moved sideways in a 70-74% band. Tuesday, October 20 has stalled at 52.9%. Rather than applying uniform promotion across all 14 days, separate the roles: check for missed pickup on the peak days, and create demand on the trough days.
(4) The dip in estimated OCC on Saturdays reads as a question about how inventory is released. Levels barely moving from the 45-day mark on October 17 and 24 suggests that added inventory and absorption are offsetting each other. Releasing rooms later on a strong day is a legitimate option, but if the timing slips, a hotel narrows its own opportunity to build rate on its strongest dates. There is room to revisit the release plan for strong days of the week as a design decision for the period as a whole.
The following is an action plan for the period in scope (October 11-24), organized by time horizon. Every decision trigger is tied to a figure presented in this article.
| Time horizon | Action | Decision trigger (figures from this article) | Purpose |
|---|---|---|---|
| Today to this week | Lay out remaining inventory for all 14 days on one sheet and compare it with the median for your size band | Whether your period-average remaining inventory sits well above 27.1% (30-99 rooms), 22.3% (100 rooms or more) or 54.6% (10-29 rooms) | Separating days that are lagging from days where inventory is held back on purpose |
| Today to this week | For days showing sold-out observations, check whether the point at which you closed was intentional | Whether you are closing earlier than the distribution implies, given that 162 of the 175 properties with sold-out observations include days closing 45 or more days before the stay date | Avoiding lost opportunity from closing strong days out entirely too early |
| Today to this week | Lock in the inventory release plan for Sunday, October 11, Saturday, October 17, Friday, October 23 and Saturday, October 24 first | Whether latest estimated OCC on those four dates — 74.3% (Oct 23), 71.5% (Oct 17), 70.8% (Oct 11) and 67.3% (Oct 24) — is at least 14 points above the 52.9% on Tuesday, October 20, the trough of the period | A design that does not hold back inventory on strong days |
| Within two weeks | Prepare plan structures that give a reason to stay on trough weekdays (multi-night stays, area touring, early arrival) | Whether the gap to peak days is around 20 points, against 55.5% on Monday, October 19 and 52.9% on Tuesday, October 20 | Lifting weekdays and levelling out the period as a whole |
| Within two weeks | Where no sold-out observation appears across the 14 days, take stock of what is actually being listed (room types, occupancy conditions, meal plans) | Whether your remaining inventory exceeds the third quartile for your size band (57.4% for 10 rooms or more), given that having no sold-out observation is unremarkable — 41 properties (39.0%) among those with 10 or more rooms | Confirming that the inventory on sale is not unduly restricted |
| Looking to next month | Record these 14 days in three classes — peak, middle, trough — and use it as a template for calendar design from November onward | The fact that latest estimated OCC across the 14 days spanned 21.4 points | Improving the repeatability of inventory design that accounts for day of week and holidays |
Source: MetroEngines Research; compiled by the HotelBank Editorial Team
Summary — three yardsticks
First, match the comparison population on size. Median remaining inventory across Kagawa’s 237 properties is 54.6%, but across the 105 properties with 10 or more rooms it is 32.8%. Neither figure is more correct than the other; the point is simply that you cannot read your position without looking at the distribution for properties carrying inventory of the same scale.
Second, treat sell-out frequency and absorption progress as separate things. Properties with seven or more sold-out days have a median of 3 rooms; those with none have a median of 24. Sold-out day counts are an indicator of inventory size, while absorption progress is read from remaining inventory. Holding the two as distinct yardsticks makes the question to examine self-evident: for Type A (frequently sold out), “are we closing too early?”; for Type B (partial absorption), “how do we move the remaining days?”; for Type C (no sold-out observed), “is what we are listing appropriate in the first place?”
Third, design by stay date rather than by period. Latest estimated OCC from October 11 to 24 spanned 21.4 points, from 52.9% to 74.3%. Promotion applied to all 14 days as a block narrows the opportunity to build rate on peak days and falls short on trough days. The holiday Sunday, the Saturdays and the weekday trough call for different kinds of action altogether.
Metric Definitions Used in This Article
| Definition of estimated OCC | Occupancy on a listed-OTA-inventory basis = 100 − 100 × rooms remaining on OTA listings ÷ total rooms. The scope is a fixed cohort built from properties listing at least 30% of their total rooms on OTAs (the same set of properties for every stay date; this article states that property count as N=). It is an estimate based on how inventory offered for sale on OTAs is absorbed, and its definition differs from actual room occupancy (it reads high because rooms not listed are counted on the absorbed side). This article labels it “estimated OCC (listed-inventory basis)”. Target month: October 2026 (stay dates October 11-24, 2026). |
| Booking curve | Based on observations from 45 days before the stay date to the latest observation. For each stay date in this article, the latest observation falls 29 to 42 days before the stay date. All cumulative-progression charts are built solely from observations within 45 days of the stay date. |
| Remaining inventory and sold-out observation days | Remaining inventory = the average, over the 14 stay dates in scope, of listed inventory rooms as a share of total rooms. Sold-out observation days = the number of stay dates out of 14 on which a point was observed where listed inventory could no longer be confirmed on OTAs and similar channels. Sold-out property share = the share of properties for which listed inventory cannot be confirmed on OTAs and similar channels (estimated). Measurement is limited to properties whose maximum listed inventory during the observation window was at least 30% of total rooms. |
| On price metrics | This article does not address price levels (estimated settled ADR). For reference, estimated settled ADR is a settled price level (tax-exclusive equivalent) estimated from sales data on OTAs and similar channels (lowest-plan level × property-category coefficient, ensembled across multiple channels); past months are final values, while the current and future months are estimates based on current sales conditions. Median error against published operating results is 6.6%. |
| Breakdown of N | Property-level inventory absorption: Kagawa Prefecture, 17 municipalities, N=237 properties / 7,574 rooms meeting the conditions (of which 10 rooms or more: N=105 properties / 7,257 rooms; 1-4 rooms 113, 5-9 rooms 19, 10-29 rooms 35, 30-99 rooms 41, 100 rooms or more 29). By property category: business hotels 61, vacation rentals 50, guesthouses 34, ryokan 26, hostels 18, resort hotels 12, city hotels 7, other 29. Prefecture-level estimated OCC: fixed cohort of N=199-201 properties / 5,799 rooms (based on listings across major booking sites, observation coverage 99.5-100%). |
| Data as of | Data as of September 13, 2026. Sales conditions and inventory change daily, so the figures in this article are a snapshot at the time of measurement. Every stay date in scope falls after the measurement date, and the picture can change as inventory is added or cancelled. |
Source: MetroEngines Research; compiled by the HotelBank Editorial Team