

According to the Japan National Tourism Organization (JNTO), Japan received 3,442,100 international visitors in July 2026, +0.1% YoY and a record for the month of July. Growth in the total was close to flat. The breakdown by market, however, was anything but uniform. Taiwan reached 763,800 visitors (+26.4%), topping 700,000 in a single month for the first time. South Korea reached 894,700 (+31.9%) and Hong Kong 272,500 (+54.8%). China, by contrast, fell sharply to 428,200 (-56.1%). The total held steady while the market mix shifted underneath it.
On the ground, a shift in market mix shows up as a question of which prefectures gain guests. Taiwan has held near record levels and is less exposed to swings in total arrivals than other markets. This article aggregates 24 months of prefecture-by-nationality data from the Japan Tourism Agency’s Overnight Travel Statistics Survey (second preliminary release, through June 2026). It quantifies where Taiwanese guest nights are concentrated, along with the room stock and price levels available to absorb them.
Metric Definitions Used in This Article
- Guest nights: Nationality breakdown from the Japan Tourism Agency’s Overnight Travel Statistics Survey (covers facilities with 20 or more rooms). Unit: person-nights. In this article, “latest 12 months” is the total for July 2025–June 2026 and “prior 12 months” is July 2024–June 2025.
- ADR (Average Daily Rate): Estimated settled rate (tax-excluded equivalent), derived by applying property-type adjustment factors to the lowest published plan price on OTAs and similar channels (per room, two guests, tax-included). Checked against property-level results disclosed by listed hotel REITs (91 properties, latest 3 months), the median error is about 7%. These are estimates and differ from each property’s actual settled prices and accounting figures. Area-level ADR is the median of the covered properties (the level of a typical property in the area).
- OCC (Occupancy): Share of sold rooms in the total room count for an area (an estimate based on OTA inventory).
- Data sources: Japan Tourism Agency, Overnight Travel Statistics Survey; JNTO, Visitor Arrivals Statistics; MetroEngines Research
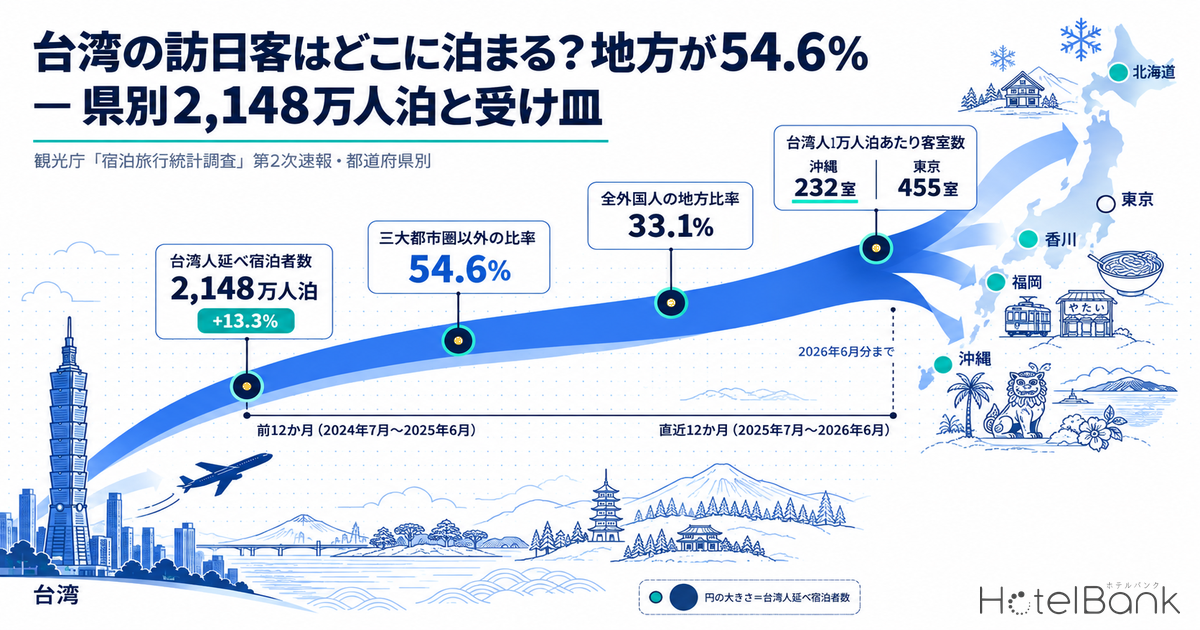
- — 21.48 million guest nights (+13.3%) — Taiwanese guest nights totaled 21,487,180 over the latest 12 months. With all international guest nights at -1.2%, Taiwan’s share rose 1.85 points, from 12.65% to 14.50%.
- — 54.6% outside the three major metro areas — about 1.65 times the 33.1% regional share for all international guests. Roughly 80% of the 2.51 million-night increase went to the 39 prefectures outside the major metros.
- — Room capacity: Okinawa 232 rooms, Tokyo 455 — Measured in rooms per 10,000 Taiwanese guest nights, the fastest-growing markets have relatively thin inventory: Okinawa, Kagawa (312), Hokkaido (361) and Fukuoka (368).
- — Traditional Chinese reviews focus on basic quality and access — Location overall (23.4%), room size (14.6%) and attentive service (12.8%) come up more often than in Japanese-language reviews (Tokyo, latest 24 months).
Taiwan: 21.48 Million Guest Nights in 12 Months, Share Up from 12.7% to 14.5%
Start with the national picture. Taiwanese guest nights totaled 21,487,180 over the latest 12 months, up 13.3% from 18,968,780 in the prior 12 months. Over the same period, total international guest nights were 148.16 million, down 1.2%. Taiwan grew by double digits while the overall market edged down, lifting its share 1.85 points, from 12.65% to 14.50%.
On a monthly basis, a defining feature of the Taiwan market is its shallower seasonal troughs. February 2026 was the largest single month at 2.37 million guest nights, reflecting the concentration in years when Lunar New Year falls in February. In addition, every month from January to June 2026 exceeded the same month a year earlier, six in a row.
Source: Compiled by HotelBank Editorial Team from Japan Tourism Agency, Overnight Travel Statistics Survey (second preliminary release)
Placing the share shifts side by side makes the asymmetry clear. China accounted for 20.18% in the prior 12 months but 14.83% in the latest 12 months, and Hong Kong fell from 4.90% to 4.34%. Taiwan (12.65%→14.50%), South Korea (11.93%→12.33%) and the US (11.03%→11.60%) took up that share. Note that JNTO’s single-month figures and 12-month cumulative accommodation statistics paint different pictures. Hong Kong was +54.8% in July 2026 alone, yet it is below the prior year on a 12-month cumulative basis. Single-month growth rates depend heavily on the prior-year base, so cumulative share is the more practical measure when assessing accommodation capacity.
Source: Compiled by HotelBank Editorial Team from Japan Tourism Agency, Overnight Travel Statistics Survey (second preliminary release)
54.6% of Taiwanese Guest Nights Fall Outside the Three Major Metros, vs. 33.1% for All International Guests
A prefecture-level breakdown reveals the Taiwan market’s most important trait. The eight prefectures of the three major metropolitan areas (Tokyo, Kanagawa, Chiba, Saitama, Aichi, Kyoto, Osaka and Hyogo) recorded 9,745,860 Taiwanese guest nights, or 45.4% of the national total. In other words, 54.6% stayed outside the major metros. For all international guests over the same period, the major metros took 66.9% and regional areas only 33.1%. Taiwan’s regional share is about 1.65 times that of international guests overall. For a cross-market view of which prefectures host each nationality, see our Prefecture Host Map 2026 by nationality.
Growth also diverged. Taiwanese guest nights in the eight major-metro prefectures rose 5.2% on the prior 12 months, while the other 39 prefectures grew 21.0%. That puts regional areas at roughly 80% of the 2.51 million-night increase.
Source: Compiled by HotelBank Editorial Team from Japan Tourism Agency, Overnight Travel Statistics Survey (second preliminary release)
Tokyo ranks first in absolute volume at 3,999,850 guest nights, but Taiwan accounts for only 8.2% of its international guest nights, below the national average. Conversely, some prefectures depend heavily on Taiwan even without large volumes. Taiwan accounts for 58.2% of international guest nights in Fukushima, 48.1% in Okayama, 47.8% in Iwate, 44.4% in Miyagi and 40.3% in Kagawa. In these prefectures, movements in the Taiwan market directly move the international guest share at properties.
Regional areas also stand out on growth rates. Among prefectures with 100,000 or more guest nights in the latest 12 months, the leaders were Hyogo (+49.3%), Okinawa (+44.2%), Aomori (+42.6%), Kagawa (+40.7%), Fukuoka (+32.5%), Oita (+28.2%) and Fukushima (+27.3%). Okinawa also posted the largest absolute increase nationwide, at +679,000 guest nights.
Room Capacity: Rooms per 10,000 Taiwanese Guest Nights — Okinawa 232, Tokyo 455
Next, we layer on the room stock available to serve this demand. For properties tracked by MetroEngines Research with confirmed active listings, we totaled room counts by prefecture and calculated rooms per 10,000 Taiwanese guest nights. A lower value means room inventory is relatively thin compared with Taiwanese demand.
Okinawa is the thinnest at 232 rooms, followed by Kagawa (312), Hokkaido (361) and Fukuoka (368). Tokyo (455) and Osaka (480) have larger volumes and correspondingly deeper inventory. Put differently, Okinawa, Kagawa and Fukuoka have few rooms per unit of Taiwanese demand. How much further growth from Taiwan they can absorb depends on pricing and inventory allocation.
| # | Prefecture | Taiwanese guest nights (latest 12 mo.) | vs. prior 12 mo. | Share of intl. guests | Rooms | Rooms per 10,000 nights | Est. settled ADR (June 2026) |
|---|---|---|---|---|---|---|---|
| 1 | Tokyo | 3,999,850 | +5.2% | 8.2% | 181,869 | 455 | ¥12,146 N=1,137 |
| 2 | Hokkaido | 2,570,890 | +18.0% | 22.8% | 92,700 | 361 | ¥10,334 N=949 |
| 3 | Osaka | 2,286,020 | -0.4% | 10.5% | 109,833 | 480 | ¥8,070 N=644 |
| 4 | Okinawa | 2,213,660 | +44.2% | 34.9% | 51,332 | 232 | ¥11,373 N=505 |
| 5 | Fukuoka | 1,477,340 | +32.5% | 20.3% | 54,368 | 368 | ¥10,324 N=473 |
| 6 | Kyoto | 1,198,220 | -0.6% | 8.3% | 52,891 | 441 | ¥11,362 N=588 |
| 7 | Aichi | 967,860 | +24.9% | 24.0% | 54,512 | 563 | ¥7,864 N=507 |
| 8 | Chiba | 482,120 | -13.9% | 11.7% | 49,365 | 1,024 | ¥8,995 N=413 |
| 9 | Miyagi | 479,690 | +20.6% | 44.4% | 26,193 | 546 | ¥8,229 N=291 |
| 10 | Kumamoto | 444,680 | +1.5% | 31.1% | 20,558 | 462 | ¥8,962 N=396 |
| 11 | Hyogo | 433,360 | +49.3% | 24.2% | 33,971 | 784 | ¥11,271 N=536 |
| 12 | Kagawa | 379,960 | +40.7% | 40.3% | 11,869 | 312 | ¥7,074 N=162 |
| 13 | Nagano | 359,720 | +0.2% | 19.5% | 34,259 | 952 | ¥9,969 N=796 |
| 14 | Kanagawa | 343,650 | +10.5% | 8.5% | 47,893 | 1,394 | ¥12,318 N=576 |
| 15 | Ishikawa | 322,960 | -7.7% | 17.5% | 19,518 | 604 | ¥9,107 N=238 |
| 16 | Okayama | 300,010 | +25.4% | 48.1% | 14,403 | 480 | ¥7,367 N=188 |
Source: Compiled by HotelBank Editorial Team from Japan Tourism Agency, Overnight Travel Statistics Survey (second preliminary release) / MetroEngines Research (room stock based on properties with confirmed active listings)
Price levels are worth adding as well. Estimated settled ADR in June 2026 was ¥11,400 in Okinawa (N=505 properties), ¥10,300 in Fukuoka (N=473), ¥7,100 in Kagawa (N=162) and ¥12,100 in Tokyo (N=1,137). Notably, prefectures with strong growth in Taiwanese guest nights are not necessarily high-rate markets. In Kagawa and Aomori (¥7,100, N=188 properties), for example, current rate levels lag well behind demand growth.
Source: Compiled by HotelBank Editorial Team from Japan Tourism Agency, Overnight Travel Statistics Survey (second preliminary release) / MetroEngines Research
Mapping Taiwanese Guest Nights
Plotting the top 20 prefectures on a map shows circles clustered along the urban Pacific belt and at the air hubs of Hokkaido, Okinawa, Fukuoka and Kagawa. Circle size shows Taiwanese guest nights, and color shows the direction of change vs. the prior 12 months.
Source: Compiled by HotelBank Editorial Team from Japan Tourism Agency, Overnight Travel Statistics Survey (second preliminary release)
Traditional Chinese Reviews Most Often Mention Location, Room Size and Attentive Service
After the quantity and price of capacity, we turn to quality. From guest reviews compiled by the HotelBank Editorial Team, we took reviews written in Traditional Chinese (zh-Hant) and compared how often each attribute was mentioned against Japanese-language reviews. For Tokyo, the sample is N=41,492 Traditional Chinese reviews and N=627,057 Japanese reviews (latest 24 months).
One caveat first: the language of a review is not the reviewer’s nationality. Traditional Chinese is also used in Hong Kong and Macau, so the figures below reflect guests who write in Traditional Chinese and do not map exactly onto Taiwanese guests. Even so, the gap versus Japanese reviews is a practical indicator of which attributes drive evaluations. We also used language-level review analysis to read lodging preferences in Rental-Car Inbound: Parking Mentioned 2.9x More in Traditional Chinese.
Source: HotelBank Editorial Team research (NLP analysis of guest reviews, Tokyo, latest 24 months, Traditional Chinese N=41,492 / Japanese N=627,057)
The biggest gaps are in four attributes: location overall (Traditional Chinese 23.4% / Japanese 13.2%), room size (14.6% / 9.0%), attentive service (12.8% / 5.8%) and value for money (11.1% / 6.8%). Proximity to the station ranks high for both (26.9% / 24.2%), slightly higher on the Traditional Chinese side. Conversely, friendly service is mentioned more often in Japanese reviews (Traditional Chinese 5.1% / Japanese 10.5%), and food overall also ranks high in Japanese reviews at 11.5%. The two groups weight their evaluations differently.
The focus varies by prefecture. In Okinawa (Traditional Chinese N=26,341), room size tops the list at 20.0%, followed by room cleanliness (19.6%), location overall (19.2%) and value for money (12.7%). Beach proximity (9.6%) and pools (6.6%) rank lower than in Japanese reviews (11.6% and 9.0%), so basic stay quality gets more attention than the resort facilities themselves. In Fukuoka (Traditional Chinese N=19,739), location overall (25.9%) and station proximity (23.9%) stand out, making urban access the key evaluation axis. In Kagawa (Traditional Chinese N=2,813), breakfast value for money (12.6%) and breakfast buffet (10.3%) rank higher than in Japanese reviews.
The common thread is clear. Compared with Japanese-language reviews, Traditional Chinese reviews more often mention basic quality (space, cleanliness, attentiveness and value) and access (stations, city centers and shopping). Even without capital investment, measures such as how room size is presented, careful guidance at check-in and information on nearby routes are likely to translate directly into better reviews.
Areas with Upside: Three Market Types
The data so far can be organized into opportunity types from a property’s perspective.
1. Markets Where Demand Is Growing Ahead of Supply
Okinawa (+44.2%, 232 rooms per 10,000 nights), Fukuoka (+32.5%, 368 rooms) and Kagawa (+40.7%, 312 rooms). These are among the thinnest markets nationwide in rooms relative to Taiwanese demand, so revisiting pricing and inventory allocation pays off directly.
2. Markets Highly Dependent on Taiwan
Fukushima (58.2% of international guests), Okayama (48.1%), Iwate (47.8%), Miyagi (44.4%) and Kagawa (40.3%). The international guest share at properties tracks the Taiwan market’s seasonality, so Traditional Chinese information and Lunar New Year planning are highly cost-effective.
3. High-Volume Markets with a Low Taiwan Share
Tokyo (8.2%), Kyoto (8.3%), Kanagawa (8.5%) and Osaka (10.5%). These are among the largest markets in absolute terms but have low Taiwan shares. There is still room to capture more by emphasizing the access and room size that Traditional Chinese reviews value.
Across all three types, the Taiwan market has a consistent profile: strong in regional areas, with shallow seasonal troughs, and focused on basic quality and access. When total arrivals are flat, differences in market mix matter more for each property’s occupancy and rates. Checking the Taiwan share at the prefecture level is a practical step when building 2027 budgets.
Summary
Taiwanese guest nights over the latest 12 months totaled 21.48 million (+13.3%). While total international guest nights fell 1.2%, Taiwan’s share rose from 12.65% to 14.50%, and 54.6% of those nights were outside the three major metro areas. That is about 1.65 times the 33.1% regional share for all international guests.
On the supply side, rooms per 10,000 Taiwanese guest nights were 232 in Okinawa, 312 in Kagawa, 361 in Hokkaido and 368 in Fukuoka: the faster a market is growing, the thinner its inventory tends to be. Traditional Chinese reviews mention location, room size, attentive service and value for money more often than Japanese reviews. Matching demand volume, inventory depth and evaluation criteria prefecture by prefecture is the most direct way to decide what to do next.
About the data: The nationality breakdown of the Overnight Travel Statistics Survey is an estimate covering facilities with 20 or more rooms; the latest month in the second preliminary release is June 2026. JNTO visitor arrivals are estimates based on entries and differ from the accommodation statistics in population and methodology. Estimated settled ADR and room stock cover properties tracked by MetroEngines Research with confirmed active OTA listings and exclude properties not listed on OTAs.
Related Articles
- US Now Tops Japan Inbound at 13.5% — Prefecture Host Map 2026
- Rental-Car Inbound: Parking Mentioned 2.9x More in Traditional Chinese
- Inbound Stay Length Varies 2.0x: Tokyo 2.32 vs Yamanashi 1.16 Nights
References and Sources
■ Data Sources
International guest nights by prefecture and nationality from the Japan Tourism Agency’s Overnight Travel Statistics Survey (second preliminary release; 24 months, July 2024–June 2026); JNTO Visitor Arrivals (July 2026 estimates); MetroEngines Research room stock and estimated settled ADR by prefecture (June 2026); tag mention rates in guest reviews by language (latest 24 months).
■ Calculation Assumptions
“Latest 12 months” is the total for July 2025–June 2026, and “prior 12 months” is July 2024–June 2025. The three major metro areas are the eight prefectures of Tokyo, Kanagawa, Chiba, Saitama, Aichi, Kyoto, Osaka and Hyogo. “Rooms per 10,000 guest nights” is each prefecture’s room count divided by Taiwanese guest nights (in units of 10,000). Estimated settled ADR is per room for two guests, tax-excluded equivalent, and is the median within each area.
■ Limitations
The nationality breakdown of the Overnight Travel Statistics Survey is an estimate covering facilities with 20 or more rooms. It differs from JNTO visitor arrivals (entry-based) in population and methodology, so their growth rates are not directly comparable. Room stock and estimated settled ADR are limited to properties with confirmed active OTA listings and exclude unlisted properties. Review language does not match guest nationality; Traditional Chinese includes guests from Hong Kong and Macau.
- Japan National Tourism Organization (JNTO), “Visitor Arrivals (July 2026 Estimates)” (August 19, 2026)
- Japan Tourism Agency, “Overnight Travel Statistics Survey (July 2026 First Preliminary, June 2026 Second Preliminary)” (August 31, 2026)
- Japan Tourism Agency, Overnight Travel Statistics Survey statistical tables (second preliminary values, monthly results)
- Japan Tourism Agency, “Past Second Preliminary Values” (monthly results for 2024 and 2025)
- MetroEngines Research — room stock by prefecture (properties with confirmed active listings), estimated settled ADR (June 2026)
- HotelBank Editorial Team research — NLP analysis of guest reviews (tag mention rates by language, latest 24 months)