

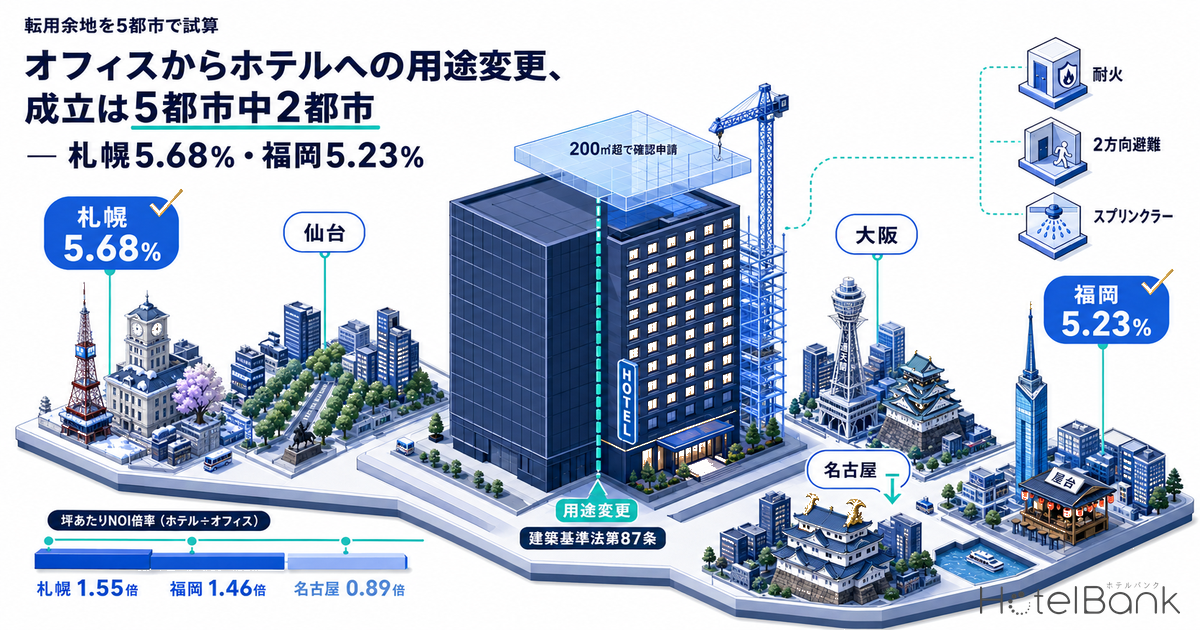
Turning part of an office building into a hotel runs into its first obstacle before financing or operator selection: the change-of-use procedure under Article 87 of the Building Standards Act. Office to hotel (inn business) does not count as a “similar use,” so a building confirmation application is required once the floor area being converted exceeds 200㎡. To get that application approved, the building must meet the hotel thresholds for fire resistance, two-direction evacuation, partition walls between rooms, smoke exhaust and emergency lighting. None of these rules applied at those thresholds while the space was an office.
This article first sets out the change-of-use process as a practical sequence of steps. It then models per-tsubo returns for five cities (Sapporo, Sendai, Nagoya, Osaka and Fukuoka) under two cases, “hold as office” and “convert to hotel”, to show in numbers where conversion still works. The bottom line: with renovation cost set at ¥600,000 per tsubo (1 tsubo ≈ 3.3㎡), post-conversion NOI yield beats the expected yield for limited-service hotels in only two cities, Sapporo (5.68%) and Fukuoka (5.23%).
Metric Definitions Used in This Article
- ADR (average daily rate): Estimated settled rate (tax-excluded equivalent), calculated by applying a segment-specific adjustment factor to the lowest-plan rate each property publishes on OTAs and similar channels (2 guests per room, per-room price, tax included). Checked against property-level results disclosed by listed hotel REITs (91 properties, latest 3 months), the median error is about 7%. These are estimates and differ from each property’s actual settled prices and accounting figures. Area-level ADR is the median of the properties covered, i.e. the level of a typical property in the area. This article uses the 12-month average from September 2025 to August 2026.
- OCC (occupancy rate): Business-hotel room occupancy by prefecture from the Japan Tourism Agency’s Overnight Travel Statistics Survey, 2025 annual figures. These are published statistics used as-is, not our estimates.
- Gross floor area per room: 26.2㎡ (7.93 tsubo) per room. This is the median of gross floor area ÷ room count across 283 operating business hotels (Hokkaido, Miyagi, Aichi, Osaka, Fukuoka and Tokyo; 20+ rooms). Interquartile range: 20.2–33.5㎡.
- NOI assumptions: Hotel NOI is 30% of room revenue (owner basis, after operator fees, FF&E reserve and taxes). Office NOI is 72% of fully-leased rental income adjusted for each city’s average vacancy rate (after management fees, repairs and taxes). Both are modeling assumptions.
- Expected yields: Expected yields for limited-service hotels and offices (major designated cities) from the Japan Real Estate Institute’s 54th Real Estate Investor Survey (as of April 2026).
- — Office to hotel is not a “similar use,” so converting more than 200㎡ requires a building confirmation application. For fire-resistant buildings, the threshold that triggers two direct stairways is cut in half, from over 400㎡ to over 200㎡.
- — Under the Fire Service Act a hotel is a Category (5)-i “specified fire-prevention object,” so older buildings are not exempt from current standards. Sprinklers are required if the building has 6,000㎡+ total floor area, 11+ floors, or any floor between the 4th and 10th with more than 1,500㎡.
- — Per-tsubo NOI multiples (hotel ÷ office) across the five cities: Sapporo 1.55x, Fukuoka 1.46x, Sendai 1.13x, Osaka 1.09x, Nagoya 0.89x. Nagoya is the only city where office wins.
- — At ¥600,000/tsubo renovation, yield on total investment beats the limited-service hotel expected yield in just two cities: Sapporo 5.68% (+0.68pt) and Fukuoka 5.23% (+0.53pt).
- — The margin is thin. In a downside case of ADR −10% and OCC −3.0pt, Sapporo falls to 4.91% and Fukuoka from 5.22% to 4.52%, so both cities flip to a fail. Break-even ADR is 12.0% below current in Sapporo and 10.0% below in Fukuoka.
A Change-of-Use Application Is Needed When Two Conditions Meet: “Special Building” and “Over 200㎡”
Article 87 of the Building Standards Act provides that when a building’s use is changed so that it becomes a special building under Article 6(1)(i), the confirmation application rules apply in principle. In practice the test is simple: an application is required when both of the following conditions are met.
First, the new use must be a special building. Hotels and inns are special buildings listed in item (2) of column (i) of Appended Table 1 of the Act; offices are not. Office to hotel therefore counts as “becoming a special building.” Second, the total floor area subject to the change must exceed 200㎡. This threshold was raised from 100㎡ to 200㎡ in the June 2019 amendment, so a small single-floor conversion may not need a confirmation application at all.
Conversely, if the change is between uses defined by Cabinet Order as “similar uses,” no application is needed even above 200㎡. Hotel ⇔ inn is a similar-use pair, so the procedure is light. Office and hotel, however, are not on the list of similar-use combinations. This is why office-to-hotel conversion carries a heavier procedural burden than residential or retail conversions.
Another point practitioners often overlook is inspection. The completion-inspection rules of Article 7 do not apply to change-of-use applications, so no inspection certificate is issued when the work is finished. Instead, the owner files a notice of completion with the building official. This raises a future question at sale: how do you demonstrate that the change of use was lawful? Decide at acquisition how the confirmation certificate, the completion notice and the full set of design documents will be kept. Buildings that lack an inspection certificate for their original construction raise a separate set of issues, which this article does not cover.
Even in cases of 200㎡ or less where no application is needed, zoning restrictions under Article 48, the fire and evacuation provisions applied via Article 87(3), and Fire Service Act procedures still apply separately. “No application needed” does not mean “the building can stay as it is”, and this must be clear at the planning stage.
The Two-Direction Evacuation Threshold Is Half the Office Level: Key Rules That Change from Office to Hotel
The rules that drive construction cost most in a change of use are those on evacuation and compartmentation. Even for the same building and floor area, different thresholds apply to offices and hotels. The requirement for two or more direct stairways (Order Article 121) is the clearest case: for a fire-resistant office building the threshold is over 400㎡, but for a hotel it drops to over 200㎡ of total guestroom floor area. In a mid-size office building with typical floors above 200㎡ and only one direct stairway, this alone can make the plan unworkable.
| Rule | Threshold for offices | Threshold for hotels/inns | Typical conversion works |
|---|---|---|---|
| Two or more direct stairways Order Art. 121 | Habitable rooms over 200㎡ on floors other than the evacuation floor (over 400㎡ if main structure is quasi-fire-resistant, etc.) | Guestroom floor area on that floor over 100㎡ in total (over 200㎡ if quasi-fire-resistant, etc.) | Adding external stairs, new evacuation balconies, fewer guestrooms |
| Partition walls Order Art. 114(2) | No requirement (free layout) | Walls between guestrooms must be quasi-fire-resistant and reach the attic or ceiling void | Extending walls up into the ceiling void, sealing penetrations for existing ducts and pipes |
| Fire resistance Act Art. 27 | Not applicable (not a special building) | Must be a fire-resistant building etc. where floors 3+ are used for the purpose | Often already satisfied in existing fire-resistant buildings in commercial zones |
| Smoke exhaust Order Art. 126-2 | Required for 3+ stories with over 500㎡ total floor area, etc. | Required as a special building over 500㎡ total floor area; finer compartmentation reshapes smoke-control zones | Smoke vents or windows per guestroom, rerouting ducts |
| Emergency lighting Order Art. 126-4 | Often already installed | Each new guestroom becomes a habitable room, and all require it | Fixtures for every room and review of emergency power capacity |
| Interior finish restrictions Order Art. 128-5 | Limited, except for large buildings etc. | As a special building, finishes in rooms and escape routes are restricted | Changing finish materials, limiting wood interiors |
| Barrier-free Barrier-Free Act | Not a “specified special building” | Converting to a hotel of 2,000㎡+ triggers mandatory compliance; with 50+ rooms, wheelchair-accessible rooms must be at least 1% of the total | Building wheelchair-accessible rooms, upgrading guest access routes |
Source: Compiled by MetroEngines Research & Consulting from the Building Standards Act and its Enforcement Order, and the Act on Promotion of Smooth Movement of the Elderly and Disabled
In practice, the most troublesome item in this table is the partition wall. Office partitions normally stop at the finished ceiling, but hotel guestroom partitions must be quasi-fire-resistant and rise into the attic or ceiling void. In buildings where HVAC ducts and cable trays run across the ceiling void, every wall that crosses them needs penetration sealing, and the cost per square meter jumps. Whether the ceiling void was surveyed in advance directly determines how accurate the estimate is.
The Barrier-Free Act also deserves a note. Its definition of “construction” includes converting a building into a specified special building, so the compliance duty applies even without new construction. Converting a whole office building of 2,000㎡ or more will almost certainly cross this threshold. With 50 or more rooms, at least 1% must be wheelchair-accessible, and depending on the existing structure and shaft positions, the room layout may need a major rework.
Under the Fire Service Act, the Building Becomes a “Specified Fire-Prevention Object” and Loses Grandfather Protection
The Fire Service Act applies alongside the Building Standards Act. Offices fall under Category (15) of Appended Table 1 of the Fire Service Act Enforcement Order, while hotels and inns fall under Category (5)-i. Category (5)-i is a specified fire-prevention object, and under Article 17-2-5 of the Act it is an exception to grandfathering, so it must comply with current standards. Equipment accepted under the standards in force at construction while the building was an office must meet today’s standards the moment it becomes a hotel.
The main equipment required for Category (5)-i is: automatic fire alarms at 300㎡+ total floor area; exit and corridor guide lights everywhere; and sprinklers at 6,000㎡+ total floor area (1,000㎡+ for basements and windowless floors; 1,500㎡+ for any single floor from the 4th to the 10th). In addition, Article 12 of the Enforcement Order generally requires sprinklers on floors 11 and above regardless of use. Buildings of 10 stories or fewer with under 6,000㎡ total floor area may avoid sprinklers, which is one reason mid-size existing office buildings are said to be easier to convert.
However, if a floor between the 4th and 10th exceeds 1,500㎡, that floor is covered. In large office buildings with big typical floors, floor area alone triggers sprinklers, with knock-on works such as upsizing water mains and adding elevated tanks. Checking three numbers (total floor area, number of stories and typical floor area) with the local fire department early in planning is well worth it.
For Pre-1981 Buildings, the Question Is Not Whether a Seismic Assessment Is Required, but Who Demands It
When converting a building whose construction was confirmed on or before May 31, 1981 (the old seismic code), how seismic performance is handled becomes the investment decision itself. On the Building Standards Act side, the provisions applied upon a change of use do not include structural strength rules, so a change of use alone does not legally require seismic retrofitting.
Under the Act on Promotion of Seismic Retrofitting of Buildings, however, old-code hotels and inns with 3+ stories and 5,000㎡+ floor area are classed as “large buildings requiring urgent safety confirmation.” A seismic assessment and a report to the competent authority are mandatory, and the results are published. Smaller buildings used by many members of the public may still be subject to guidance and advice from the authority.
In practice, demands from the capital side matter even more than the law. In non-recourse loan collateral valuations and fund investment committees, an old-code building effectively requires a PML (Probable Maximum Loss) assessment and, where needed, retrofitting. As a rough cost guide, full renovation including interiors and MEP plus change-of-use works starts at around ¥500,000/tsubo, and adding seismic retrofitting and façade repairs starts at around ¥800,000/tsubo. Keep in mind that this ¥300,000/tsubo gap is roughly the same size as the range that decides pass or fail in the model below. The same fork appears in existing old-code stock operating as hotels. We lay out the retrofit-vs-rebuild decision at the building level in Japan’s Pre-1981 Hotel Stock: 236k Rooms, 19.1% of All Rooms.
Existing-Building Vacancy of 2.8–5.5%: Conversion Candidates Are on the “Not New” Side
Now to the market side. According to Miki Shoji’s Office Market data as of July 2026, average vacancy rates in the six major cities are Tokyo 1.95%, Osaka 3.24%, Nagoya 3.59%, Sapporo 4.38%, Fukuoka 5.00% and Sendai 5.57%. Overall they sit within 2–6%, but conversion candidates are vacancies in existing buildings, not new ones. For existing buildings only, the rates are lower: Tokyo 1.78%, Osaka 2.76%, Sapporo 3.41%, Nagoya 3.51%, Fukuoka 4.41% and Sendai 5.48%. For the five cities in our model, they fall into a narrower 2.8–5.5% range.
Source: Compiled by MetroEngines Research & Consulting from Miki Shoji, “Office Market,” as of July 2026
New-building vacancy rates are extremely high (Sendai 65.35%, Sapporo 32.98%, Fukuoka 27.10%) because space still being leased right after completion is concentrated in the small new-building category. Reading this as “surplus vacant space” is a mistake. The realistic conversion target is secondary vacancy left in existing buildings after tenants move to their own buildings or new towers. These buildings tend to be older, have smaller typical floors, and fall short of new buildings on ceiling height and raised-floor specs. This is exactly the group where conversion to hotel use gets considered.
| City | Average vacancy | Existing buildings | New buildings | Average rent (¥/tsubo/month) | Rent YoY |
|---|---|---|---|---|---|
| Tokyo (central 5 wards) | 1.95% | 1.78% | 11.37% | 23,287 | +11.4% |
| Osaka | 3.24% | 2.76% | 34.31% | 13,411 | +8.0% |
| Nagoya | 3.59% | 3.51% | 6.55% | 13,343 | +5.2% |
| Sapporo | 4.38% | 3.41% | 32.98% | 11,339 | +4.0% |
| Fukuoka | 5.00% | 4.41% | 27.10% | 12,605 | +4.3% |
| Sendai | 5.57% | 5.48% | 65.35% | 9,690 | +2.3% |
Source: Compiled by MetroEngines Research & Consulting from Miki Shoji, “Office Market,” as of July 2026
The direction of rents also matters. Rents are up year on year in all six cities, and they keep climbing: Tokyo +11.4%, Osaka +8.0%, Nagoya +5.2%. Rising office rents mean rising acquisition prices for conversion targets, which makes conversion economics tougher, not easier. Having vacant space is not the same as conversion being profitable.
Comparing NOI per Tsubo: Sapporo 1.55x, Fukuoka 1.46x, Nagoya 0.89x
To judge whether conversion works, you need a like-for-like comparison of the NOI per tsubo the same floor produces as an office and as a hotel. For the ward covering each city’s central business district, we calculated RevPAR from MetroEngines Research’s estimated settled ADR (12-month average, September 2025–August 2026) and the business-hotel occupancy by prefecture from the Japan Tourism Agency’s Overnight Travel Statistics Survey (2025 annual). We then divided by 26.2㎡ (7.93 tsubo) of gross floor area per room to get annual room revenue per tsubo.
| City (ward) | Est. settled ADR | YoY | OCC | RevPAR | Hotel NOI (¥/tsubo/yr) |
Office NOI (¥/tsubo/yr) |
Multiple |
|---|---|---|---|---|---|---|---|
| Sapporo (Chuo Ward) | ¥13,800 | +9.5% | 76.1% | ¥10,500 | 144,848 | 93,678 | 1.55x |
| Fukuoka (Hakata Ward) | ¥14,100 | +9.1% | 77.8% | ¥11,000 | 151,522 | 103,462 | 1.46x |
| Sendai (Aoba Ward) | ¥9,300 | +6.2% | 69.5% | ¥6,500 | 89,142 | 79,058 | 1.13x |
| Osaka (Kita Ward) | ¥10,700 | -5.6% | 82.9% | ¥8,800 | 122,176 | 112,117 | 1.09x |
| Nagoya (Naka Ward) | ¥9,500 | +6.1% | 75.4% | ¥7,100 | 98,758 | 111,145 | 0.89x |
Source: MetroEngines Research & Consulting (estimated settled ADR, N=53–143 properties per ward) / Japan Tourism Agency, Overnight Travel Statistics Survey, 2025 annual (business-hotel occupancy by prefecture) / Miki Shoji, “Office Market,” as of July 2026
Source: MetroEngines Research & Consulting (model assuming 26.2㎡ gross floor area per room, 30% hotel NOI margin, 72% office NOI margin)
Ranked by multiple: Sapporo 1.55x, Fukuoka 1.46x, Sendai 1.13x, Osaka 1.09x, Nagoya 0.89x. Nagoya alone falls below 1x because its office rent of ¥13,343/tsubo is on par with Osaka, while estimated settled ADR for business hotels in Naka Ward is only ¥9,500, more than 30% below Sapporo and Fukuoka. Nagoya’s office market is strong and its hotel market relatively calm. With that combination, the numbers give no reason to turn office floors into hotel rooms.
Osaka is also thin at 1.09x, and a temporary factor is mixed in. Estimated settled ADR in Osaka’s Kita Ward is down 5.6% year on year, the only decline among the five cities. This reflects the hangover from the large 2025 event, so using a single year’s figure as a long-term assumption is not appropriate. Still, office rents in Osaka are up 8.0% year on year, the second-fastest growth after Tokyo among the six cities. Taken together, the relative strength of holding as an office is likely to persist in Osaka for now.
For Sapporo, the large seasonal swings need to be factored in. Overlaying estimated settled ADR for Sapporo’s Chuo Ward by calendar month shows February, during the Snow Festival, spiking to ¥20,300, while April, the off-season, drops to ¥8,300. On an annual average Sapporo matches Fukuoka, but as the cash flow of a single asset, month-to-month volatility is large. This profile tends to come up with lenders that monitor debt coverage monthly.
Source: MetroEngines Research & Consulting (Sapporo Chuo Ward, business hotels, N=99–109 properties)
Add Renovation Cost and Only Two Cities Work: Sapporo 5.68%, Fukuoka 5.23%
Higher NOI per tsubo is not enough for the investment to work. The test is post-conversion NOI as a percentage of total investment, meaning the office acquisition price plus renovation cost. We set acquisition price per tsubo by capitalizing office NOI at each city’s expected office yield, added renovation cost at three levels (¥500,000, ¥600,000 and ¥800,000 per tsubo), and calculated post-conversion NOI yield. The hurdle is the limited-service hotel expected yield from the Japan Real Estate Institute’s 54th Real Estate Investor Survey (as of April 2026): Sapporo 5.0%, Sendai 5.3%, Nagoya 4.9%, Osaka 4.5%, Fukuoka 4.7%.
Source: MetroEngines Research & Consulting (model) / Japan Real Estate Institute, 54th Real Estate Investor Survey, as of April 2026
| City | Office expected yield |
Acquisition price (¥/tsubo) |
NOI yield @ ¥500k reno |
NOI yield @ ¥600k reno |
NOI yield @ ¥800k reno |
Hotel expected yield |
Spread (¥600k reno) |
|---|---|---|---|---|---|---|---|
| Sapporo | 4.8% | 1,951,600 | 5.91% | 5.68% | 5.26% | 5.0% | +0.68pt |
| Fukuoka | 4.5% | 2,299,200 | 5.41% | 5.23% | 4.89% | 4.7% | +0.53pt |
| Osaka | 4.0% | 2,802,900 | 3.70% | 3.59% | 3.39% | 4.5% | -0.91pt |
| Sendai | 5.0% | 1,581,200 | 4.28% | 4.09% | 3.74% | 5.3% | -1.21pt |
| Nagoya | 4.3% | 2,584,800 | 3.20% | 3.10% | 2.92% | 4.9% | -1.80pt |
Source: MetroEngines Research & Consulting (model) / Japan Real Estate Institute, 54th Real Estate Investor Survey, as of April 2026 / Miki Shoji, “Office Market,” as of July 2026
The result is clear. At ¥600,000/tsubo renovation, post-conversion NOI yield beats the limited-service hotel expected yield in only two cities: Sapporo (5.68% vs 5.0%, +0.68pt) and Fukuoka (5.23% vs 4.7%, +0.53pt). Osaka falls short by 0.91pt, Sendai by 1.21pt and Nagoya by 1.80pt.
Note that cap rate differences are not what makes conversion work. Limited-service hotel expected yields exceed office yields by 0.2–0.6pt in every city, meaning investors demand a higher yield from hotels as an asset. For the same NOI, a hotel is valued lower. Conversion still works in Sapporo and Fukuoka because absolute NOI per tsubo rises by roughly 1.5x. This is an investment explained by cash-flow uplift, not cap rate arbitrage. Put the other way, it does not work in cities where ADR is not growing. The same pattern appears regardless of the original use: for the ADR levels needed to turn large existing buildings into guestrooms, expressed as multiples of the market median, see Department Store Sites: 6 of 14 Go Hotel.
Sensitivity to renovation cost is also worth checking. Between ¥500,000 and ¥800,000 per tsubo, yield moves 0.65pt in Sapporo and 0.52pt in Fukuoka. That spread corresponds to whether a pre-1981 building needs seismic retrofitting. In Fukuoka, renovation at ¥800,000/tsubo gives 4.89%, narrowing the spread over the 4.7% expected yield to +0.19pt. The practical implication: for old-code buildings in Fukuoka, the verdict can flip depending on the seismic assessment result.
So far this is the base case, with a single ADR and OCC point for each city. Estimated settled ADR growth ranges from −5.6% to +9.5% year on year across the five cities, so locking in one year’s level is not appropriate. We therefore applied a common band to ADR and OCC to see where the verdict flips. The downside case is ADR −10% and OCC −3.0pt; the upside case is ADR +10% and OCC +2.0pt. Renovation cost is fixed at ¥600,000/tsubo.
| City (ward) | Acquisition price (¥/tsubo) | Downside | Base | Upside | Hotel expected yield | Break-even ADR | vs current ADR |
|---|---|---|---|---|---|---|---|
| Sapporo (Chuo Ward) | 1,951,600 | 4.91% | 5.68% | 6.42% | 5.0% | ¥12,141 | −12.0% |
| Fukuoka (Hakata Ward) | 2,299,200 | 4.52% | 5.22% | 5.90% | 4.7% | ¥12,684 | −10.0% |
| Sendai (Aoba Ward) | 1,581,200 | 3.52% | 4.09% | 4.63% | 5.3% | ¥12,046 | +29.5% |
| Osaka (Kita Ward) | 2,802,900 | 3.12% | 3.60% | 4.05% | 4.5% | ¥13,377 | +25.0% |
| Nagoya (Naka Ward) | 2,584,800 | 2.68% | 3.11% | 3.51% | 4.9% | ¥14,989 | +57.8% |
Downside = ADR −10%, OCC −3.0pt / Base = base case in the text (12-month average ADR Sep 2025–Aug 2026; Japan Tourism Agency 2025 annual OCC) / Upside = ADR +10%, OCC +2.0pt. Green figures exceed the limited-service hotel expected yield. Source: MetroEngines Research & Consulting (model) / Japan Real Estate Institute, 54th Real Estate Investor Survey, as of April 2026
The result is somewhat harsh. In the downside case Sapporo falls to 4.91% and Fukuoka from 5.22% to 4.52%, so both cities that passed in the base case drop below expected yield. Sapporo’s +0.68pt and Fukuoka’s +0.53pt cushions are only thick enough to be wiped out by a 10% ADR drop and a 3pt OCC drop. Conversely, even in the upside case only the same two cities pass: Sendai 4.63% (expected 5.3%), Osaka 4.05% (4.5%) and Nagoya 3.51% (4.9%) fall short even with 10% ADR growth. The line between cities with and without conversion potential does not move across scenarios.
The base-case verdicts of 5.68% and 5.23% rest on two variables: ADR and renovation cost. A two-axis grid shows how far these can move before pass and fail switch.
| ADR level | Reno ¥400k/tsubo | Reno ¥500k/tsubo | Reno ¥600k/tsubo | Reno ¥700k/tsubo | Reno ¥800k/tsubo |
|---|---|---|---|---|---|
| −15.0% (¥11,730) | 5.24% | 5.03% | 4.83% | 4.65% | 4.48% |
| −7.5% (¥12,765) | 5.70% | 5.47% | 5.26% | 5.06% | 4.87% |
| Base (¥13,800) | 6.17% | 5.91% | 5.68% | 5.47% | 5.27% |
| +7.5% (¥14,835) | 6.63% | 6.36% | 6.11% | 5.88% | 5.67% |
| +15.0% (¥15,870) | 7.09% | 6.80% | 6.54% | 6.29% | 6.06% |
| ADR level | Reno ¥400k/tsubo | Reno ¥500k/tsubo | Reno ¥600k/tsubo | Reno ¥700k/tsubo | Reno ¥800k/tsubo |
|---|---|---|---|---|---|
| −15.0% (¥11,985) | 4.77% | 4.60% | 4.44% | 4.29% | 4.15% |
| −7.5% (¥13,042) | 5.19% | 5.01% | 4.83% | 4.67% | 4.52% |
| Base (¥14,100) | 5.61% | 5.41% | 5.22% | 5.05% | 4.89% |
| +7.5% (¥15,158) | 6.03% | 5.82% | 5.62% | 5.43% | 5.25% |
| +15.0% (¥16,215) | 6.45% | 6.22% | 6.01% | 5.81% | 5.62% |
OCC is held flat in every scenario (Japan Tourism Agency, Overnight Travel Statistics Survey, 2025 annual: Sapporo 76.1%, Fukuoka 77.8%). Acquisition price is fixed at office NOI capitalized at each city’s expected office yield. Source: MetroEngines Research & Consulting (model) / Japan Real Estate Institute, 54th Real Estate Investor Survey, as of April 2026
Sapporo still passes with ADR 15% below base if renovation is ¥400,000/tsubo (5.24%), but at ¥600,000/tsubo it fails (4.83%). Fukuoka had a thin margin to begin with: at ADR −7.5% and ¥600,000/tsubo (4.83%), the spread over the 4.7% expected yield is only +0.13pt. On the ADR −15% line, every cell fails except ¥400,000/tsubo renovation (4.77%). The way to read this grid: whether the deal works depends less on whether the building can be converted than on how much ADR downside was priced in when negotiating the acquisition price.
In break-even terms, with renovation at ¥600,000/tsubo and flat OCC, the required ADR is ¥12,141 in Sapporo and ¥12,684 in Fukuoka. Against current estimated settled ADR (Sapporo ¥13,800, Fukuoka ¥14,100), the cushion is just 12.0% and 10.0%. For the three cities that fail, required ADR is Sendai ¥12,046 (+29.5% vs current), Osaka ¥13,377 (+25.0%) and Nagoya ¥14,989 (+57.8%). Nagoya in particular needs 1.58x current ADR. ADR growth cannot close gaps of that size; conversion works only if acquisition prices themselves come down.
Note that this model counts room revenue only and excludes ancillary income such as breakfast, beverages and meeting rooms. If a conversion keeps a restaurant tenant on the ground floor of the existing office building, NOI per tsubo could come in above this model. Conversely, if risk is passed to an operator via a fixed lease, keep in mind that the rent will be lower than this NOI.
Conversions Don’t Show Up in Construction Statistics: A Fourth Supply Route Missing from Forecasts
Hotel supply created by change of use has a distinctive data characteristic. Construction start statistics cover new construction, extensions and rebuilds; changing the use of an existing building is not counted. Building up a future room-supply forecast from construction starts or building-plan data therefore treats rooms created by conversion as zero.
In fact, when MetroEngines Research tallies its building-plan data (based on MLIT’s Building Construction Trend Statistics) for six prefectures (Hokkaido, Miyagi, Aichi, Osaka, Fukuoka and Tokyo), there are 33 identifiable projects, and every one is new construction. Not a single conversion appears. As long as supply pressure is measured by the new-build pipeline alone, rooms quietly emerging from existing buildings stay out of view. Among routes that do appear in construction statistics, extensions are the largest contributor after new builds, adding about 19,000 rooms over five years by our measurement.
*Building-plan data is based on confirmation applications as of the survey date. Applications are usually filed 1–2 years before opening, so project and room counts are expected to rise as new applications are added. Treat the figures as a lower bound for the confirmed pipeline at this point.
For investors this cuts both ways. If you are the converter, you can reach the market with a shorter construction period than a new build, ahead of supply statistics. If you own an existing hotel, you need to allow for competing rooms increasing even when construction statistics are quiet. In cities like Sapporo and Fukuoka, where the NOI-per-tsubo multiple exceeds 1.4x, assume that structural incentives for conversion are at work.
The Five CBDs and Their Existing Hotel Supply
The map shows the locations of the five CBDs used in the model and the existing hotel supply in each ward. Circle size shows the total rooms of business and city hotels in each ward. Color shows whether post-conversion NOI yield at ¥600,000/tsubo renovation beats the limited-service hotel expected yield.
Source: MetroEngines Research & Consulting (map)
Sapporo’s Chuo Ward (110 properties, 19,815 rooms) and Fukuoka’s Hakata Ward (107 properties, 17,341 rooms) have the deepest existing supply of the five wards. Ironically, the two wards where the numbers still leave room for conversion are the ones where hotels already cluster. This is because deep demand supports ADR. Conversion potential does not lie in cities with thin supply, and this often runs against intuition at the planning stage.
Six Items to Check Early in Planning
| Item | Figures and documents to check | Where the verdict changes |
|---|---|---|
| Zoning | City planning map. Hotels cannot be built in industrial zones, exclusive industrial zones, Category 1/2 low-rise exclusive residential zones, etc. | Zoning non-conformity cannot be solved by design, so rule it out first |
| Floor area being converted | Whether the total converted area exceeds 200㎡ | At 200㎡ or less no confirmation application is needed, but other laws still apply |
| Number of direct stairways | Total guestroom floor area per floor and number of direct stairways (Order Art. 121) | With only one stairway and typical floors above the threshold: add stairs or cut rooms |
| Fire safety equipment | Total floor area, stories and typical floor area. Does the building have 11+ floors, 6,000㎡+ total, or 1,500㎡+ on any floor from the 4th to 10th? | Whether sprinklers are needed changes the scale of water-supply works |
| Construction date (old seismic code?) | Was the confirmation certificate issued on or before May 31, 1981? | Seismic assessment and retrofit move renovation cost from ¥500,000 to ¥800,000/tsubo |
| 2,000㎡ total floor area / 50 rooms | Whether Barrier-Free Act compliance and the 1%+ wheelchair-accessible room rule apply | Directly affects room layout and effective room count |
Source: Compiled by MetroEngines Research & Consulting from the Building Standards Act and its Enforcement Order, the Fire Service Act and its Enforcement Order, and the Barrier-Free Act
Summary
Converting an office to a hotel requires a building confirmation application once the converted area exceeds 200㎡. Because the building becomes a special building, fire resistance, two-direction evacuation, partition walls, smoke exhaust, emergency lighting and interior finish restrictions all come into play. The threshold for two or more direct stairways is halved for fire-resistant buildings, from over 400㎡ to over 200㎡, and partition walls must rise into the ceiling void. Under the Fire Service Act the building becomes a specified fire-prevention object, so grandfathering does not apply and current standards must be met. Procedurally there is no completion inspection and no inspection certificate, so decide at the design stage how the documents will be kept.
On the market side, existing-building vacancy sits in a narrow range from 1.78% in Tokyo to 5.48% in Sendai, so secondary vacancy suitable for conversion does exist. But rents are up year on year in all six cities, and acquisition prices are rising with them. On a like-for-like NOI-per-tsubo basis, hotel conversion exceeds 1x in Sapporo (1.55x), Fukuoka (1.46x), Sendai (1.13x) and Osaka (1.09x), while Nagoya reverses at 0.89x. Taking it down to yield on total investment with renovation at ¥600,000/tsubo, only two cities beat the limited-service hotel expected yield: Sapporo at 5.68% (+0.68pt) and Fukuoka at 5.23% (+0.53pt).
Conversion potential remains not in cities with high vacancy but in cities where ADR is growing. Conversion fails in Sendai with 5.57% vacancy and works in Sapporo with 4.38% vacancy, which shows this clearly. Whether it is worth clearing the building-code hurdles of a change of use is ultimately decided by the level of room rates.
Related Articles
- Old Malls and Warehouses as Next Hotel Rooms: Conversion Investment Boundaries
- Japan’s Pre-1981 Hotel Stock: 236k Rooms, 19.1% — Retrofit or Rebuild
- Department Store Sites: 6 of 14 Go Hotel, ADR Needs 1.4-3.1x Market
References and Sources
■ Data Sources
Room rates are the median estimated settled ADR of business hotels in the five CBDs (Sapporo Chuo Ward, Sendai Aoba Ward, Nagoya Naka Ward, Osaka Kita Ward, Fukuoka Hakata Ward), as a 12-month average from September 2025 to August 2026 (N=53–143 properties per ward). Occupancy is business-hotel room occupancy by prefecture from the Japan Tourism Agency’s Overnight Travel Statistics Survey, 2025 annual figures, used as-is (not our estimates). Office vacancy and rents are from Miki Shoji’s Office Market as of July 2026; expected yields are from the Japan Real Estate Institute’s 54th Real Estate Investor Survey as of April 2026. The 26.2㎡ gross floor area per room is the median for 283 operating business hotels (six prefectures, 20+ rooms).
Estimated settled ADR figures in this article were re-pulled and checked on September 7, 2026; all deviations from the published values are within 0.3%.
■ Model Assumptions
Hotel NOI = ADR × OCC × 365 days ÷ 7.93 tsubo (26.2㎡ per room) × 30%. Office NOI = monthly rent × 12 months × (1 − average vacancy) × 72%. Acquisition price = office NOI ÷ each city’s expected office yield. Post-conversion NOI yield = hotel NOI ÷ (acquisition price + renovation cost). Renovation cost ranges from ¥400,000 to ¥800,000/tsubo, with ¥600,000/tsubo as the base in the text. Scenarios: downside = ADR −10% and OCC −3.0pt; upside = ADR +10% and OCC +2.0pt; base = base case. Break-even ADR = expected yield × (acquisition price + renovation cost) × 7.93 ÷ (OCC × 365 × 0.30).
■ Limitations
(1) Revenue is room revenue only and excludes ancillary income such as breakfast, beverages, banquets and tenants. (2) The 30%/72% NOI margins and 26.2㎡ per room are assumptions based on market averages and vary widely with each property’s design efficiency and operating structure (lease vs management contract). (3) Acquisition price is a theoretical value from capitalizing office NOI at expected yield, not an actual transaction. (4) Occupancy is the prefecture-level business-hotel average and differs from actual levels in each ward. (5) Whether building, fire and barrier-free rules apply depends on each property’s stories, floor area and non-conforming status, so consult the competent building authority and local fire department at the planning stage. This article is not intended as investment advice or advice on legal compliance.
■ Market Data
- MetroEngines Research & Consulting — Estimated settled ADR (Sapporo Chuo Ward, Sendai Aoba Ward, Nagoya Naka Ward, Osaka Kita Ward, Fukuoka Hakata Ward; business hotels; N=53–143 properties per ward; Sep 2025–Aug 2026), gross floor area and room counts of existing hotels (N=283 properties), building-plan data (33 projects in six prefectures)
- Miki Shoji, “Office Market” (as of July 2026) — Average, existing-building and new-building vacancy rates and average rents in six cities
■ Government Statistics and Public Data
- Japan Tourism Agency, Overnight Travel Statistics Survey, 2025 annual figures, Table 8 — Room occupancy by prefecture and accommodation type
- MLIT, Building Construction Trend Statistics — Original source of building-plan data
- MLIT, “Overview of the Act on Promotion of Seismic Retrofitting of Buildings” — Size requirements for large buildings requiring urgent safety confirmation
- Fukuoka City, “Handling of Changes of Use (Building Standards Act Article 87)” (April 2025)
- Shinjuku City, “About Changes of Use (Building Standards Act Article 87)”
- Tokyo Metropolitan Government Bureau of Urban Development, Barrier-Free Act pamphlet
■ Investment Indicators and Industry Reports
- Japan Real Estate Institute, 54th Real Estate Investor Survey (as of April 2026) — Expected yields for offices and limited-service hotels
- Building Regeneration and Renovation: Cases and Costs — Converting Buildings into Lodging, Offices and Retail (archived March 9, 2026) — Per-tsubo renovation cost guides (interior/MEP refresh from ¥300,000/tsubo; full renovation and change of use from ¥500,000/tsubo; including seismic retrofit and façade work from ¥800,000/tsubo). The original page is no longer online, so the archive is cited.
- Hatsuta Bosai Setsubi, “Category (5)-i: Inns, Hotels, Lodging Houses and Similar” — Installation standards for fire safety equipment
- Building Standards Act Enforcement Order Article 121 (cases requiring two or more direct stairways), full text