

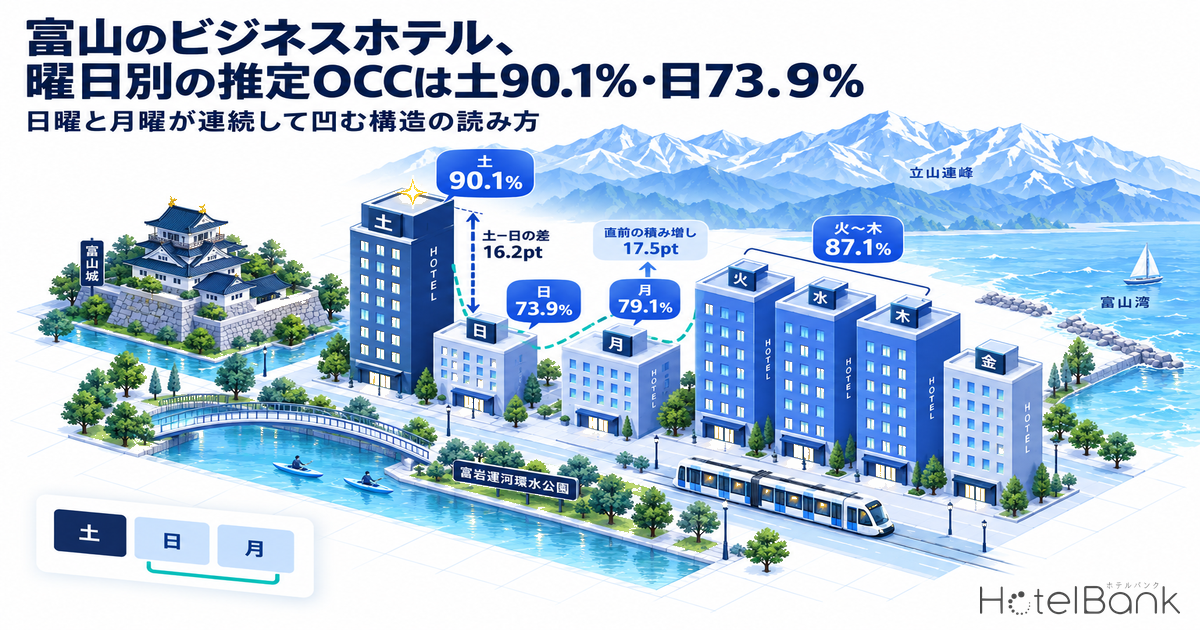
Aggregate day-of-week estimated OCC (based on OTA-listed inventory) for business hotels in Toyama Prefecture across the completed months of June to August 2026, and Saturday runs at 90.1% against 73.9% on Sunday. The gap is 16.2pt, and once a week for three straight months a trough appears in the same place at the same depth. What makes it harder to handle is that the trough does not end with Sunday. Monday sits at 79.1%, about 8pt below the 87.1% of Tuesday to Thursday. In other words, business hotels in Toyama ran 13 consecutive weeks in which occupancy fell on two consecutive nights, Sunday and Monday. This article breaks that continuous trough down from three angles — by day of week, by month, and by booking curve — and turns it into a way of reading the market, and a set of moves, that transfers directly to other areas.
About the data in this article
Scope: business hotels in Toyama Prefecture, N=28-31 properties (4,156-4,591 rooms; based on listings on major booking sites, aggregated by day of week). The price metric in this article is estimated settled ADR (the settled price level estimated from OTA and other sales data, tax-excluded equivalent); occupancy is an estimate based on OTA-listed inventory. Definitions for both are at the end of the article. Data as of September 12, 2026.
- — Saturday 90.1%, Sunday 73.9% (a 16.2pt gap): day-of-week estimated OCC for business hotels in Toyama Prefecture (June to August 2026, N=28-31 properties). Excluding Obon, the gap widens to 18.3pt.
- — The trough is two nights, Sunday and Monday: Monday at 79.1% is 8.0pt below the 87.1% of Tuesday to Thursday, and the trough disappeared in only one of the 13 weeks — Obon.
- — They fill in opposite ways: from 45 days out to the latest reading for September 26-28, Monday builds +17.5pt while Sunday stops at +6.9pt.
- — A shape shared by all three Hokuriku prefectures: Ishikawa and Fukui also bottom out on Sunday, then Monday. Monday’s shortfall against Tuesday to Thursday is 6.7-8.4pt in all three prefectures.
Day-of-week estimated OCC is 90.1% on Saturday and 73.9% on Sunday — the 16.2pt trough sits in the same place every week
We start by grouping the 92 stay-nights from June 1 to August 31, 2026 by day of week. The scope is business hotels in Toyama Prefecture, N=28-31 properties (4,156-4,591 rooms). The average across the whole period was 84.0%.
Ranked from the top: Saturday 90.1%, Thursday 88.4%, Wednesday 87.7%, Tuesday 85.1%, Friday 84.3%, Monday 79.1%, Sunday 73.9%. As you would expect in an area led by business demand, midweek (Tuesday, Wednesday and Thursday) is consistently high at an average of 87.1%, and Saturday — where leisure and family-visit demand is layered on top — takes the highest value. The trough, by contrast, is unmistakably Sunday: 7 of the 13 Sundays came in below 70%. Monday was under 80% on 9 of 14 occasions.
Source: MetroEngines Research; compiled by the HotelBank Editorial Team
| Day | Days covered | Avg. estimated OCC | Median | Lowest day | Highest day | Share of properties with no verifiable inventory (avg., estimated) |
|---|---|---|---|---|---|---|
| Sat | 13 | 90.1% | 90.4% | 76.6% | 99.8% | 37.1% |
| Thu | 13 | 88.4% | 89.0% | 79.9% | 97.3% | 25.4% |
| Wed | 13 | 87.7% | 85.9% | 74.3% | 99.9% | 31.9% |
| Tue | 13 | 85.1% | 84.6% | 73.2% | 99.7% | 22.5% |
| Fri | 13 | 84.3% | 83.4% | 73.4% | 96.6% | 19.2% |
| Mon | 14 | 79.1% | 77.1% | 66.7% | 99.8% | 16.4% |
| Sun | 13 | 73.9% | 68.2% | 62.1% | 99.2% | 18.8% |
Scope: business hotels in Toyama Prefecture, N=28-31 properties; 92 stay-nights, June to August 2026. Source: MetroEngines Research; compiled by the HotelBank Editorial Team
Sunday’s median of 68.2% is 5.7pt below its mean of 73.9%, so the distribution skews low. What lifts the mean is a handful of days around Obon — Sunday, August 9 at 99.2%, for instance — and once those are set aside, an ordinary Sunday reads as a day in the 60% range. Saturday, by contrast, has a mean of 90.1% and a median of 90.4% that all but coincide, with a floor of 76.6%. In Toyama’s business-hotel market, Saturday is stable at a high level and Sunday is stable at a low one: opposite characters.
Overlay the months and the Sunday dip does not disappear — only the level moves
Next we split the same day-of-week aggregation by month. Monthly average estimated OCC was 80.2% in June, 83.5% in July and 88.3% in August. August is naturally higher because it contains the Obon period, but the point worth noting is that the shape of the week barely changes from month to month.
Source: MetroEngines Research; compiled by the HotelBank Editorial Team
June: Sunday 64.3%, Monday 75.0%. July: Sunday 76.0%, Monday 76.1%. August: Sunday 79.8%, Monday 85.6%. The level moves by more than 15pt across the three months, but the ordering — Saturday the peak, Sunday the trough, Monday failing to recover — is the same in all three. July’s and August’s Sundays look high because three-day-weekend and Obon Sundays are mixed in, such as 93.4% on Sunday, July 19 and 99.2% on Sunday, August 9.
In fact, re-aggregating with the nine Obon-demand nights of August 8-16 excluded gives Saturday 89.0%, Sunday 70.7% and Monday 77.5% — a Saturday-to-Sunday gap that widens to 18.3pt. The Sunday and Monday trough looks less like a seasonal or event factor than like the weekly structure of this market itself.
Sunday and Monday show up as one continuous trough — checking it across 13 weeks
Looking only at day-of-week averages, Sunday and Monday appear to be two independent weak days. Laid out in the actual order of the week, though, the two are a single connected trough. The table below lines up estimated OCC for Saturday, Sunday and Monday across the 13 weeks from June to August.
| Week | Sat | Sun | Mon | Notes |
|---|---|---|---|---|
| Jun 6-8 | 92.2% | 68.2% | 74.9% | — |
| Jun 13-15 | 96.1% | 64.7% | 76.0% | — |
| Jun 20-22 | 90.4% | 62.1% | 76.5% | Lowest day in the period (Jun 21) |
| Jun 27-29 | 80.3% | 62.3% | 74.0% | — |
| Jul 4-6 | 85.2% | 65.7% | 77.7% | — |
| Jul 11-13 | 82.3% | 65.0% | 78.6% | — |
| Jul 18-20 | 99.8% | 93.4% | 66.7% | Three-day weekend including Marine Day (Jul 20) |
| Jul 25-27 | 90.3% | 79.9% | 81.5% | — |
| Aug 1-3 | 98.5% | 80.7% | 87.5% | — |
| Aug 8-10 | 98.6% | 99.2% | 99.8% | Obon period — the week the trough disappears |
| Aug 15-17 | 94.2% | 83.0% | 84.7% | Just after Obon |
| Aug 22-24 | 87.4% | 72.5% | 81.4% | — |
| Aug 29-31 | 76.6% | 63.6% | 74.6% | — |
Scope: business hotels in Toyama Prefecture, N=28-31 properties. Estimated OCC (based on OTA-listed inventory). Source: MetroEngines Research; compiled by the HotelBank Editorial Team
Three facts come out of this table. First, in 11 of the 13 weeks Sunday is more than 10pt below Saturday, and Monday recovers only to around 80%. However much Saturday builds up, the two nights that follow it run on a different demand structure.
Second, a three-day weekend does not remove the trough; it only shifts it. In the week of July 18-20 the high level carried through Sunday — Saturday 99.8%, Sunday 93.4% — while Monday, the Marine Day public holiday (July 20), fell to 66.7%, the lowest Monday in the period. The last day of a long weekend is a day for going home, not a day for staying. Reading the holiday calendar and concluding that there will be demand because Monday is a holiday risks pushing the decision in exactly the wrong direction.
Third, the only time the trough genuinely disappeared was Obon. August 8-10 ran Saturday 98.6%, Sunday 99.2% and Monday 99.8%, with the day-of-week spread gone entirely. Put another way, outside the few weeks of exceptional demand each year those two nights remain permanently on the list of things to manage. This two-night Sunday-and-Monday dip is not unique to Toyama, either: the same ordering can be seen in Day-of-week occupancy at Saitama’s business hotels: a Saturday spike, a weekday plateau, and the Sunday-Monday double trough.
Line up all three Hokuriku prefectures and the trough is still Sunday and Monday — but its width and depth differ by area
To check whether this two-night Sunday-Monday trough is specific to Toyama, we ran the same aggregation on business hotels in Ishikawa and Fukui, using the same definition and the same 92 stay-nights (June 1 to August 31, 2026). In all three prefectures the lowest day is Sunday and the second lowest is Monday: the trough sits in the same place.
| Prefecture | N= (properties) | Sat | Sun | Mon | Tue-Thu avg. | Sat − Sun | Tue-Thu − Mon |
|---|---|---|---|---|---|---|---|
| Toyama | 28〜31 | 90.1% | 73.9% | 79.1% | 87.1% | 16.2pt | 8.0pt |
| Ishikawa | 65〜71 | 88.8% | 71.6% | 73.9% | 82.3% | 17.2pt | 8.4pt |
| Fukui | 13〜20 | 91.5% | 79.9% | 83.3% | 90.0% | 11.6pt | 6.7pt |
Estimated OCC (based on OTA-listed inventory). Fukui covers few properties, so its figures swing more widely. Source: MetroEngines Research; compiled by the HotelBank Editorial Team
What differs is the width and depth of the trough. Ishikawa’s Saturday-to-Sunday gap of 17.2pt is wider than Toyama’s 16.2pt, and both nights sit lower than Toyama’s, at 71.6% on Sunday and 73.9% on Monday. Fukui’s gap is narrower at 11.6pt, and even Sunday holds 79.9%. Monday’s shortfall against Tuesday to Thursday, on the other hand, lands within 6.7-8.4pt in all three. So the depth of Sunday varies by area, while Monday’s failure to recover is the shape all three share. When you build the same table for your own area, separating those two numbers makes it easier to set the order of priority for your moves.
Sunday and Monday also fill differently — the booking curve from 45 days out
Even among days that are equally weak, deciding what to do requires knowing how they fill. So we take an ordinary weekend with no public holiday in it — Saturday September 26, Sunday September 27 and Monday September 28, 2026 — and follow estimated OCC from 45 days before the stay date up to the latest reading. The scope is N=32 properties (4,793 rooms).
Source: MetroEngines Research; compiled by the HotelBank Editorial Team
Organised at three points — 45 days out, 30 days out and the latest reading — it comes out as follows. Saturday (Sep 26) ran 76.6% → 81.7% → 92.6% (15 days out), a build of 16.0pt from 45 days out. Monday (Sep 28) ran 63.7% → 69.3% → 81.2% (17 days out), a build of 17.5pt. Sunday (Sep 27), by contrast, ran 74.0% → 74.1% → 80.9% (16 days out) for a build of just 6.9pt — and over the 15 days down to the 30-day mark it was essentially flat (+0.1pt).
Sunday, in other words, is the type where whatever comes in early is already in and almost nothing is added close to the date, while Monday is the type that starts from the lowest level at 45 days out but builds solidly over the final two to three weeks. The week of Saturday October 3, Sunday October 4 and Monday October 5 shows the same tendency: Saturday moved from 87.9% to 97.5% (22 days out) and Monday from 58.4% to 67.0% (24 days out), while Sunday stopped at 5.6pt, from 68.6% to 74.2% (23 days out).
That difference changes how the moves should be designed. Monday has real last-minute demand, so it is a day where keeping inventory and pricing open until close to the date has value. Sunday brings nothing in if you simply wait, so it is a day to go and create the demand through how the stay is assembled — a consecutive night carried over from Saturday, or Sunday-in / Monday-out for business travellers arriving the evening before.
For reference, the long weekend containing Sports Day on Monday, October 12 showed the same structure. Saturday, October 10 moved from 79.4% at 45 days out to 93.1% at 30 days out, while the holiday Monday (Oct 12) went from 53.8% at 45 days out to 57.0% at 35 days out, tracking at the lowest level of the three. According to the Cabinet Office’s National Holidays page, Sports Day in 2026 falls on Monday, October 12.
Hold the price yardstick monthly, in estimated settled ADR
Day-of-week analysis is done on the occupancy axis, but the price yardstick is held monthly. Estimated settled ADR for business hotels in Toyama Prefecture (N=71-72 properties), compared year on year between confirmed months, is as follows.
| Stay month | 2026 (confirmed) | 2025 (confirmed) | YoY | N= |
|---|---|---|---|---|
| May | ¥7,331 | ¥7,010 | +4.6% | 72 |
| June | ¥5,972 | ¥5,984 | −0.2% | 72 |
| July | ¥6,462 | ¥6,270 | +3.1% | 72 |
| August | ¥7,719 | ¥7,039 | +9.7% | 71 |
Estimated settled ADR (tax-excluded equivalent, confirmed values). Source: MetroEngines Research; compiled by the HotelBank Editorial Team
June, the month with the lowest estimated OCC, also had the lowest estimated settled ADR in the period, at the ¥6,000 level and flat against the prior year. August, where estimated OCC rose to 88.3%, sat at the ¥7,700 level, up 9.7% year on year. Because the seasonal shape of occupancy and the seasonal shape of price move in the same direction, a month like June is prone to becoming a double trough, the bottom for both occupancy and price. Current estimates for September and October 2026 are both around ¥10,200 (N=70 and N=68 properties), but these are estimates based on present sales conditions and rest on a different basis from confirmed values, so a straight comparison with confirmed figures has to wait for month-end confirmation. Rates within the prefecture also vary widely by municipality, and that spread is broken down in Toyama’s hotel market 2026: a four-tier rate structure spanning a 3.3x gap across 14 municipalities.
Source: MetroEngines Research; compiled by the HotelBank Editorial Team
For revenue managers running business hotels in Toyama — implications and an action plan
(1) Budget the trough as two nights, Sunday plus Monday, not as Sunday alone.The market’s day-of-week estimated OCC is 73.9% on Sunday and 79.1% on Monday, two consecutive days falling short of the 87.1% of Tuesday to Thursday. If the weekly RevPAR budget is spread evenly across the days, the same amount is left on the table on those two nights every week. It is worth pulling your own property’s day-of-week results into the same ordering and checking whether they match the market’s shape — Saturday the peak, Sunday the trough, Monday not recovering — and whether any one day at your property falls further than the market does.
(2) Sunday and Monday are not the same kind of weak, so separate the moves.On the booking curve, Sunday (Sep 27) added only 6.9pt, from 74.0% at 45 days out to 80.9% at the latest reading. Monday (Sep 28) added 17.5pt, from 63.7% to 81.2%, and ended up overtaking Sunday. Monday has demand arriving close to the date, so holding inventory back has a point; Sunday does not move however long you wait, so it reads as a day that needs demand created early, through how the stay is assembled.
(3) Start from the possibility that a holiday Monday is not a day when occupancy rises.The week containing Marine Day (Jul 18-20) built to 99.8% on Saturday and 93.4% on Sunday, yet the holiday Monday came in at 66.7%, the lowest Monday of the period. October 12 (Sports Day) tracks the same way, from 53.8% at 45 days out to 57.0% at 35 days out. Because the last day of a long weekend tends to be a departure day, the blanket assumption that a public holiday means high demand is worth checking calendar by calendar.
(4) Design the year on the assumption that the trough disappears only in weeks of exceptional demand.The day-of-week spread all but vanished in only one week, Obon (Aug 8-10), and re-aggregating with the Obon period excluded widened the Saturday-to-Sunday gap from 16.2pt to 18.3pt. Measures for Sunday and Monday therefore fit reality better as a standing menu run all year round than as something for the low season alone. A safe split is to hold the price yardstick monthly in estimated settled ADR (the ¥6,000 level in June through the ¥7,700 level in August) and to evaluate the Sunday and Monday measures on occupancy and length of stay.
(5) Manage exception days such as Sunday, November 1 separately on the calendar.The Toyama Marathon 2026 is scheduled for Sunday, November 1, 2026. Days on which a structurally weak Sunday becomes an exception are best pulled out of the normal day-of-week rules and handled individually.
| Time frame | Move | Decision trigger (figures from this article) | Aim |
|---|---|---|---|
| Today to this week | Pull your own property’s day-of-week occupancy for the last three months and overlay it on the market ordering (Sat 90.1 → Thu 88.4 → Wed 87.7 → Tue 85.1 → Fri 84.3 → Mon 79.1 → Sun 73.9) | When your Sunday sits well below the market’s 73.9%, or your Monday well below 79.1% | Separating market factors from property factors |
| Today to this week | For Mondays within the next 30 days, switch to keeping inventory and rates open until close to the date | When the Monday in question is not below the market’s roughly 69.3% at the 30-day mark (that is, not badly behind) | Not losing the 17.5pt of late build-up that is available |
| Within two weeks | Consider designing consecutive-night terms that move a one-night Saturday-in / Sunday-out stay into a two-night weekend stay | When your Saturday is close to the market’s 90.1% level and only the following Sunday drops | Creating Sunday demand, getting ahead of a day that does not build late |
| Within two weeks | Consider revisiting stay terms and check-in windows for Sunday-in / Monday-out stays (arriving the evening before a Monday meeting) | When your Sunday has moved only around 6.9pt from 45 days out to the latest reading | Bridging the Sunday and Monday trough with a single stay |
| Looking to next month | Pull out the weeks where a public holiday falls on a Monday and rebuild them as individual settings that drop the assumption that a holiday Monday means high demand | When the holiday Monday in question is still at the market’s 53.8-57.0% level between 45 and 35 days out | Responding to the departure-day character of a long weekend’s final day |
| Looking to next month | Redraw the rate-revision calendar to match the seasonal shape of monthly estimated settled ADR (June the floor, August the peak) | When your settings for the month in question remain far from the market’s estimated settled ADR (the ¥6,000 level in June, the ¥7,700 level in August) | Avoiding a doubling-up of the occupancy trough and the price trough |
Source: MetroEngines Research; compiled by the HotelBank Editorial Team
In summary: three yardsticks that work in any area
Yardstick 1, the width of the trough: measure the gap between the highest and lowest days of day-of-week estimated OCC. For business hotels in Toyama that is 16.2pt, Saturday 90.1% against Sunday 73.9%, or 18.3pt with the exceptional-demand weeks excluded. If that gap is wider still at your property, it reads as headroom in your own sales design rather than in the market structure.
Yardstick 2, the length of the trough: count how many nights the trough runs. In Toyama it is two, Sunday and Monday, with Monday 8pt below the 87.1% of Tuesday to Thursday. When the trough is two nights long, assembling the stay tends to work better than adjusting the rate night by night.
Yardstick 3, how the trough fills: compare the build at three points: 45 days out, 30 days out and just before the date. Sunday 6.9pt, Monday 17.5pt, Saturday 16.0pt — within the same trough, some days build late and some do not. Keep inventory open and wait on the days that build; create the stay early on the days that do not. That split is the practical core of working on the day-of-week problem.
About the data
- Definition of estimated OCC (based on OTA-listed inventory): “Occupancy on an OTA-listed-inventory basis = 100 − 100 × rooms remaining on OTA listings ÷ total rooms. The scope is a fixed cohort of properties that list at least 30% of their total rooms on OTAs (the same set of properties for every stay date). It is an estimate based on how listed inventory is being taken up on OTAs, and its definition differs from actual room occupancy (it reads high because rooms that are not listed are counted on the taken-up side).” The months covered are June, July and August 2026 (completed months).
- Booking curve: based on observations from 45 days before the stay date up to the latest reading.
- Definition of estimated settled ADR: the settled price level (tax-excluded equivalent) estimated from OTA and other sales data (cheapest-plan level × a coefficient by property type, as an ensemble across multiple channels). Past months are confirmed values; the current and future months are estimates based on present sales conditions. Cross-checked against published operating results, the median error is 6.6%.
- Breakdown of N: the day-of-week and monthly estimated OCC aggregations cover business hotels in Toyama Prefecture, N=28-31 properties (4,156-4,591 rooms). The booking curve covers N=32 properties (4,793 rooms). Estimated settled ADR covers N=71-72 properties (N=70 for September 2026 and N=68 for October). All are based on listings on major booking sites.
- Data as of September 12, 2026. Sales conditions and inventory change daily, so the figures in this article are a snapshot as of the time of collection.
References and sources
Related reading
- Day-of-week occupancy at Saitama’s business hotels: a Saturday spike, a weekday plateau, and the Sunday-Monday double trough
- Toyama’s hotel market 2026: a four-tier rate structure spanning a 3.3x gap across 14 municipalities
- Fukui’s ryokan run 90.9% on Saturday against 76.3% on Monday, a 14.6pt gap — how the weekly pattern differs where business hotels trough on Sunday
- Hokkaido’s business hotels are not a weekend market — the Tuesday-to-Thursday thickness and the Sunday-Monday trough in day-of-week estimated OCC
- Four autumn marathons and hotel supply and demand in 2026 — in Kanazawa, Mito, Toyama and Kobe, race-eve rates are already moving