

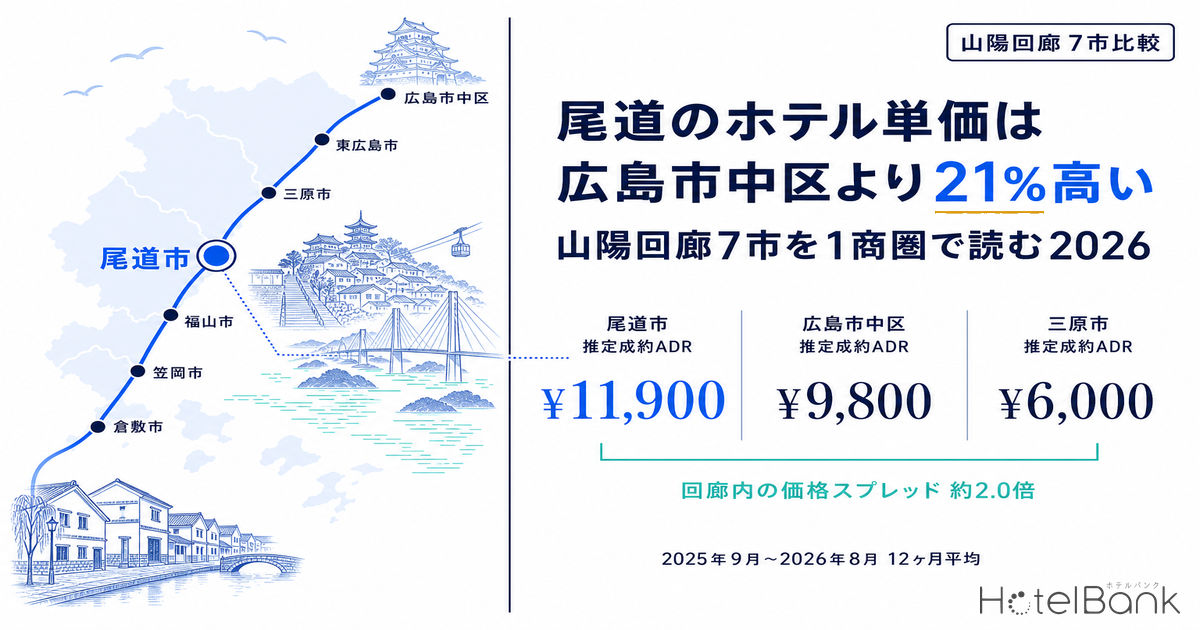
A prefectural border is an administrative line, not a line of lodging demand. The Sanyo Shinkansen runs from Okayama Station to Hiroshima Station in about 35 minutes, and along the Okayama–Hiroshima belt, where conventional rail lines and the Sanyo Expressway run in parallel, seven lodging clusters sit strung together: Okayama Kita Ward, Kurashiki, Fukuyama, Onomichi, Mihara, Higashihiroshima and Hiroshima Naka Ward. This article calls the belt the “Sanyo Corridor” and tests what the price hierarchy looks like when the market is redrawn at the corridor level rather than by prefecture. The short answer: the corridor’s estimated settled ADR does not follow the administrative ranking. Okayama Kita Ward, in the prefectural capital of roughly 710,000 people, sinks to the lower half at ¥7,900, while Onomichi, a city of about 120,000, tops the corridor at ¥11,900.
First, how this piece differs from earlier coverage. We have covered ADR by city and business hotel type in Okayama Prefecture and ADR gaps between municipalities within each prefecture, but both compare areas within a single prefecture. Our analysis of “second cities” with more lodging than the prefectural capital also stays inside prefectural boundaries. This article is different because it treats seven cities across a prefectural border as one market and redraws both the price hierarchy and the market boundaries. We have not previously aggregated Okayama, Kurashiki, Fukuyama, Onomichi and Mihara as a single market.
Metric Definitions Used in This Article
- ADR (Average Daily Rate) = an estimated settled rate (tax-exclusive equivalent), calculated by applying a hotel-type adjustment factor to the lowest-plan price each property publishes on OTAs (per room, two guests, tax included). Checked against property-level results disclosed by listed hotel REITs (91 properties, most recent three months), the median error is about 7%. It is an estimate and differs from each property’s actual settled rates and accounting figures. Area-level ADR is the median of the covered properties (the level of a typical property in the area).
- Listed price = the published price averaged across all plans (from room-only to meal-inclusive), per room for two guests (tax included). It is shown as a separate series, distinct from ADR.
- OCC (occupancy rate) = the share of sold rooms in the total room count of an area (an estimate based on OTA sales inventory; consistency checks against REIT monthly disclosures show accuracy within a few points). Used only as a macro indicator at the prefecture and municipality level.
- LT (lead time) = days until check-in; LT0 = the check-in day itself. Sell-out LT = the lead time at which remaining rooms first reached zero (a larger value means an earlier sell-out).
- Data source: MetroEngines Research & Consulting
- — Estimated settled ADR across the seven corridor cities spans about 2.0x (Onomichi ¥11,931 to Mihara ¥5,955). The top spot goes to Onomichi, population about 120,000, while Okayama Kita Ward in the prefectural capital ranks 5th of 7 at ¥7,935.
- — The worker-to-resident ratio splits the corridor into business-type and stay-type nodes: Hiroshima Naka Ward 4.45 and Okayama Kita Ward 2.15 versus Mihara 0.75, Onomichi 0.67 and Higashihiroshima 0.62. Prices follow the nature of demand, not the administrative ranking.
- — Commercial land price per ¥1 of ADR is ¥7.0/㎡ in Onomichi versus ¥135.2/㎡ in Hiroshima Naka Ward. That is roughly a 19x gap in land efficiency, a ranking that differs from the revenue-level ranking.
- — Of 1,314 new rooms in 2026, 600 (46%) went to Okayama Kita Ward, the lowest price band. A further 490 planned rooms are concentrated in the same node, while Fukuyama and Higashihiroshima saw zero openings of 20+ rooms.
- — Prices spread 2.0x, yet absorption speed is nearly flat: in Golden Week 2026, 100% of covered properties in all seven nodes recorded a sold-out day, and median sell-out LT converged at 20–28 days everywhere except Kurashiki.
Estimated Settled ADR Spreads 2.0x Across the Corridor — and the Top Is Onomichi, Not a Prefectural Capital
Start with the price hierarchy itself. The chart below shows the estimated settled ADR of the seven corridor cities, pulled monthly for the 12 months from September 2025 to August 2026 and averaged. From the top: Onomichi ¥11,900, Hiroshima Naka Ward ¥9,800, Kurashiki ¥8,400, Okayama Kita Ward ¥7,900, Higashihiroshima ¥7,800, Fukuyama ¥6,900 and Mihara ¥6,000. The gap between the highest and lowest is about 2.0x.
The point to check here is that this reversal cannot be dismissed as “tourist towns are expensive.” Onomichi’s listed price (all-plan average, tax included) is ¥30,000, 1.8x Hiroshima Naka Ward’s ¥16,600. The listed-price gap is larger than the ADR gap (1.2x). In other words, Onomichi has a thin scattering of high-priced inns that pulls up the listed-price average, and the gap narrows when measured by estimated settled ADR, which reflects the level of a typical property. The accurate reading is that Onomichi still beats Hiroshima Naka Ward even on that basis.
Okayama Kita Ward, by contrast, has a listed price of ¥15,500 and an ADR of ¥7,900, so the gap between listed and actual levels is small. That points to a market with thin high-end inventory, concentrated in mid-priced limited-service hotels. Ranking fifth in the corridor despite being a prefectural capital does not mean demand is weak; it means the price band where the market’s center of gravity sits is low.
Classifying Demand by Worker-to-Resident Ratio — Four Business-Type Nodes, Three Stay-Type Nodes
To see why the price hierarchy does not match the administrative ranking, we break it down by the nature of demand. For each node’s center point (station front or central commercial district), we took the number of workers (Economic Census) and resident population (250m-mesh estimates from the National Land Numerical Information) within a 1km radius and computed the ratio as the “worker-to-resident ratio.” A higher value means daytime population exceeds nighttime population, i.e. a business district where lodging demand tends to be driven by business travel and corporate accounts. A value below 1 indicates a residential or tourist area, where leisure stays carry more weight.
The results split cleanly. Hiroshima Naka Ward (around Kamiyacho) stands out at 4.45, followed by Okayama Kita Ward (around Okayama Station) at 2.15, Fukuyama at 1.28 and Kurashiki at 1.14. Mihara (0.75), Onomichi (0.67) and Higashihiroshima (0.62) fall below 1. The share of office workers shows a similar step: Hiroshima Naka Ward 26.4%, Okayama Kita Ward 20.5% and Fukuyama 19.9%, versus Onomichi 12.8%, Mihara 10.1%, Higashihiroshima 9.8% and Kurashiki 9.9%.
What this chart shows is that the corridor is not a single market but a structure in which two sub-markets, business-type and stay-type, alternate along the line. Onomichi in the upper left is the stay-type extreme, with thin employment but high rates; Okayama Kita Ward toward the lower right is the business-type extreme, with deep employment but low rates. Only Hiroshima Naka Ward stands out on both employment and room count while its ADR stays mid-range, which we read as its overwhelming stock of 16,667 rooms (nearly half the corridor’s total) flattening prices.
Stay-type Onomichi, Mihara, Higashihiroshima
Worker-to-resident ratio below 1. In Onomichi, stay demand as the starting point of the Shimanami Kaido supports rates; Mihara and Higashihiroshima have different profiles, driven by airport access and university presence.
Business-type Hiroshima Naka Ward, Okayama Kita Ward
Worker-to-resident ratio of 2 or more. Deep corporate demand coexists with a deep room stock, so rates tend to be set more by supply volume than by demand.
Intermediate Kurashiki, Fukuyama
Worker-to-resident ratio of 1.1–1.3. Kurashiki gets extra tourism demand from the Bikan Historical Quarter, lifting its listed price to ¥23,800, while business-led Fukuyama sits at ¥15,000 by contrast.
Higashihiroshima is the only corridor node whose projected 2040 population exceeds today’s (+3.3%). Within 1.5km of its center, resident population is 21,675, with a working-age share of 70.1% and an aging rate of 16.6%, making it the youngest market in the corridor. That reflects a population structure built around universities. In contrast, Onomichi (−25.2%) and Mihara (−24.3%) are projected to lose a quarter of their resident population by 2040, making investment premised on business demand hard to justify. The population side also confirms that these two cities can only pencil out on stay demand.
| Node (center point) | Est. settled ADR | Listed price | Workers | Residents | Worker/resident ratio | Office share | 2040 population |
|---|---|---|---|---|---|---|---|
| Onomichi (Onomichi Sta.) | ¥11,931 | ¥29,978 | 5,756 | 8,637 | 0.67 | 12.8% | −25.2% |
| Hiroshima Naka Ward (Kamiyacho) | ¥9,821 | ¥16,566 | 102,842 | 23,102 | 4.45 | 26.4% | −0.4% |
| Kurashiki (Kurashiki Sta.) | ¥8,421 | ¥23,758 | 17,973 | 15,784 | 1.14 | 9.9% | −10.9% |
| Okayama Kita Ward (Okayama Sta.) | ¥7,935 | ¥15,456 | 54,724 | 25,497 | 2.15 | 20.5% | −5.2% |
| Higashihiroshima (Saijo Sta.) | ¥7,818 | ¥15,907 | 13,380 | 21,675 | 0.62 | 9.8% | +3.3% |
| Fukuyama (Fukuyama Sta.) | ¥6,854 | ¥14,952 | 22,351 | 17,408 | 1.28 | 19.9% | −12.8% |
| Mihara (Mihara Sta.) | ¥5,955 | ¥15,752 | 9,414 | 12,627 | 0.75 | 10.1% | −24.3% |
Divide by Land Cost and the Ranking Flips Further — Onomichi at 1/19 of Hiroshima Naka Ward
So far this has been about the revenue side. What an investment decision needs is how much land cost it takes to capture that rate. Lining up each city’s average commercial land price from the 2026 Land Price Publication and computing land price per ¥1 of estimated settled ADR (¥/㎡), the ranking reverses even more clearly.
| Hiroshima Naka Ward | ¥1,327,966/㎡ | +5.69% |
| Okayama (citywide avg.) | ¥239,777/㎡ | +4.15% |
| Fukuyama | ¥147,678/㎡ | +4.46% |
| Kurashiki | ¥90,725/㎡ | +1.97% |
| Mihara | ¥86,020/㎡ | −0.63% |
| Onomichi | ¥83,812/㎡ | −0.63% |
Onomichi comes in at ¥7.0/㎡ per ¥1 of ADR, the best land efficiency in the corridor. That is 1.5x better than second-place Kurashiki at ¥10.8/㎡, and against Hiroshima Naka Ward at ¥135.2/㎡ it works out to capturing an equal or higher rate at 1/19 of the land cost. Mihara (¥14.4/㎡) and Fukuyama (¥21.5/㎡) follow, while Okayama Kita Ward, at ¥30.2/㎡, has the second-worst efficiency in the corridor.
That said, these multiples cannot be read directly as investment yields. Land prices are city/ward commercial averages, and roadside land values at actual candidate sites swing widely by location. For Okayama no ward breakdown is available and the citywide average is used, so actual prices around Okayama Station are higher than shown here. Construction costs, labor costs and operating efficiency also vary by city. This metric is a compass showing in which direction land cost and rate diverge within the corridor, not a precise return calculation.
Even so, the direction is clear. Onomichi and Mihara, where land prices fell year on year (−0.63%), carry a structurally lighter land-cost burden at entry than Hiroshima Naka Ward (+5.69%) or Fukuyama (+4.46%), where prices keep rising. It is natural for land to be cheap in cities with steep population decline, but it is not self-evident that such a city would also hold the corridor’s top ADR. As our earlier analysis of how new supply affects ADR across 47 prefectures showed, the thinner a market’s room stock, the more each new room moves prices. Onomichi’s thin stock of 1,294 rooms is the flip side of its price resilience.
Supply and Demand Split by Hotel Type — City Hotels at 92.4% in Hiroshima, Business Hotels at 89.6% in Okayama
Next, supply and demand. We pulled estimated OCC based on OTA-listed inventory for August 2026 (a closed month) by category for both prefectures. Both are high on an all-property basis (Okayama 88.1%, Hiroshima 90.6%), but the tightest hotel type differs.
| Hotel type | Okayama properties | Okayama rooms | Okayama OCC | Hiroshima properties | Hiroshima rooms | Hiroshima OCC |
|---|---|---|---|---|---|---|
| All properties | 268 | 15,585 | 88.1% | 409 | 26,948 | 90.6% |
| Business hotels | 88 | 10,958 | 89.6% | 166 | 18,935 | 90.7% |
| City hotels | 16 | 1,924 | 86.7% | 27 | 4,655 | 92.4% |
| Ryokan | 45 | 888 | 80.9% | 60 | 1,382 | 89.1% |
| Resort hotels | 17 | 1,078 | 84.2% | 9 | 473 | 82.9% |
Hiroshima’s city hotels hold 4,655 rooms yet run at 92.4%, the tightest of any type in either prefecture. Okayama’s city hotels, with 1,924 rooms, are at 86.7%, a 5.7pt gap. Business hotels, on the other hand, are nearly level at 89.6% in Okayama and 90.7% in Hiroshima, so the gap between prefectures is smaller than the gap between types. Ryokan show an 8.2pt spread, 89.1% in Hiroshima versus 80.9% in Okayama, suggesting that Seto Inland Sea stay demand is concentrated in Hiroshima’s ryokan inventory.
This distribution indicates that what the corridor lacks is city hotel inventory in Hiroshima Naka Ward and ryokan inventory along the Seto Inland Sea. Limited-service business inventory is at the same level in both prefectures, leaving relatively less room to absorb additional supply.
600 of 2026’s 1,314 New Rooms Went to the Lowest-Rate Node — Zero for Fukuyama and Higashihiroshima
Now, where supply is headed. In 2026, 11 properties with 20+ rooms and 1,314 rooms in total opened in the corridor (based on confirmed OTA listings). Of those, 600 rooms, fully 46%, came from a single property in Okayama Kita Ward: APA Hotel & Resort Okayama-eki Shinkansenguchi (アパホテル&リゾート〈岡山駅新幹線口〉), opened on August 6 (600 rooms, 14 floors above ground, with a large public bath, open-air bath and pool), one of the largest in Okayama Prefecture. A major brand with strong drawing power made a full-scale entry into the prefectural capital, redrawing the corridor’s room-stock map with one property.
| Node | Property | Rooms | Opened | Type |
|---|---|---|---|---|
| Okayama Kita Ward | APA Hotel & Resort Okayama-eki Shinkansenguchi (アパホテル&リゾート〈岡山駅新幹線口〉) | 600 | 2026-08-06 | Business hotel |
| Hiroshima City | Tokyu Stay Mercure Hiroshima (東急ステイメルキュール広島) | 182 | 2026-05-18 | Business hotel |
| Hiroshima City | Setouchi Cycle Stays Hiroshima Ujina (せとうちサイクルステイズ広島宇品) | 123 | 2026-04-01 | Business hotel |
| Hiroshima City | Hotel Aston Plaza Hiroshima Annex 2 (ホテルアストンプラザ広島2号館) | 112 | 2026-05-01 | Business hotel |
| Mihara | Livemax Resort Mihara Onsen Seafront (リブマックスリゾート三原温泉シーフロント) | 75 | 2026-07-01 | Resort hotel |
| Hiroshima City | Ping Pong Hotel Hiroshima Heiwa-Odori (ピンポンホテル広島平和大通り店) | 60 | 2026-05-01 | Business hotel |
| Kurashiki | Pia Hotel Kurashiki Mizushima (ピアホテル倉敷水島) | 50 | 2026-08-03 | Cottage |
| Kurashiki | Garden Kurashiki (ガーデン倉敷) | 32 | 2026-08-11 | Business hotel |
| Hiroshima City | Socio Residential Hotel (ソシオ レジデンシャル ホテル) | 28 | 2026-03-01 | Hostel |
| Hiroshima City | HOTEL 919 Otemachi | 27 | 2026-03-01 | Business hotel |
| Onomichi | Arbor Onomichi | 25 | 2026-04-25 | Hostel |
The breakdown of all 2026 openings in Hiroshima Prefecture and the YoY change in estimated settled ADR are aggregated at the prefecture level in our analysis of Hiroshima’s 1,003 rooms opening in 2026. The notable gap in the corridor is that neither Fukuyama nor Higashihiroshima had a single new opening of 20+ rooms. Fukuyama is the corridor’s third-largest cluster, with 48 properties and 3,066 rooms within 1.5km of its center, and a business district with a worker-to-resident ratio of 1.28. Even so, its 2026 supply was zero. Likewise, Higashihiroshima, the only corridor node expected to grow in population, has no new supply.
Plans further out are also concentrated in Okayama Kita Ward. The unopened projects in the corridor identifiable from building plans are two in Okayama Kita Ward totaling 490 rooms (a 16-story, 190-room building in Ekimae-cho due for completion in April 2027, and a 12-story, 300-room building in Nodaya-cho due for completion in December 2028). Adding 2026’s 600 rooms, about 1,090 rooms will pile up in Okayama Kita Ward within a few years. The corridor’s largest supply is heading to the node with the third-lowest rate.
*Planned projects are based on building confirmation applications as of the survey date. Applications are typically filed one to two years before opening, so the number of projects and rooms is expected to increase as new applications are filed. Treat these figures as the lower bound of the confirmed pipeline at this point.
Gaps Revealed by Golden Week 2026 — Rates Spread 2.0x, but Absorption Speed Is Nearly Flat
We test whether this price hierarchy is backed by supply and demand, using actual results on confirmed peak days. For check-in dates from May 1 to 5, 2026 (Golden Week), we pulled each property’s remaining-room trend on a room basis. The judgment is based not on the number of plans but on remaining rooms (room basis) and the lead time at which remaining rooms first hit zero (sell-out LT). Properties whose OTA allocation was below 30% of total rooms were excluded, since a small allocation distorts the sell-out judgment.
The result was somewhat unexpected. In all seven nodes, 100% of covered properties recorded zero remaining rooms on at least one day during the period. Median sell-out LT then fell within a narrow 20–28-day band everywhere except Kurashiki: Higashihiroshima 27.6 days, Mihara 24.2, Hiroshima Naka Ward 23.0, Okayama Kita Ward 22.0, Onomichi 21.6, Fukuyama 20.0 and Kurashiki 10.0.
The implication is clear. Estimated settled ADR spreads about 2.0x from ¥6,000 to ¥11,900, yet peak-day absorption speed sits in nearly the same band. Mihara (¥6,000) and Higashihiroshima (¥7,800) fill their allocations earliest in the corridor while ranking in the bottom two on rate. Here, a band where the price hierarchy and demand pressure do not line up appears as a gap.
Gap ① ¥6,000–8,000 × early absorption
Mihara and Higashihiroshima. Their peak-day sell-out LT is among the longest in the corridor, yet their rates are near the bottom. This is the thinnest price layer in the corridor, leaving room for new mid-priced entrants.
Gap ② Above ¥12,000 × stay-type
There is no price band above Onomichi. The next stay-type node up the scale jumps all the way to Hatsukaichi (Miyajima), and no competing node in the corridor covers the ¥12,000–24,000 band between them.
Saturated band Business-type ¥7,000–10,000
Okayama Kita Ward, Hiroshima Naka Ward and Fukuyama. Room stock is deep, and supply from 2026 onward is heading here too. This is a segment where operating efficiency matters more than price.
Here are the properties that showed strength on peak days, with their scale and results. In Onomichi, Hotel Alpha-1 Onomichi (ホテル・アルファ-ワン尾道, 196 rooms) posted an average sell-out LT of 34.0 days, selling out on 3 of the 5 days. HOTEL 1-2-3 Kurashiki (HOTEL1-2-3 倉敷, 140 rooms) likewise averaged 34.0 days. In Mihara, Super Hotel Mihara Ekimae (スーパーホテル 三原駅前, 108 rooms) sold out at an average of 33.3 days, and its remaining-room rate at the end of the period was 1.9%, the lowest in the corridor. Toyoko Inn Higashi-Hiroshima Saijo-eki Mae (東横INN東広島西条駅前, 132 rooms) averaged 32.3 days, as did Route Inn Grantia Fukuyama Spa Resort (ルートイングランティア福山SPA RESORT, 156 rooms) in Fukuyama. In Hiroshima Naka Ward, Sejour Fujita (セジュールフジタ, 60 rooms) averaged 34.0 days, and in Okayama Kita Ward, Okayama View Hotel (岡山ビューホテル, 97 rooms) recorded 30.7 days. Each reliably captured peak demand in its node.
| Node | Covered properties | Total rooms | Median sell-out LT | Properties sold out 1+ day | Median remaining-room rate at period end |
|---|---|---|---|---|---|
| Higashihiroshima | 2 | 258 | 27.6 days | 2 (100%) | 4.0% |
| Mihara | 2 | 277 | 24.2 days | 2 (100%) | 9.4% |
| Hiroshima Naka Ward | 13 | 2,148 | 23.0 days | 13 (100%) | 4.4% |
| Okayama Kita Ward | 17 | 2,394 | 22.0 days | 17 (100%) | 5.8% |
| Onomichi | 2 | 281 | 21.6 days | 2 (100%) | 5.9% |
| Fukuyama | 10 | 1,402 | 20.0 days | 10 (100%) | 4.2% |
| Kurashiki | 11 | 1,381 | 10.0 days | 11 (100%) | 6.1% |
Kurashiki’s median sell-out LT of 10.0 days was the only one in the corridor below 20 days. Yet its remaining-room rate at period end was 6.1%, not far from other nodes, and all 11 covered properties recorded a sold-out day. The accurate reading is not that it failed to fill, but that it filled closer to the date. Kurashiki, home to the Bikan Historical Quarter, has the corridor’s second-highest listed price at ¥23,800, and this may reflect leisure travelers making booking decisions later.
How Rate Gaps Affect Feasibility — Three Scenarios for a 100-Room Model and ADR × OCC Sensitivity
Everything so far has been observed market data. Finally, we lay out on a common model how much that rate gap moves feasibility. Assuming a 100-room limited-service hotel built to the same specification in any corridor node, we estimated room revenue only under three scenarios: annual OCC of 70% (pessimistic), 78% (base) and 85% (optimistic), with estimated settled ADR at ±10% of the 12-month average. The August 2026 estimated OCC cited above (Okayama 88.1%, Hiroshima 90.6%) is a single peak-month estimate based on OTA-listed inventory and is not used as an annual occupancy assumption. Annual OCC in the table is an illustrative annual assumption.
| Node | Base ADR | Pessimistic annual room revenue OCC 70%, ADR −10% | Base annual room revenue OCC 78%, ADR ±0% | Optimistic annual room revenue OCC 85%, ADR +10% | Land acquisition cost 1,200㎡ site assumed | Base revenue ÷ land cost |
|---|---|---|---|---|---|---|
| Onomichi | ¥11,931 | ¥270M | ¥340M | ¥410M | ¥100M | 3.38x |
| Hiroshima Naka Ward | ¥9,821 | ¥230M | ¥280M | ¥340M | ¥1.59B | 0.18x |
| Okayama Kita Ward | ¥7,935 | ¥180M | ¥230M | ¥270M | ¥290M | 0.79x |
| Mihara | ¥5,955 | ¥140M | ¥170M | ¥200M | ¥100M | 1.64x |
The width of the range is not uniform across the corridor. Onomichi’s base case is ¥340M in annual room revenue, with about ¥130M between pessimistic and optimistic. Okayama Kita Ward’s base case is ¥230M, with a range of about ¥90M. The 2.0x rate gap shows up almost unchanged as a 2.0x revenue gap, while the scenario range (about 1.48x from pessimistic to optimistic) is constant regardless of rate level. In other words, choosing a node within the corridor is not a decision to take on scenario risk; it is a decision to choose the revenue level itself while carrying the same range of risk.
Dividing by land cost, the “1/19” from earlier remains as a gap in feasibility. Dividing base-case annual room revenue by land acquisition cost gives 3.38x in Onomichi and 1.64x in Mihara, versus 0.79x in Okayama Kita Ward and 0.18x in Hiroshima Naka Ward. On revenue level, Hiroshima Naka Ward reaches 80% of Onomichi, but once land cost is included the order flips. The two cities with year-on-year land price declines rank at the top on this measure.
| Est. settled ADR \ Annual OCC | 65% | 70% | 75% | 80% | 85% | Matching corridor node (12-month avg.) |
|---|---|---|---|---|---|---|
| ¥6,000 | ¥3,900 | ¥4,200 | ¥4,500 | ¥4,800 | ¥5,100 | Mihara ¥5,955 |
| ¥8,000 | ¥5,200 | ¥5,600 | ¥6,000 | ¥6,400 | ¥6,800 | Okayama Kita Ward ¥7,935 / Higashihiroshima ¥7,818 |
| ¥10,000 | ¥6,500 | ¥7,000 | ¥7,500 | ¥8,000 | ¥8,500 | Hiroshima Naka Ward ¥9,821 |
| ¥12,000 | ¥7,800 | ¥8,400 | ¥9,000 | ¥9,600 | ¥10,200 | Onomichi ¥11,931 |
| ¥14,000 | ¥9,100 | ¥9,800 | ¥10,500 | ¥11,200 | ¥11,900 | — |
What this grid shows is that closing a rate gap through OCC is nearly impossible within the corridor. A node with ¥8,000 ADR at 85% annual OCC earns a RevPAR of ¥6,800, which falls short of the ¥7,800 a ¥12,000-ADR node earns even when its annual OCC drops to 65%. A ¥4,000 ADR gap outweighs a 20pt OCC gap. As the previous section showed, the corridor’s median sell-out LT sits in a narrow 20–28-day band outside Kurashiki, so there was little room to differentiate on absorption speed, i.e. OCC, in the first place. In the corridor, choosing a location is choosing a rate, and the scope for recovery through operations is limited. That is the reasonable reading.
*The estimates in this section are illustrative and cover only room revenue and land acquisition cost. They do not reflect construction costs, FF&E or pre-opening costs; labor, operating costs or GOP margin; interest, cap rates or taxes; reductions in usable floor-area ratio from zoning, setback or shadow regulations; or gaps between individual sites’ roadside land values and city/ward average land prices. They cannot be used to judge yields, IRR or investment decisions.
How Competitive Sets Change When the Market Is Redrawn at the Corridor Level
Here is a summary of the findings by reader perspective.
| Perspective | Viewed by prefecture | Viewed by corridor |
|---|---|---|
| Funds and regional banks (deal evaluation) | Judge rates from Okayama and Hiroshima prefectural averages and set ranges based on the prefectural capital | The rate peak is Onomichi, not a prefectural capital. Onomichi’s land cost per unit of rate is 1/19 of Hiroshima Naka Ward’s; evaluate by position in the corridor rather than rank within the prefecture |
| Chain development (site selection) | Prioritize Okayama and Hiroshima cities by population and prefectural rank, with mid-sized cities tending to come later | Fukuyama and Higashihiroshima had zero new supply in 2026. Fukuyama has a 3,066-room cluster and a worker-to-resident ratio of 1.28; Higashihiroshima is the corridor’s only growing population (+3.3% by 2040) |
| Asset management (competitive set) | Place properties in the same prefecture and city in the comp set | Build it from nodes with the same profile across the border. Onomichi’s competitors are stay-type Kurashiki and Hatsukaichi, not Hiroshima Naka Ward; Fukuyama’s competitor is business-type Okayama Kita Ward |
To make the comp-set point more concrete: by worker-to-resident ratio, the seven corridor nodes fall into three groups: business-type (Hiroshima Naka Ward 4.45, Okayama Kita Ward 2.15), intermediate (Fukuyama 1.28, Kurashiki 1.14) and stay-type (Mihara 0.75, Onomichi 0.67, Higashihiroshima 0.62). Nodes in the same group have similar demand profiles even across prefectural lines. If an Onomichi property sets Hiroshima Naka Ward as its competitor, it is comparing itself against a different demand curve with a worker-to-resident ratio 6.6x apart. Regrouping at the corridor level gives prices more explanatory power.
The direction of supply risk also changes when viewed by corridor. Combining 2026’s 1,314 rooms and 490 planned rooms, about 60% of the corridor’s new and planned supply is heading to Okayama Kita Ward. Okayama Kita Ward’s estimated settled ADR moved from ¥7,600 in September 2025 to ¥9,200 in August 2026, including seasonality, and August coincides with the 600-room opening. How supply affects rates will require waiting for results over the next few quarters, but the combination of the highest supply pressure in the corridor landing on the node with the lowest rates is a fact worth treating as a given in investment decisions.
| Factor | Description | How to monitor |
|---|---|---|
| Supply concentration | 600 rooms in 2026 plus 490 planned in Okayama Kita Ward; about 60% of the corridor’s new supply concentrated in one node | Monthly estimated settled ADR in Okayama Kita Ward and OCC trend for business hotels |
| Population decline | Onomichi −25.2%, Mihara −24.3% (2040 projection, 1km radius of center). Investment premised on business demand is hard to justify | Trend in worker-to-resident ratio and seasonal distribution of stay demand |
| Rising land costs | Hiroshima Naka Ward +5.69%, Fukuyama +4.46%, Okayama +4.15% (2026 commercial land). Entry costs grow heavier each year | Next year’s Land Price Publication, and whether ADR growth keeps pace with land price growth |
| Sample constraints | Mihara, Higashihiroshima and Onomichi each have two covered properties on peak days; medians need a wide margin of interpretation | Re-aggregate as the observation period accumulates; read by group rather than by node |
Finally, what this article did not cover. At the western end of the corridor lies Hatsukaichi (Miyajima), whose estimated settled ADR of ¥24,400 far exceeds all seven corridor nodes (12-month average; monthly median of 35 covered properties). Miyajima, home to a World Heritage Site, has a unique demand structure, so we did not discuss it within the same price hierarchy as the seven nodes along the Sanyo Main Line. However, there is no intermediate node in the corridor between Onomichi (¥11,900) and Hatsukaichi (¥24,400), and this ¥12,000–24,000 band is the thinnest layer in the corridor. For projects targeting the upper stay-type band, this gap is the most obvious entry axis.
About the estimates: ADR in this article is an estimate; checked against property-level results disclosed by listed hotel REITs (91 properties, most recent three months), the median error is about 7%. Settled ADR disclosed by REITs is shown excluding consumption tax, and the estimated settled ADR in this article is likewise a tax-exclusive equivalent. Estimated OCC is based on how OTA-sold inventory was absorbed and differs from each property’s total actual occupancy. Land prices are city/ward commercial averages and differ from actual prices at individual candidate sites.
Related Articles
- Okayama City Hotel ADR −23.3% in July, Business +2.8% in H1 2026
- Intra-Prefecture ADR Gaps 2026: Median 2.74x, Okinawa Widest at 5.86x
- Japan’s Second Cities: 21 Prefectures Where the Capital Isn’t #1
- Does New Hotel Supply Cut ADR? Only Below 13,000 Rooms, 47 Prefectures
- Hiroshima 2026: 1,003 New Rooms, City Settled ADR Turns -4.1% in July
References and Sources
■ Data Sources
From OTA published price and inventory data tracked by MetroEngines Research & Consulting, we pulled monthly estimated settled ADR and listed prices for the seven Sanyo Corridor cities (Okayama Kita Ward, Kurashiki, Fukuyama, Onomichi, Mihara, Higashihiroshima and Hiroshima Naka Ward) for the 12 months from September 2025 to August 2026 (monthly median property counts: Onomichi 27, Hiroshima Naka 60, Kurashiki 42, Okayama Kita 48, Higashihiroshima 12, Fukuyama 36, Mihara 17). We also used estimated OCC by hotel type (August 2026; Okayama Prefecture 268 properties / 15,585 rooms, Hiroshima Prefecture 409 properties / 26,948 rooms), 11 new openings totaling 1,314 rooms in 2026, and remaining-room trends for Golden Week 2026 (May 1–5; 57 properties in the corridor). On the market-area side, workers from the MIC/METI “Economic Census for Business Activity (2021)” and resident population from MLIT’s National Land Numerical Information “Future Population Estimates by 250m Mesh” were aggregated within a 1km radius of each node’s center point. Land prices are commercial averages from the 2026 Land Price Publication.
■ Modeling Assumptions
The sensitivity analysis uses a common 100-room limited-service model and estimates room revenue only, with annual OCC of 70% (pessimistic), 78% (base) and 85% (optimistic), and estimated settled ADR at ±10% of the 12-month average (RevPAR = estimated settled ADR × annual OCC; annual room revenue = RevPAR × 100 rooms × 365 days). Land acquisition cost assumes a 1,200㎡ site, based on approx. 3,300㎡ gross floor area and a 280% floor-area ratio, multiplied by each city’s average published commercial land price. Estimated OCC in the text (Okayama 88.1%, Hiroshima 90.6%, etc.) is a single-month August 2026 estimate based on OTA-listed inventory and is not used as an annual occupancy assumption. Worker-to-resident ratio = workers ÷ residents within a 1km radius. Land price per ¥1 of ADR = published commercial land price ÷ estimated settled ADR.
■ Limitations
The estimates in this article cover only room revenue and land acquisition cost and do not reflect (1) construction costs, FF&E and pre-opening costs, (2) labor, operating costs and GOP margin, (3) interest, cap rates and taxes, (4) reductions in usable floor-area ratio from zoning, setback and shadow regulations, or (5) gaps between individual sites’ roadside land values and city/ward average land prices (in particular, Okayama uses the citywide average because no ward breakdown is available). They therefore cannot be used to judge yields, IRR or investment decisions. Mihara, Higashihiroshima and Onomichi each had only two covered properties in Golden Week 2026, so their medians need a wide margin of interpretation. Estimated settled ADR is an estimate; checked against property-level results disclosed by listed hotel REITs (91 properties, most recent three months), the median error is about 7%. Estimated OCC is based on how OTA-sold inventory was absorbed and differs from each property’s total actual occupancy.
■ Market Data
- MetroEngines Research & Consulting — estimated settled ADR (monthly by municipality, Sep 2025–Aug 2026), listed prices, estimated OCC (based on OTA-listed inventory), remaining-room trends (room basis), new openings (based on confirmed OTA listings), room stock
■ Government Statistics and Public Data
- MLIT, National Land Numerical Information “Future Population Estimates by 250m Mesh (2024 estimates)” — resident population, age structure and 2040 projection within 1km of each center point
- MIC and METI, “Economic Census for Business Activity (2021)” (boundaries = 2020 Census small areas / e-Stat Statistical GIS) — establishments, workers and office share within 1km of each center point
- MLIT, “Statistical Survey on Building Construction” — planned and under-construction projects in the corridor (based on building confirmation applications)
- 2026 Land Price Publication: Okayama City commercial land average (MLIT, via Tochidai data)
- 2026 Land Price Publication: Kurashiki commercial land average
- 2026 Land Price Publication: Fukuyama commercial land average
- 2026 Land Price Publication: Onomichi commercial land average
- 2026 Land Price Publication: Mihara commercial land average
- 2026 Land Price Publication: Hiroshima Naka Ward commercial land average
■ Press Releases and Company Announcements
- “One of Okayama’s largest, 600 rooms: APA Hotel & Resort Okayama-eki Shinkansenguchi opens today” (APA Hotel Co., Ltd., August 6, 2026; Japanese)
- APA Hotel & Resort Okayama-eki Shinkansenguchi official website (facility overview and room configuration)
- Shimanami Japan — cycling stay demand along the Shimanami Kaido