

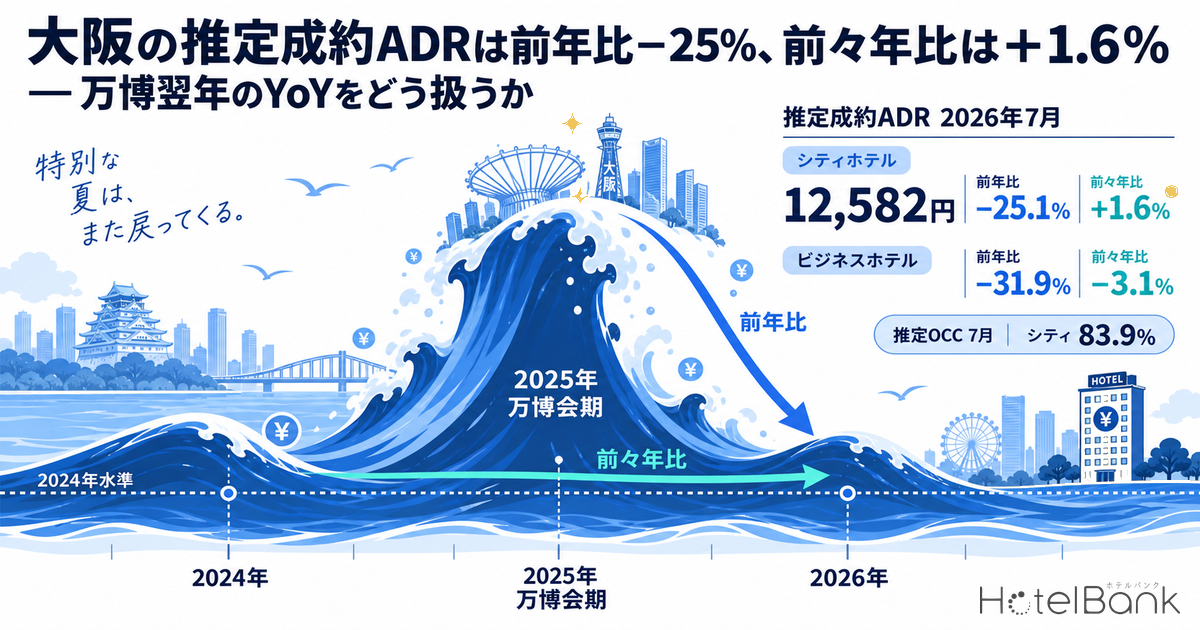
The settled ADR estimate for city hotels in Osaka Prefecture was ¥12,582 in July 2026 (N=97 properties). Against ¥16,798 in July 2025 (N=90 properties), that is a steep −25.1% drop. Business hotels fell even further: ¥8,429 in July 2026 (N=497) versus ¥12,380 in July 2025 (N=502), or −31.9%. On the numbers alone, this looks like a market collapse. But compare the same July with 2024 and city hotels moved from ¥12,384 to ¥12,582 (+1.6%), while business hotels went from ¥8,698 to ¥8,429 (−3.1%). In other words, rate levels have broadly returned to 2024 — what has broken down is the comparison base. Because Expo 2025 Osaka, Kansai ran from April 13 to October 13, 2025, Osaka’s YoY figures will stay structurally and heavily negative for the next year. This article lines up closed-month settled ADR back to 2024 and uses three lenses — YoY, two-year change and estimated OCC — to set out how to treat YoY in a market whose prior year was exceptional.
Scope: city hotels (N=97 properties), business hotels (N=497) and capsule hotels (N=10) in Osaka Prefecture. Rate metrics in this article are settled ADR estimates (the achieved rate level estimated from OTA and other sales data, tax-excluded equivalent); occupancy is an estimate based on OTA-listed inventory. Definitions are at the end of the article. Data as of September 12, 2026.
- — Osaka city hotels posted a settled ADR of ¥12,582 in July 2026, −25.1% YoY. Against July 2024 the change is +1.6%: rates have simply returned to where they were two years ago.
- — The segments that surged most now look like they are falling hardest. Business hotels’ April–August average was +41.6% in 2025 versus 2024, and −0.7% in 2026. The shape of the denominator becomes the shape of the YoY.
- — The Expo ran April 13 – October 13, 2025. For the overlapping April–October months YoY is structurally depressed; from November the comparison base is back outside the Expo period.
- — Even in months when rates fell 30%, estimated OCC held at 79.5–85.7% for city hotels and 77.1–83.4% for business hotels. What fell was rate, not sell-through.
- — Holding reference RevPAR after a 5% rate cut requires +4.4pt of extra occupancy, so a strategy of winning revenue back through discounting is hard to make work.
City hotels: −25.1% YoY and +1.6% vs 2024 — two faces of the same month
First, overlay three years of city hotel settled ADR using closed values only (figures after the month is finalized). Throughout 2024, rates moved within a ¥11,000–¥13,200 range. In 2025 they tracked 2024 through March, jumped to ¥15,981 in April, peaked at just under ¥17,000 in July and ¥17,291 in August, stayed on a plateau to ¥16,085 in October, then fell to ¥14,484 in November and ¥13,951 in December. The elevated period lines up almost exactly with the Expo (April 13 – October 13, 2025).
In 2026, rates were ¥13,091 in April, ¥12,878 in May, ¥10,769 in June, ¥12,582 in July and ¥13,078 in August — back on a track that nearly overlaps the same months of 2024 (¥12,216 / ¥12,018 / ¥11,460 / ¥12,384 / ¥13,203). On a five-month April–August average: ¥12,256 in 2024 → ¥16,026 in 2025 (+30.8%) → ¥12,480 in 2026 (+1.8% vs 2024). 2025 alone sits on a raised “island”, and as long as that island is the comparison, YoY will inevitably be negative by double digits.
Source: Compiled by HotelBank Editorial Team from MetroEngines Research data
Business hotels: segments that surged most look like they are falling hardest
With roughly 500 properties, business hotels are the series that best reflects the underlying tone of the Osaka market. In 2024 rates ranged from ¥8,200 to the ¥10,000s. In 2025 they leapt into the ¥13,000s — ¥12,917 in April and ¥13,383 in May — with a yearly high of ¥13,450 in September, sustained to ¥13,113 in October. The April–August average went from ¥8,984 in 2024 to ¥12,725 in 2025, +41.6%. That exceeds city hotels’ +30.8%, meaning the segment with the lower absolute room rate reacted more strongly in percentage terms to the same demand event.
The same five-month average for 2026 was ¥8,926, −0.7% versus 2024 — essentially flat. Even so, YoY reads −23.8% in April, −27.5% in May, −32.8% in June, −31.9% in July and −33.6% in August, appearing to worsen month by month. That is not because 2026 keeps falling, but because 2025 kept rising from spring into summer. The shape of the denominator becomes the shape of the YoY, and it has to be read that way. The same decomposition using closed values as of June is summarized in Osaka Settled ADR June 2026: City −26.3%, Business −32.8% Post-Expo.
Source: Compiled by HotelBank Editorial Team from MetroEngines Research data
Placing YoY and two-year change on the same axis makes this dual structure clear. For each month from April to August, YoY sinks sharply — city hotels −16.6% to −26.3%, business hotels −23.8% to −33.6% — while change versus 2024 stays within −6.0% to +7.2% for city hotels and −5.5% to +6.5% for business hotels. The two-year comparison oscillates around zero: relative to 2024 levels, rates have not moved far in either direction. How to separate last year’s uplift from the underlying trend is a question that deserves its own analysis.
Source: Compiled by HotelBank Editorial Team from MetroEngines Research data
Three-year comparison table for closed months — capsule hotels show the same shape
The table below lines up closed months (January–August 2026) for the three segments against the same months one and two years earlier. Capsule hotels have a small sample (N=8–10 properties) and serve only as a supplementary reference, but their April–August average went from ¥3,813 in 2024 → ¥5,084 in 2025 (+33.3%) → ¥4,122 in 2026 (+8.1% vs 2024), showing the same “2025-only island” pattern as city and business hotels. Capsule rates in 2026 sit slightly above 2024, suggesting some lift in the low-price tier remains.
| Month | City 2026 (N=91–97) | YoY | vs 2024 | Business 2026 (N=495–503) | YoY | vs 2024 | Capsule 2026 (N=8–10) | YoY | vs 2024 |
|---|---|---|---|---|---|---|---|---|---|
| Jan | ¥14,015 | +25.0% | +27.8% | ¥9,144 | +3.9% | +11.7% | ¥5,748 | +47.0% | +40.0% |
| Feb | ¥11,421 | −3.0% | +1.1% | ¥8,430 | −11.1% | −5.0% | ¥4,144 | +7.4% | +9.2% |
| Mar | ¥12,792 | −3.1% | +7.2% | ¥9,324 | −8.9% | −0.9% | ¥4,486 | +1.8% | +16.3% |
| Apr | ¥13,091 | −18.1% | +7.2% | ¥9,845 | −23.8% | +3.3% | ¥4,476 | −15.9% | +14.9% |
| May | ¥12,878 | −16.6% | +7.2% | ¥9,699 | −27.5% | +6.5% | ¥4,407 | −14.3% | +15.2% |
| Jun | ¥10,769 | −26.3% | −6.0% | ¥7,884 | −32.8% | −5.5% | ¥3,762 | −16.6% | +4.8% |
| Jul | ¥12,582 | −25.1% | +1.6% | ¥8,429 | −31.9% | −3.1% | ¥3,943 | −18.3% | +8.6% |
| Aug | ¥13,078 | −24.4% | −0.9% | ¥8,772 | −33.6% | −5.1% | ¥4,024 | −28.4% | −2.4% |
Settled ADR, closed values (after monthly finalization) / Source: Compiled by HotelBank Editorial Team from MetroEngines Research data
January shows large gains — +25.0% for city hotels and +47.0% for capsule hotels — because January 2026 rates came in above the prior year, demonstrating that YoY turns positive in a straightforward way for months outside the Expo period. The most practically useful information in this table is the monthly switch: only from April, when the months overlap with the Expo, does YoY flip to double-digit declines.
Decomposing with estimated OCC — rates have normalized, but sell-through has not fallen
When rates drop 30% YoY, the first practical question is whether demand itself has shrunk or only rates have normalized. We check using estimated OCC (based on OTA-listed inventory). The Osaka city hotel cohort (N=35 properties / 8,016 rooms as of August 2026, based on major booking-site listings) recorded 85.7% in May 2026, 79.5% in June, 83.9% in July and 83.6% in August. The business hotel cohort (N=282 properties / 47,378 rooms) recorded 83.4% in May, 77.1% in June, 81.1% in July and 80.1% in August.
| Stay month (2026) | City est. OCC (N=34–35) | Business est. OCC (N=282–288) |
|---|---|---|
| May | 85.7% | 83.4% |
| Jun | 79.5% | 77.1% |
| Jul | 83.9% | 81.1% |
| Aug | 83.6% | 80.1% |
Estimated OCC (OTA-listed inventory basis), stay-month actuals / Source: Compiled by HotelBank Editorial Team from MetroEngines Research data
All four months sit around 80%, with a seasonal shape of a slight dip in June and a recovery in July–August. Estimated OCC is based on how listed inventory sells through and is defined differently from actual room occupancy, so its level cannot be placed directly next to a hotel’s own results. Still, the finding that there is no sign of inventory sell-through breaking down in months when rates fell 30% YoY is meaningful for diagnosing the cause of lower rates. Rates that had been pushed up the year before have receded while volume has broadly held — if that decomposition holds, the right response leans toward re-setting prices rather than additional investment to stimulate demand.
Mapping the rate vs. sell-through trade-off on two axes — reference RevPAR sensitivity
The previous sections established that rates have returned to 2024 levels and sell-through has not fallen. The next thing needed is a yardstick that evaluates pricing decisions not on rate alone but on the product of rate and sell-through. Using the July 2026 market level for Osaka city hotels — settled ADR of ¥12,582 (N=97 properties) and estimated OCC of 83.9% (estimate, July 2026, aggregated on an OTA-listed inventory basis, N=35 properties) — as the base, the table below shows reference RevPAR (= settled ADR × estimated OCC) when rate is shifted ±10% and occupancy ±6pt.
| Settled ADR \ Est. OCC | 77.9% | 80.9% | 83.9% | 86.9% | 89.9% |
|---|---|---|---|---|---|
| -10% (¥11,324) | 8,821 | 9,161 | 9,501 | 9,840 | 10,180 |
| -5% (¥11,953) | 9,311 | 9,670 | 10,028 | 10,387 | 10,746 |
| +0% (¥12,582) | 9,801 | 10,179 | 10,556 | 10,934 | 11,311 |
| +5% (¥13,211) | 10,291 | 10,688 | 11,084 | 11,480 | 11,877 |
| +10% (¥13,840) | 10,782 | 11,197 | 11,612 | 12,027 | 12,442 |
The shaded cell is the base (¥12,582 × 83.9% = ¥10,556). Estimated OCC is based on sell-through of OTA-listed inventory and is defined differently from actual room occupancy, so the reference RevPAR here cannot be compared directly with a hotel’s actual RevPAR or published RevPAR; it is a relative indicator for reading the direction and size of changes. / Source: Compiled by HotelBank Editorial Team from MetroEngines Research data
There are two ways to read it. The first is the iso-RevPAR line. Holding reference RevPAR after a 5% rate cut requires occupancy to rise from 83.9% to 88.3% (+4.4pt); a 10% cut requires 93.2% (+9.3pt). Given that May–August actuals ranged from 79.5% to 85.7%, +9.3pt lies beyond any realistic lever. The table confirms that a strategy of winning revenue back through discounting is hard to make work. The same relationship holds for business hotels (¥8,429 × 81.1% = ¥6,836): a 5% rate cut demands +4.3pt of additional sell-through.
The second is decoupling from how YoY looks. The −25.1% YoY figure is purely a rate comparison; if sell-through is maintained, the decline in reference RevPAR is roughly the same as the rate decline — that is, last year’s uplift has simply dropped out. Conversely, if a hotel’s own reference RevPAR is falling more than its rate, that can be isolated as a sell-through problem specific to the hotel rather than a market factor. The sensitivity table gives a guide to how wide a band that judgment can reasonably use.
Setting it against published nationwide portfolio results — Osaka’s decline is not a national story
Another cross-check is comparison with published operating results. The July 2026 results disclosed by listed hotel REITs (all quoted as published) are shown below; ADR YoY for each falls within the ±1% range.
| REIT (scope) | Occupancy | ADR | RevPAR | ADR YoY |
|---|---|---|---|---|
| Invincible Investment Corporation (インヴィンシブル投資法人) — 101 domestic hotels | 86.3% | ¥15,100 | ¥13,039 | −1.0% |
| Japan Hotel REIT Investment Corporation (ジャパン・ホテル・リート投資法人) — 29 hotels with variable rent, etc. | 83.1% | ¥21,806 | ¥18,119 | +0.1% |
| Ichigo Hotel REIT Investment Corporation (いちごホテルリート投資法人) — entire portfolio | 84.4% | ¥9,684 | ¥8,175 | −0.8% |
Source: Monthly operating results disclosed by each REIT (July 2026, published figures). Source URLs are listed at the end of the article.
These are totals for nationally diversified portfolios, not Osaka-only figures — which is exactly why they matter. Nationwide, ADR landed roughly flat YoY, while Osaka in the same month fell −25% to −32% depending on segment. The gap is more consistent with a rebound from Osaka’s own prior-year uplift than with a nationwide rate decline. When explaining a hotel’s YoY internally or to owners, simply placing the nationwide published results alongside shifts the discussion from “the whole market is deteriorating” to “how the YoY comparison is designed”. A separate check worth running is making sure the decline is not mistaken for the effect of new supply.
Settled ADR from September 2026 onward is an estimate based on current sales. City hotels show ¥12,722 for September, ¥15,637 for October and ¥15,198 for November; business hotels show ¥9,235, ¥10,599 and ¥11,087 (city N=97 properties, business N=482–495), a shape that rises toward autumn. These are not closed values and will move as sales change; straightforward comparison with closed values must wait for month-end finalization.
| Segment | Stay month (2026) | Current estimate | Reference range (±6.6%) |
|---|---|---|---|
| City | Sep | ¥12,722 | 11,882–¥13,562 |
| City | Oct | ¥15,637 | 14,605–¥16,669 |
| City | Nov | ¥15,198 | 14,195–¥16,201 |
| Business | Sep | ¥9,235 | 8,625–¥9,845 |
| Business | Oct | ¥10,599 | 9,899–¥11,299 |
| Business | Nov | ¥11,087 | 10,355–¥11,819 |
Reference ranges apply the 6.6% median error, obtained from reconciliation with published operating results, above and below the current estimate. Note that this is not a statistical confidence interval but a band mechanically derived from the median of past reconciliation errors. For city hotels in October the range is ¥14,605–¥16,669; for business hotels in October, ¥9,899–¥11,299. For pricing decisions it is realistic to work with this band rather than the point estimate, and narrow it once values are finalized. / Source: Compiled by HotelBank Editorial Team from MetroEngines Research data
For revenue managers running city and business hotels in Osaka — implications and action plan
(1) Stop using YoY as a standalone decision input. From April to August 2026, Osaka city hotels were −16.6% to −26.3% YoY and business hotels −23.8% to −33.6%. Explaining a gap that wide every month is exhausting. Running change versus two years earlier (vs 2024) in parallel brings July to +1.6% for city hotels and −3.1% for business hotels — a range you can actually decide with. A practical design is to make the two-year comparison the headline metric in internal reports and move YoY to a “reference” column.
(2) Don’t base the 2027 budget on 2025. 2025 actuals for the Expo-overlapping April–October period include an uplift of +30.8% versus 2024 for city hotels and +41.6% for business hotels (April–August averages). Setting “flat to last year” or “last year plus alpha” from those actuals automatically produces unattainable targets. Using 2024 as the base year and building growth from there is easier to justify.
(3) Always separate rate declines from volume declines. Estimated OCC for May–August 2026 was 79.5–85.7% for city hotels and 77.1–83.4% for business hotels, with no sign of sell-through collapsing in months when rates fell sharply. Run the same decomposition for your own hotel: if OCC holds at roughly market levels, you can conclude that what fell was rate, not demand. If OCC is falling at the same time, the next step is to look for hotel-specific issues rather than market factors.
(4) The autumn shape is upward — but wait for finalization. Current estimates show October–November higher than September for both city and business hotels. For months outside the Expo period (January–March 2026), YoY came in as straightforward gains or small declines, and from November 2026 the prior-year comparison base also falls outside the Expo period. There is room to mark in advance on the pricing calendar the point when YoY returns to being a usable metric.
| Time horizon | Action | Decision trigger (figures from the article) | Aim |
|---|---|---|---|
| Today – this week | Add a vs-2024 (two-year) column to regular internal reports | If your April–August YoY is a double-digit decline broadly in line with the market (city −16.6% to −26.3% / business −23.8% to −33.6%) | Separate market factors from hotel-specific factors and avoid unnecessary rate cuts |
| Today – this week | Benchmark your ADR for the latest closed months (July–August) against market levels | If your hotel sits well below the market (city ~¥12,600 in July / ~¥13,100 in August; business ~¥8,400 in July / ~¥8,800 in August) | Identify the price band to return to |
| Within 2 weeks | Compare the shape of your monthly OCC with the market’s estimated OCC (dip in June, recovery in July–August) | If the market held around 80% in May–August but only your hotel fell | Pin down whether the issue is rate-driven or volume-driven |
| Within 2 weeks | Review autumn (October–November) rate settings against the market shape in current estimates | If current market estimates show a higher shape than September (city ~¥15,600 in October / ~¥15,200 in November; business ~¥10,600 / ~¥11,100) while your hotel stays at September levels | Avoid missing the seasonal uplift (note these are not closed values) |
| Toward next month | Start discussions with owners/headquarters on switching the FY2027 budget base year to 2024 | Given that April–August 2025 includes an uplift of +30.8% (city) / +41.6% (business) versus 2024 | Head off unattainable targets before they are set |
| Toward next month | If you hold low-price inventory (capsule, etc.), check separately whether the lift has persisted | If the capsule April–August average remains slightly elevated at +8.1% vs 2024 (N=8–10 properties, small sample) | Allow for the possibility that recovery differs by segment |
Source: Compiled by HotelBank Editorial Team from MetroEngines Research data
Summary — three yardsticks for a market whose prior year was exceptional
Yardstick 1: Pin down the period overlap first. Knowing that the Expo ran from April 13 to October 13, 2025 tells you in advance which months’ YoY will be structurally depressed (April–October) and from which month YoY becomes usable again (November onward). The same exercise is needed first in any market — not just Osaka — with a major event, a large renovation or a supply shift in the prior year.
Yardstick 2: Promote the two-year comparison to the headline metric. In July 2026, Osaka was −25.1% (city) / −31.9% (business) YoY, but +1.6% / −3.1% versus 2024. When the same month and the same data appear to point to opposite conclusions, the first step is to state which yardstick is being used; which one is “right” comes later.
Yardstick 3: Always look at rate and sell-through on two axes. The fact that estimated OCC held at 79.5–85.7% for city hotels and 77.1–83.4% for business hotels in May–August 2026 acts as a guard against reading a rate decline as lost demand. The fact that nationwide portfolios’ published ADR was within ±1% YoY also serves as a supporting line to isolate the nature of Osaka’s decline.
About the Data
- Definition of estimated OCC (OTA-listed inventory basis): OTA-listed-inventory occupancy = 100 − 100 × OTA-listed remaining rooms ÷ total rooms. The universe is a fixed cohort (the same set of properties for every stay date) of properties that list at least 30% of their total rooms on OTAs. It is an estimate based on sell-through of inventory sold on OTAs and is defined differently from actual room occupancy (rooms not listed are counted on the sold side, so it tends to read high). This article shows actuals for May–August 2026 stay months in Osaka Prefecture.
- Booking curves: based on observations from 45 days before the stay date to the most recent point.
- Definition of settled ADR: the achieved rate level (tax-excluded equivalent) estimated from OTA and other sales data (lowest-plan level × segment-specific factor, ensembled across multiple channels). Past months are closed values; current and future months are estimates based on current sales. Median error versus published operating results is 6.6%. YoY and two-year changes in this article are calculated only between closed months (values after monthly finalization).
- Breakdown of N: settled ADR covers Osaka Prefecture city hotels N=83–97 properties (varies by month), business hotels N=484–503 and capsule hotels N=7–17. Estimated OCC covers Osaka Prefecture city hotels N=34–35 properties / 8,016 rooms and business hotels N=282–288 properties / 47,378 rooms (both based on major booking-site listings, as of August 2026).
- Capsule hotels have a small sample (N=8–10 properties) and are treated as a supplementary reference in this article.
- Data as of September 12, 2026. Sales and inventory change daily, so the figures in this article are a snapshot at the time of retrieval.
References and Sources
■ Data Sources
Settled ADR: monthly aggregates for city, business and capsule hotels in Osaka Prefecture (January 2024 – November 2026, retrieved September 12, 2026). Estimated OCC: fixed-cohort aggregates calculated from listed inventory on major booking sites (May–August 2026 stays). Occupancy, ADR and RevPAR used for the nationwide comparison are the July 2026 monthly operating results published by each REIT. Expo dates are from the organizer’s official website overview.
■ Calculation Assumptions
YoY and two-year changes are calculated only between values after monthly finalization (months with current estimates are not used in ratio calculations). April–August averages are simple averages of the five months for each segment. Reference RevPAR is the product of settled ADR and estimated OCC; because the two metrics have different populations (ADR N=97 properties etc., OCC N=35 etc.), it is used only to read sensitivity, not levels. Reference ranges for current estimates apply the 6.6% median error from reconciliation with published operating results above and below the estimate.
■ Limitations
Settled ADR is an estimate from sales data, not the actual achieved rate itself. Estimated OCC is based on sell-through of OTA-listed inventory and counts unlisted rooms on the sold side, so it reads higher than actual room occupancy. Capsule hotels have a small sample (N=8–10 properties) and large single-month swings. Figures from September 2026 onward are not closed values and will move with sales. Published nationwide portfolio results differ by REIT in scope and rent structure and cannot be compared directly with Osaka-only levels.
- EXPO 2025 Osaka, Kansai, Japan official website — Overview (held April 13 – October 13, 2025)
- Invincible Investment Corporation — Monthly operating results, July 2026 (PDF, Japanese)
- Japan Hotel REIT Investment Corporation — Monthly performance data (XLSX, Japanese)
- Ichigo Hotel REIT Investment Corporation — Monthly operating results, July 2026 (PDF, Japanese)