

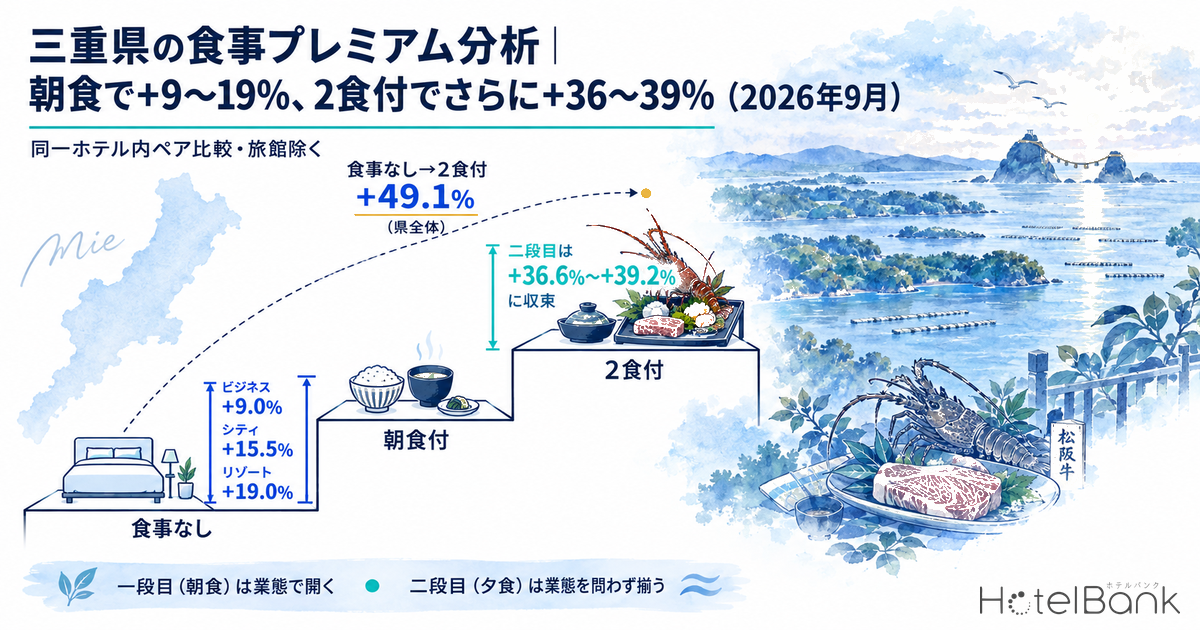
At hotels in Mie Prefecture, the price of “adding breakfast” is observed for September 2026 stays as a gap of +9.0% at business hotels (N=59 properties), +15.5% at city hotels (N=13 properties) and +19.0% at resort hotels (N=7 properties). Going one step further to half board (breakfast and dinner) adds another +39.2% at resorts (N=8 properties), +38.2% at business hotels (N=17 properties) and +36.6% at city hotels (N=8 properties) over the with-breakfast baseline — more than double the height of the first step. Across the prefecture as a whole, the gap between no meals and half board is +49.1% (N=47 properties). In Mie, a prefecture with culinary tourism assets such as Ise-Shima and Matsusaka, how this “two-step staircase” is designed and when it is shown to the guest is one of the few levers that moves RevPAR when occupancy alone will not.
About the data in this article
Scope: hotels in Mie Prefecture (ryokan excluded; paired comparison limited to properties selling more than one meal type within the same hotel. Meal premiums compare September 2026 stays on a like-for-like two-guest occupancy basis, N=95 properties overall). The price metric in this article is estimated settled ADR (the transaction price level estimated from OTA and other sales data, tax-exclusive equivalent); occupancy is an estimate based on OTA-listed inventory. Both definitions appear at the end of the article. Data as of September 11, 2026.
- — The first step (breakfast) runs +9.0% to +19.0%: for September 2026 stays, business +9.0% (N=59 properties), city +15.5% (N=13 properties), resort +19.0% (N=7 properties).
- — The second step (half board) runs +36.6% to +39.2%: measured against the with-breakfast baseline it is consistent across property types, and the prefecture-wide move from no meals to half board is +49.1% (N=47 properties).
- — The breakfast premium moves by month and by area: business hotels went from −1.8% in May to +9.0% in September (N=59 properties), and by city the range runs from −5.4% in Kameyama to +20.7% in Shima (N=5 properties each).
Reading Mie’s meal premiums through within-hotel paired comparison
When meal-plan pricing is examined with market data, the most fragile part is how the comparison is built. Put a population of largely room-only business hotels together with resorts and ryokan, where half board is the standard, take an average, and the gap that emerges is not “the price of the meal” but the difference in the mix of property types. This article therefore uses a paired comparison: only properties that sell both room-only (no meals) and with-breakfast, or both with-breakfast and half board, within the same hotel are extracted, and the differential inside each property is aggregated. Because grade, location and room-count conditions are automatically held constant, what remains is closer to the pricing of the meal itself. The base is stated each time as N=, the number of properties that sold both types within the same hotel (properties forming a valid pair).
Note that ryokan are excluded from the aggregation. At ryokan, half board is the standard form and room-only plans appear only as exceptions, so taking the small number of properties that form a pair would mean describing “the price of an exceptional plan” as the overall picture, which changes the meaning of the comparison.
Source: MetroEngines Research; compiled by the HotelBank Editorial Team
What the chart shows is a structure in which Mie’s meal premiums are dispersed across property types on the first step but aligned across all of them on the second. The first step, breakfast, spans +9.0% to +19.0% — a gap of more than two to one between property types — whereas the second step from with-breakfast to half board sits in a narrow +36.6% to +39.2% band, with city, business and resort hotels all landing between 36% and 39%. Nationally, the size of the dinner uplift over a with-breakfast baseline at business hotels varies widely by prefecture, with a national median in the high +20% range.
| Segment | Breakfast vs no meals | Half board vs breakfast | Half board vs no meals |
|---|---|---|---|
| City hotels | +15.5% (approx. ¥3,200) N=13 properties | +36.6% (approx. ¥10,200) N=8 properties | +59.7% (approx. ¥14,300) N=8 properties |
| Business hotels | +9.0% (approx. ¥1,300) N=59 properties | +38.2% (approx. ¥6,500) N=17 properties | +46.4% (approx. ¥7,500) N=17 properties |
| Resort hotels | +19.0% (approx. ¥7,100) N=7 properties | +39.2% (approx. ¥16,900) N=8 properties | +54.2% (approx. ¥21,200) N=8 properties |
| Mie Prefecture, all properties | +8.3% (approx. ¥1,600) N=95 properties | +41.7% (approx. ¥10,700) N=47 properties | +49.1% (approx. ¥12,000) N=47 properties |
Source: MetroEngines Research; compiled by the HotelBank Editorial Team (September 2026 stays; ryokan excluded; within-hotel paired comparison)
One more thing worth pinning down is where “dinner only” sits. Across Mie as a whole, the gap between dinner-only (no breakfast) and no meals is +32.5% (N=15 properties), or roughly ¥8,700. Only 15 properties form a valid pair for dinner-only, which tells us it is not the mainstream in the prefecture. The reality of meal sales in Mie is that breakfast creates the entry point, while dinner is sold mainly as part of a half-board bundle. That structure also means the path to adding dinner as a standalone item is sitting open.
The first step (breakfast) moves by month — May to September, and the gaps between areas
The breakfast premium is not a fixed value. Tracking the most recent five months in Mie (stays from May to September 2026), business hotels moved roughly 11 points, from −1.8% in May (N=59 properties) to +9.0% in September (N=59 properties). The negative reading in May was driven mainly by Yokkaichi (−32.7%, N=12 properties), where the average on the room-only side ran well above the with-breakfast side — a reminder that when room-only rates spike, the added value of breakfast can be swallowed by the scarcity of the room itself.
Source: MetroEngines Research; compiled by the HotelBank Editorial Team
City hotels held a consistently high level of +13.9% to +22.0% (N=13–14 properties) across the five months, peaking at +22.0% in June before easing gradually to +15.5% in September. Resort hotels swung the most, from +9.0% to +24.0% (N=7–8 properties), recovering from +9.0% in August to +19.0% in September. In May all three property types sat near their five-month lows (city +13.9%, business −1.8%, resort +9.1%), which suggests a tendency for the breakfast premium to compress in busy months and widen when demand slackens (though city hotels did not compress in August, at +18.1%). Read the other way round, breakfast works hardest as a rate measure in the months when it is difficult to raise the room rate.
At municipal level, the height of the first step differs sharply even within the same prefecture. For September 2026 stays, across all segments, the picture is as follows.
| City | Breakfast vs no meals | Differential | N (properties forming a pair) |
|---|---|---|---|
| Shima | +20.7% | approx. ¥8,900 | 5 properties |
| Matsusaka | +15.0% | approx. ¥1,600 | 6 properties |
| Yokkaichi | +11.0% | approx. ¥1,900 | 12 properties |
| Ise | +10.9% | approx. ¥2,400 | 6 properties |
| Tsu | +9.7% | approx. ¥1,200 | 11 properties |
| Suzuka | +7.1% | approx. ¥900 | 6 properties |
| Kameyama | −5.4% | approx. −¥900 | 5 properties |
Source: MetroEngines Research; compiled by the HotelBank Editorial Team (September 2026 stays; ryokan excluded; within-hotel paired comparison; only cities with at least 5 properties forming a pair)
Shima, a tourist destination, stands out at +20.7% (N=5 properties, approx. ¥8,900), while Matsusaka is high in percentage terms at +15.0% but the differential is only about ¥1,600. The percentage and the amount do not necessarily agree, so which of the two a hotel uses as its own benchmark needs to be a deliberate choice. Kameyama is negative at −5.4% (N=5 properties), but segments with as few as 5 properties forming a pair should be treated as directional only.
Evidence from the demand side — what happens in the final run-up
Upselling meal plans does not work unless it is designed together with the way demand tightens. Looking at the booking curve for business hotels in Mie from 45 days before the stay date through to the most recent observation, September 19 (Saturday), the first day of the five-day holiday run (September 19–23), went from 71.0% at 45 days out to 79.2% at 30 days out and 98.3% at the most recent observation (9 days out) — a gain of +27.3 points from 45 days out. The scope is 64 properties and 6,985 rooms (based on listings on major booking sites).
Source: MetroEngines Research; compiled by the HotelBank Editorial Team
October 10 (Saturday), also a Saturday, starts from a higher level than September 19, at 79.3% 45 days out and 87.2% 30 days out (64 properties, 7,112 rooms). The weekday Friday of September 25, by contrast, runs 67.3% at 45 days out, 70.5% at 30 days out and 78.6% at 15 days out (65 properties, 7,132 rooms), a gain of only +11.3 points. For reference, the confirmed estimated OCC (based on OTA-listed inventory) for Mie business hotels in August 2026 averaged 83.6% for the month (63 properties, 6,921 rooms).
What this reveals is Mie’s demand pattern: weekends and holiday runs fill in a rush once fewer than 30 days remain, while weekdays leave space open until the last minute. The former is the phase where “the volume will come anyway — the question is how to stack rate on top”, the latter the phase where a hotel is still going after guest count, and meal plans should be presented differently in each. Our separate coverage of Mie’s five-day September holiday breaks the run down day by day and shows how the timing of the tightening differs between ryokan and business hotels.
The movement of rate itself is also worth pinning down. Comparing Mie’s estimated settled ADR on a confirmed-to-confirmed basis (January–August averages for 2025 and 2026), business hotels went from ¥6,700 to ¥7,000, up +3.7% (N=93–98 properties), while city hotels went from ¥8,100 to ¥7,700, down −5.1% (N=16–18 properties). Business hotels are climbing gently, but city hotels are below the prior year. In an environment where there is limited room to push through on room rate alone, whether a hotel holds a second rate axis in the form of meals is what separates the results.
| Segment (Mie Prefecture) | Jan–Aug 2025 average | Jan–Aug 2026 average | Year on year |
|---|---|---|---|
| Business hotels (N=93–98 properties) | ¥6,723 | ¥6,971 | +3.7% |
| City hotels (N=16–18 properties) | ¥8,121 | ¥7,703 | −5.1% |
Source: MetroEngines Research; compiled by the HotelBank Editorial Team (estimated settled ADR; confirmed values compared with confirmed values. Estimates for the current and future months are not included)
For revenue managers operating hotels in Mie — implications and an action plan
(1) Test your own breakfast differential against the market in both percentage and amount. For a business hotel the Mie within-hotel paired-comparison position is +9.0% (differential approx. ¥1,300, N=59 properties); for a city hotel +15.5% (approx. ¥3,200, N=13 properties); for a resort hotel +19.0% (approx. ¥7,100, N=7 properties). If your breakfast differential sits clearly below that level, there is a good chance it has been left unchanged even as breakfast costs have risen. Conversely, if the percentage is high but the amount is small (the shape Matsusaka shows at +15.0% / approx. ¥1,600), that is the flip side of a low room-rate level, so it makes more sense to look at the room-side setting before raising breakfast.
(2) The second step (dinner) sits in a 36–39% range regardless of property type. Measured against the with-breakfast baseline, the half-board step is +36.6% at city hotels, +38.2% at business hotels and +39.2% at resorts — essentially aligned. That means a hotel that offers half board can set “what percentage above with-breakfast” by the convention of its property type. A property with no half-board plan, or no path to add dinner as a standalone item, can read the thinness of the prefecture’s dinner-only pairing — only 15 properties, at +32.5% — as a gap competitors have left open.
(3) The breakfast premium compresses in busy months. The window for an increase is not the busy month. The breakfast premium at business hotels moved 11 points across the months, from −1.8% in May to +9.0% in September. Trying to widen your own differential in a month when the whole market is compressing tends not to stick, whereas in months when demand slackens breakfast can become the lead actor in rate. A pricing-revision calendar works better when rooms and meals are given separate peaks.
(4) Switching guests to meal-inclusive plans in the final run-up works precisely on the days that fill. September 19 (Saturday) stacked up +27.3 points, from 71.0% at 45 days out to 98.3% at the most recent observation. On days like that, remaining inventory is scarce, and there is room to weight the mix toward meal-inclusive plans to raise the take per room rather than selling the last few rooms room-only. Conversely, a day like Friday September 25, where the gain stopped at +11.3 points, is still in the phase of going after guest count.
| Time horizon | Action | Decision trigger (figures from this article) | Objective |
|---|---|---|---|
| Today to this week | Lay out your own room-only / with-breakfast / half-board differentials on a single sheet and test them against the property-type range | If the breakfast differential remains below the property-type benchmark (business +9.0% / city +15.5% / resort +19.0%) | Make visible a differential that has been left unchanged |
| Identify the dates inside 30 days where inventory is tightening and review how room-only inventory is released | If pace on the target date is tracking the September 19 pattern (79.2% or higher at 30 days out) | Shift the remaining inventory toward a higher-rate mix | |
| Within two weeks | Redesign breakfast as the first step at the entry point (serving hours, how local ingredients are presented, the path to adding individual items) | If there is a gap between your own differential and the level in your city (Shima +20.7% / Ise +10.9% / Tsu +9.7%, and so on) | Bring the height of the first step in line with the area market |
| Offer the option of adding dinner as a standalone item (for properties with no half-board plan) | If dinner-only pairing in the prefecture stays as thin as 15 properties at +32.5% | Take the entry to the second step that competitors have left open | |
| Looking to next month | Redesign half-board pricing as a ratio to the with-breakfast baseline (a dinner that names regional ingredients such as Matsusaka beef or Ise-Shima seafood) | If your own half board sits below the 36–39% range against with-breakfast (city +36.6% / business +38.2% / resort +39.2%) | Restore the second step to the property-type level |
| Split the pricing-revision calendar between rooms and meals, and assign the review of the breakfast differential to the months when demand slackens | If your breakfast differential compressed in the busy months and has not recovered (a swing of the kind seen in business hotels, −1.8% in May to +9.0% in September) | Offset the rate-measure peak from the room-side peak |
Source: MetroEngines Research; compiled by the HotelBank Editorial Team
None of these guarantee a result; they are points to weigh against your own cost structure, kitchen capacity and guest mix. Widening the breakfast differential in particular has to come together with a review of what is served, or it rebounds as a decline in guest ratings, so the design should not let pricing run ahead on its own.
Summary — three yardsticks for measuring Mie’s meal premiums
The first yardstick is the height of the first step. In Mie the gap between with-breakfast and no meals is +9.0% at business hotels (N=59 properties), +15.5% at city hotels (N=13 properties) and +19.0% at resort hotels (N=7 properties). Decide which of those three points your own differential should be compared against, and read it in both percentage and amount.
The second yardstick is the ratio of the second step. The step from with-breakfast to half board converges on +36.6% to +39.2% regardless of property type, and prefecture-wide the move from no meals to half board is +49.1% (N=47 properties). This is a range where the convention of the property type holds, so if your own half board sits outside it, be ready to explain why.
The third yardstick is that it moves by month and by area. The breakfast premium moved 11 points over five months at business hotels, and by municipality it spans −5.4% (Kameyama) to +20.7% (Shima). The premise is to reset it by month and by area rather than treating a single figure as the annual benchmark. Mie, with culinary brands such as Ise-Shima and Matsusaka, is a market with structurally large room to extend the second step.
About the data
・Definition of estimated OCC (based on OTA-listed inventory): occupancy on an OTA-listed inventory basis = 100 − 100 × rooms remaining on OTA listings ÷ total rooms. The scope is a fixed cohort of properties that list at least 30% of their total rooms on OTAs (the same set of properties for each stay date). It is an estimate based on how the inventory sold through OTAs is taken up, and its definition differs from actual room occupancy (it reads high because unlisted rooms are counted as taken). The scope of this article is business hotels in Mie Prefecture, for August 2026 (confirmed) and for stay-date snapshots in September and October 2026.
・Booking curve: based on observations from 45 days before the stay date through to the most recent observation.
・Definition of estimated settled ADR: the transaction price level (tax-exclusive equivalent) estimated from OTA and other sales data (lowest-plan level × property-type coefficient, an ensemble across multiple channels). Past months are confirmed values; current and future months are estimates based on sales conditions at this point in time. Cross-checked against published operating results, the median error is 6.6%. The year-on-year comparison in this article is composed solely of confirmed values compared with confirmed values and does not include point-in-time estimates.
・Definition and scope of meal premiums: only properties selling more than one meal type within the same hotel are extracted, and the differential between meal types inside each property is aggregated. Comparisons are made on a like-for-like two-guest occupancy basis. Ryokan are excluded because half board is their standard form, which changes the meaning of the comparison. A simple average across all hotels is not used, as it introduces selection bias. N= is the number of properties forming a valid pair (September 2026 stays: overall N=95 properties, city N=13 properties, business N=59 properties, resort N=7 properties. For comparisons involving half board: overall N=47 properties, city and resort N=8 properties each, business N=17 properties). Segments with fewer than 5 properties forming a pair are not cited.
・Scope N for estimated settled ADR: Mie Prefecture business hotels N=93–98 properties, city hotels N=16–18 properties (varying by month). The booking-curve scope is 63–65 business hotels in Mie Prefecture and 6,921–7,132 rooms (based on listings on major booking sites).
・Data as of September 11, 2026. Sales conditions and inventory change daily, so the figures in this article are a snapshot at the time of retrieval.
Related reading
- Mie’s ryokan and resorts: demand for the first five-day holiday in 11 years concentrates in the first three days — September 20 at an estimated 97.5% OCC, 31 days before the stay
- In Mie, August’s peak days differ by property type — comparing business, ryokan and resort curves at 45 days out, 30 days out and the most recent observation
- Dissecting Oita’s meal premiums by property type — business hotels at +10.6% for breakfast and +39.3% for half board, and how to design the height of each step