

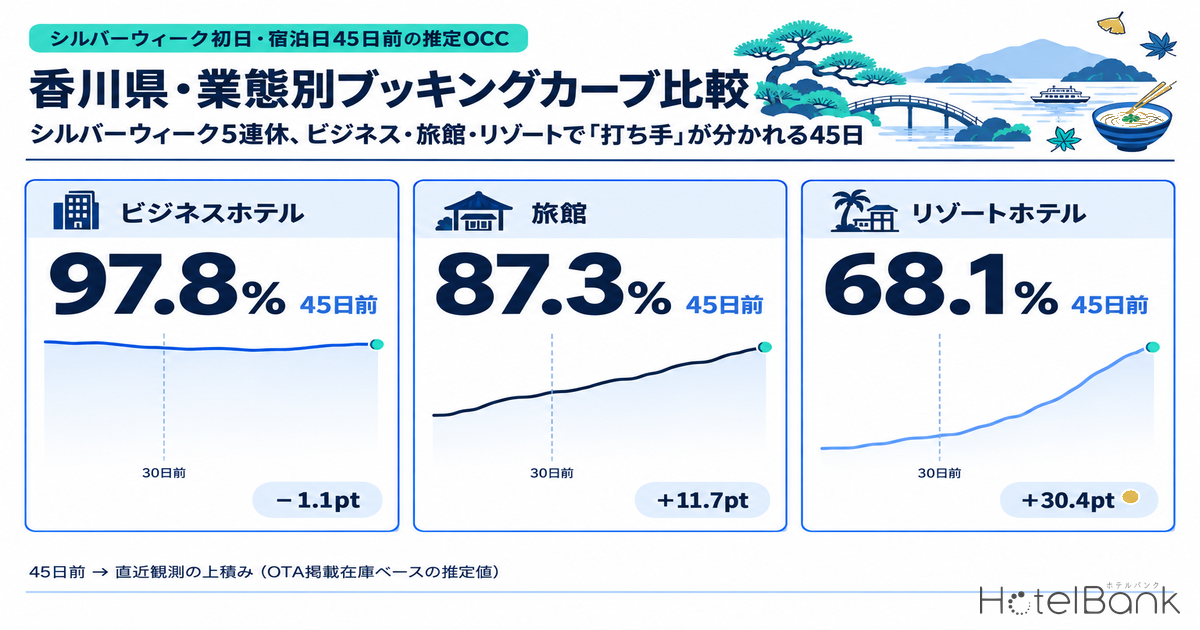
On Saturday, September 19, 2026, estimated OCC (based on OTA-listed inventory) for business hotels in Kagawa had already reached 97.8% at 45 days before the stay date (42 properties, 2,995 rooms). For the same night, ryokan stood at 87.3% (28 properties, 1,298 rooms) and resort hotels at 68.1% (11 properties, 474 rooms). Yet at the most recent observation (9 days before the stay date), business hotels were at 96.7%, ryokan 99.0% and resorts 98.5% — converging to almost the same level in the end. The destination is the same, but the road to it — the shape of the booking curve — is completely different by property type. Using Silver Week 2026, the first five-day run of holidays in 11 years, and the October weekends as material, this article lines up the curves of Kagawa’s three segments (business hotels, ryokan, resort hotels) at three checkpoints — 45 days out, 30 days out and the most recent observation — to confirm with data that the same date calls for different moves depending on the segment.
Scope: 42 business hotels (2,995 rooms), 28 ryokan (1,298 rooms) and 11 resort hotels (474 rooms) in Kagawa Prefecture — in each case a fixed cohort based on listings on major booking sites. Occupancy in this article is an estimate based on OTA-listed inventory, and no price metrics are covered. Definitions appear at the end of the article. Data as of September 11, 2026.
• OCC (occupancy) = the share of sold rooms against total rooms in the area (an estimate based on inventory sold on OTAs). In this article it is calculated on segment-level fixed cohorts made up of properties in Kagawa Prefecture that list at least 30% of their total rooms on OTAs (the formula appears in “About the Data” at the end of the article).
• Sell-out rate = the share of properties in the cohort for which no listed inventory can be confirmed (estimate).
• This article does not cover price (ADR) metrics.
• Source: MetroEngines Research (continuous tracking of OTA public rates for roughly 168,000 properties in Japan, of which about 27,000 have confirmed occupancy data)
- — The level reached at 45 days out differs by up to 29.7pt between segments. For Saturday, September 19, 2026, estimated OCC was 97.8% for business hotels, 87.3% for ryokan and 68.1% for resorts (42/28/11 properties respectively, observed as of September 11, 2026).
- — The finishing point is nonetheless almost identical. At the most recent observation (9 days before the stay date), business hotels were at 96.7%, ryokan 99.0% and resorts 98.5%. A low start is not unsold stock; it is the segment’s starting value.
- — On the National Holiday of Tuesday, September 22, business hotels gained +37.4pt, the largest build-up in this article. During a run of holidays there is always a date on which the holiday calendar inverts a weekday-type demand structure.
- — Estimated OCC and the sell-out rate carry different information. For resorts on September 22, 2026, OCC moved +28.0pt while the sell-out rate stayed fixed at 18.2% — a sign that competitor inventory remains in the market.
Silver Week day one, Saturday September 19 — business hotels “already full,” resorts “filling from here”
Silver Week 2026 is a five-day run from Saturday, September 19 to Wednesday, September 23. It comes together because Tuesday, September 22 — sandwiched between Respect for the Aged Day (September 21) and the Autumnal Equinox (September 23) — becomes a “National Holiday,” an alignment not seen since 2015, 11 years ago (see the reference materials at the end of the article for the source). Here we look at the first day of that run, Saturday September 19, through the booking curves of the three segments.
Business hotels (42 properties, 2,995 rooms) stood at an estimated OCC of 97.8% with a 76.2% sell-out rate at 45 days out, which fell on August 5, 2026. By 30 days out they had built to 99.5% and 90.5%, and from there they moved in a narrow 97-99% band through to the most recent observation. The build-up from 45 days out to the most recent observation was −1.1pt — in other words, this was a date already decided 45 days ahead. The dip in the sell-out rate to 71.4% at the most recent observation reflects observations in which selling allotments were added during the period, and can be read as rooms newly returning to the market.
Ryokan (28 properties, 1,298 rooms), by contrast, went from 87.3% at 45 days out to 99.0% at the most recent observation, +11.7pt, and resort hotels (11 properties, 474 rooms) from 68.1% to 98.5%, +30.4pt. Resorts in particular still had room to spare at 30 days out — 76.8% with an 18.2% sell-out rate — and most of their build-up occurred after that point. They reached 96.6% with a 54.5% sell-out rate at 18 days out and 98.7% with 81.8% at 13 days out, tightening sharply over the two weeks or so between 30 and 13 days out. Even for the same “Saturday that opens a holiday run,” demand concentrates at 45 days out for business hotels and after 30 days out for resorts.
Source: MetroEngines Research; compiled by the HotelBank Editorial Team
Mid-run Tuesday September 22 — all three segments move sharply, but from different starting points
Tuesday, September 22 (a National Holiday), the midpoint of the run, is a date on which all three segments build substantially from 45 days out. Their starting points, however, are completely different.
Business hotels started from a “blank slate” of 43.2% with a 4.8% sell-out rate at 45 days out, reached 55.5% at 30 days out and 80.6% at the most recent observation (12 days before the stay date). The build-up of +37.4pt is the largest of the three segments. On the weekday calendar this is a Tuesday, but because the date is a holiday the usual weekday business-travel demand disappears and leisure demand flows in late instead. The sell-out rate remains at just 23.8% even at the most recent observation, so inventory is still in the market.
Ryokan started at 72.6% at 45 days out and reached 96.5% at the most recent observation (+23.9pt). Their sell-out rate first dipped from 17.9% at 45 days out to 10.7% at 30 days out, then rose steeply late — 42.9% at 21 days out and 67.9% at 12 days out. Resorts went from 62.7% at 45 days out to 90.7% at the most recent observation (+28.0pt), but their sell-out rate barely moved from around 18.2% throughout the observation window. Inventory inside the properties is being absorbed, yet the number of sold-out properties does not increase — a pattern indicating that room types and inventory strategies are dispersed across properties (with a base of only 11 properties, a single property moves the figure by 9.1pt, so this should be read with that discount in mind).
Source: MetroEngines Research; compiled by the HotelBank Editorial Team
The October weekends — the starting position at 45 days out mirrors each segment’s character
Looking only at the holiday run risks being pulled by unusual dates, so we check two Saturdays in October within the same framework. Saturday, October 3 is an ordinary weekend with no holiday attached; Saturday, October 10 is the first day of a three-day weekend that includes Sports Day (Monday, October 12).
Lining up estimated OCC at 45 days out (both observed during August 2026): on the ordinary weekend of October 3, business hotels were at 45.1%, ryokan 72.7% and resorts 55.5%. On October 10, the first day of the three-day weekend, business hotels were at 65.0%, ryokan 89.3% and resorts 78.3% — every segment starting roughly 20pt higher for the three-day weekend. The build-up through to the most recent observation, meanwhile, was +17.4pt for business hotels, +7.3pt for ryokan and +4.8pt for resorts on October 3 (most recent observation 23 days out), and +10.1pt, +4.5pt and +5.5pt respectively on October 10 (most recent observation 30 days out). The contrast — business hotels “start low and climb late,” ryokan and resorts “start high and fill in slowly” — appears consistently on weekends outside the holiday run as well.
The difference in character is just as clear in the sell-out rate. Resorts on October 3 were consistently at 0.0% from 45 days out through to the most recent observation — not one of the 11 properties had run out of listed inventory. Ryokan on the same date went from 7.1% to 14.3%, business hotels from 2.4% to 4.8%. On October 10, by contrast, ryokan nearly doubled from 25.0% at 45 days out to 46.4% at 30 days out, capturing three-day-weekend demand early.
Source: MetroEngines Research; compiled by the HotelBank Editorial Team
The three-checkpoint matrix — four stay dates x three segments
The above is summarised in a single table. The checkpoints are three: 45 days out, 30 days out and the most recent observation. Because the lead time of the most recent observation (how many days before the stay date it falls) differs by stay date, it is noted in parentheses. Each figure carries the number of properties in scope (N).
| Stay date | Segment (N) | T-45 | T-30 | Latest obs. | T-45 → latest |
|---|---|---|---|---|---|
| Sat Sep 19 Silver Week day 1 | Business hotels (42) | 97.8% / 76.2% | 99.5% / 90.5% | 96.7% / 71.4% (T-9) | −1.1pt |
| Ryokan (28) | 87.3% / 57.1% | 94.5% / 67.9% | 99.0% / 85.7% (T-9) | +11.7pt | |
| Resorts (11) | 68.1% / 18.2% | 76.8% / 18.2% | 98.5% / 81.8% (T-9) | +30.4pt | |
| Tue Sep 22 National Holiday | Business hotels (42) | 43.2% / 4.8% | 55.5% / 9.5% | 80.6% / 23.8% (T-12) | +37.4pt |
| Ryokan (28) | 72.6% / 17.9% | 81.8% / 10.7% | 96.5% / 67.9% (T-12) | +23.9pt | |
| Resorts (11) | 62.7% / 18.2% | 70.3% / 18.2% | 90.7% / 18.2% (T-12) | +28.0pt | |
| Sat Oct 3 ordinary weekend | Business hotels (42) | 45.1% / 2.4% | 54.3% / 2.4% | 62.5% / 4.8% (T-23) | +17.4pt |
| Ryokan (28) | 72.7% / 7.1% | 76.3% / 10.7% | 80.0% / 14.3% (T-23) | +7.3pt | |
| Resorts (11) | 55.5% / 0.0% | 58.0% / 0.0% | 60.3% / 0.0% (T-23) | +4.8pt | |
| Sat Oct 10 3-day weekend, day 1 | Business hotels (42) | 65.0% / 23.8% | 75.1% / 28.6% | same as T-30 (T-30) | +10.1pt |
| Ryokan (28) | 89.3% / 25.0% | 93.8% / 46.4% | same as T-30 (T-30) | +4.5pt | |
| Resorts (11) | 78.3% / 27.3% | 83.8% / 27.3% | same as T-30 (T-30) | +5.5pt |
Each cell shows “estimated OCC (based on OTA-listed inventory) / sell-out rate.” The sell-out rate is the share of properties in the cohort for which no listed inventory can be confirmed (estimate). For October 10, the most recent observation at the time of reporting was 30 days out, so the T-30 value is the latest available.
Source: MetroEngines Research; compiled by the HotelBank Editorial Team
Reference: estimated OCC by day of week in the August 2026 actuals
The difference in curve shape also shows up in day-of-week patterns during an ordinary month. Averaging Kagawa’s daily figures for August 2026, a month now past, by day of week gives the following.
| Segment (N) | Mon | Tue | Wed | Thu | Fri | Sat | Sun | Monthly avg. |
|---|---|---|---|---|---|---|---|---|
| Business hotels (42) | 77.0% | 85.3% | 86.5% | 91.0% | 82.5% | 84.8% | 76.0% | 82.9% |
| Ryokan (28) | 78.6% | 84.3% | 83.2% | 84.1% | 87.5% | 89.2% | 83.6% | 84.3% |
| Resorts (11) | 79.0% | 82.7% | 85.6% | 83.1% | 87.8% | 92.4% | 86.5% | 85.4% |
Daily figures for August 2026 (31 days) averaged by day of week. Estimated OCC is based on OTA-listed inventory.
Source: MetroEngines Research; compiled by the HotelBank Editorial Team
Business hotels peak on Thursday (91.0%) and bottom out on Sunday (76.0%), a peak-to-trough gap of 15.0pt. Ryokan show a 10.6pt gap between Saturday (89.2%) and Monday (78.6%), resorts a 13.4pt gap between Saturday (92.4%) and Monday (79.0%). It is worth noting that the basic pattern — business hotels centred on weekdays, ryokan and resorts on Friday and Saturday — holds even in August, the peak of leisure demand.
For revenue managers running hotels and ryokan in Kagawa — implications and an action plan
(1) Hold “the level reached at 45 days out” as a segment-specific benchmark. Even for the same Saturday, September 19, the market level at 45 days out was completely different: 97.8% for business hotels, 87.3% for ryokan, 68.1% for resorts. When checking your own booking pace against the market, using a neighbouring segment’s figure as the yardstick leads to a misreading. Standardise on a single comparison: above or below the 45-day-out level of the segment your property belongs to.
(2) Build “remaining upside” into your read of the segment’s character. On September 19, resorts added +30.4pt between 45 days out and the most recent observation, while business hotels moved −1.1pt. The resorts’ 68.1% at 45 days out is not “not selling” but “about to sell,” and rushing into discounting at that point means taking the late-arriving demand at a low rate. Conversely, business hotels’ 97.8% at 45 days out means there is almost no allotment left to capture from there on.
(3) The holiday calendar inverts a segment’s demand structure. On Tuesday, September 22, business hotels were at 43.2% at 45 days out — a ramp quite unlike the usual weekday pattern. From there they showed the largest build-up in this article, +37.4pt through to 12 days out. During a run of holidays there is always a date on which segments must be re-cut by “is it a holiday?” rather than by weekday attribute.
(4) Always read the sell-out rate and estimated OCC together. For resorts on September 22, 2026, estimated OCC moved from 62.7% to 90.7% while the sell-out rate stayed at 18.2%. Even as the market as a whole absorbs inventory, a certain number of properties keep holding stock — meaning comparable options remain in the market right up to the stay date. Judging from OCC alone that “the competition is gone” is premature. Note also that the resort base is small at 11 properties, where a single property is worth 9.1pt, so single-month and single-day movements should be read with a margin.
Building on the above, here is an action plan by time horizon. Each decision trigger is tied to a figure presented in this article.
| Horizon | Move | Decision trigger | Purpose |
|---|---|---|---|
| T-45 (45 days out) | Set a segment-level T-45 benchmark and check your own pace for the same date against it | For the Saturday that opens a holiday run, set the baseline at the market’s 97.8% if you are a business hotel, 87.3% if a ryokan, 68.1% if a resort | Separate “are we behind?” from “is this simply the shape of the segment?” |
| Take mid-run and holiday dates out of “weekday” handling and rebuild inventory and plan mix for leisure | On a September 22-type date, if your own T-45 pace is still tracking the normal Tuesday pattern | Leave allotment available to absorb the later demand of roughly +37.4pt | |
| T-30 (30 days out) | If you are well above the market level at 30 days out, consider tightening how remaining allotment is released | On a September 19-type date, when your pace is running above the market’s T-30 level (business 99.5%, ryokan 94.5%, resort 76.8%) | Avoid exhausting allotment early on a date where late demand is certain to arrive |
| If you are below it instead, review exposure and length-of-stay conditions first | On an October 3-type ordinary weekend, when your pace is clearly below the market’s T-30 level (business 54.3%, ryokan 76.3%, resort 58.0%) | On an ordinary weekend with little remaining upside, acting early makes recovery easier | |
| Last-minute (T-14 to T-7) | Check whether competitor inventory remains in the market via the sell-out rate before deciding last-minute tactics | Change the move between a date where the sell-out rate has risen to 81.8% (resorts on September 19) and one where it stays flat at 18.2% (resorts on September 22) | Avoid unnecessary rate cuts on dates where competitor inventory is thin |
| Consider adding selling allotment (re-check the curve after adding) | When allotment additions are visible on the market side — as with business hotels on September 19, where the market sell-out rate moved from 90.5% (T-30) to 71.4% (T-9) | Secure sellable allotment on a date where demand continues to the last minute |
This table organises points of focus that can be read from market data; it does not guarantee results. Whether to act on them should be judged according to each property’s inventory policy and channel mix.
Conclusion — three yardsticks that cut across segments
Lining up Kagawa’s three segments on the same stay dates, the following three points came up repeatedly. They are set out here as yardsticks usable in day-to-day operations.
First, the level reached at 45 days out is the segment’s “starting value,” not a measure of good or bad. On Saturday, September 19, business hotels’ 97.8% and resorts’ 68.1% ultimately converged to roughly the same level, 96.7% and 98.5% respectively. What should be compared is the market level within the same segment; comparing levels across segments carries no meaning.
Second, the size of the remaining upside determines how much freedom last-minute tactics have. The build-up from 45 days out to the most recent observation was −1.1pt for business hotels, +11.7pt for ryokan and +30.4pt for resorts on September 19; +37.4pt, +23.9pt and +28.0pt on September 22; and +17.4pt, +7.3pt and +4.8pt on October 3. The smaller the build-up in a given combination, the more value there is in acting before 30 days out.
Third, estimated OCC and the sell-out rate carry separate information. For resorts on September 22, 2026, OCC moved +28.0pt while the sell-out rate held immobile at 18.2%; for resorts on October 3, the sell-out rate was 0.0% from 45 days out through to the most recent observation. How far the market as a whole has absorbed inventory and whether competitor inventory exists are not the same thing. In last-minute decisions these two axes should be read separately: OCC measures how much of the cohort’s total room inventory has been taken, while the sell-out rate measures how many individual properties have run out of listed inventory.
Running through all of this is the single point set out at the start: the same date calls for different moves depending on the segment. The holiday calendar hands every segment the same date, but the timing at which demand builds on that date differs by segment. When comparing your own curve against the market, always start by taking the curve of your own segment as the baseline.
About the Data
- Definition of estimated OCC (based on OTA-listed inventory): OTA-listed-inventory occupancy = 100 − 100 x rooms remaining on OTA listings / total rooms. The scope is a fixed cohort of properties that list at least 30% of their total rooms on OTAs (the same set of properties for every stay date). It is an estimate based on how far OTA-sold inventory has been absorbed, and its definition differs from actual room occupancy (it reads higher, because rooms not listed are counted on the absorbed side).
- Booking curve: based on observations from 45 days before the stay date through to the most recent observation.
- Sell-out rate: the share of properties in the cohort for which no listed inventory can be confirmed on OTAs or elsewhere (estimate).
- Breakdown of N: 42 business hotels with 2,995 rooms, 28 ryokan with 1,298 rooms and 11 resort hotels with 474 rooms in Kagawa Prefecture (in each case a fixed cohort based on listings on major booking sites). This article covers the three segments above, for which a fixed cohort can be constructed.
- Day-of-week actuals: a simple average by day of week of daily figures for August 2026 (31 days). The properties in scope are the same as above.
- Data as of September 11, 2026. Because selling conditions and inventory change daily, the figures in this article are a snapshot at the time of retrieval.
References and Sources
■ Data sources
Time-series data on listed inventory and listed rates from major booking sites, continuously collected for accommodation properties in Kagawa Prefecture (MetroEngines Research). Booking curves were reconstructed by tracing observation dates backwards for each stay date, and the day-of-week actuals use daily values for August 2026. The scope is segment-level fixed cohorts (42 business hotels with 2,995 rooms, 28 ryokan with 1,298 rooms, 11 resorts with 474 rooms). Data retrieved as of September 11, 2026.
■ Calculation assumptions
(1) A fixed-cohort method using the same set of properties for every stay date is applied, eliminating apparent increases or decreases caused by properties entering and leaving the sample. (2) Observations are limited to lead times within 45 days. Points beyond 45 days can include observations made before selling allotment has been loaded and may not represent booking progress, so they are used in none of the curves, comparisons or exhibits in this article. (3) Because the lead time of the “most recent observation” differs by stay date, it is noted alongside each figure in the text and tables. (4) As no price metrics are covered, no adjustment for rate level has been made.
■ Limitations and caveats
(1) Estimated OCC is an estimate based on how far listed inventory has been absorbed, and its definition differs from actual room occupancy (it reads higher, because rooms not listed are counted on the absorbed side). It should be used for point-to-point comparison within the same segment and for comparing curve shapes between segments, rather than for the level itself. (2) The resort base is small at 11 properties, where a single property’s movement amounts to 9.1pt, so single-day and single-month values need to be read with a margin. (3) The number of observed properties can fall as the stay date approaches, so values at the most recent point may be relatively unstable. (4) This article is a snapshot at the time of retrieval and does not reflect subsequent changes in selling conditions. (5) The content organises points of focus that can be read from market data and does not guarantee the effect of any particular measure.
- National Holidays for 2026 and 2027 | Cabinet Office, Government of Japan (confirming Respect for the Aged Day on September 21, the holiday on September 22 under Article 3(3) of the Holiday Act, the Autumnal Equinox on September 23, and Sports Day on October 12)
- When is Silver Week 2026? The five-day run from September 19 to 23 | Shukujitsu Calendar
- September 2026 holiday and long-weekend calendar (Silver Week) | Best Calendar
Frequently Asked Questions
Q. Does a segment with low estimated OCC at 45 days out mean sales are going badly?
A. Not necessarily. On Saturday, September 19, 2026, resort hotels were at an estimated OCC of 68.1% at 45 days out, 29.7pt below business hotels (97.8%), yet at the most recent observation (9 days before the stay date) they landed at 98.5%, above business hotels (96.7%). The level at 45 days out is a starting value reflecting how demand enters each segment, not a measure of good or bad. What should be compared is the market level within the same segment.
Q. What is the difference between estimated OCC and the sell-out rate?
A. Estimated OCC shows how much of the room inventory across the whole cohort has been absorbed, while the sell-out rate shows the share of properties in scope for which no listed inventory can be confirmed. The two carry different information. For resort hotels on September 22, 2026, estimated OCC moved +28.0pt from 62.7% at 45 days out to 90.7% at the most recent observation, while the sell-out rate barely moved from 18.2% throughout the observation window. That means properties continuing to hold inventory remain even as the market as a whole absorbs it.
Q. Why are only observations within a 45-day lead time used?
A. Points beyond 45 days can include observations made before a property has finished loading its selling allotment, so a large number of remaining rooms does not necessarily mean the date is “not selling.” To keep the scope to what can be read as booking progress, every curve, table and exhibit in this article is built solely from observations within a 45-day lead time.
Q. Which figures should I compare my own booking pace against?
A. Compare against the same segment and a stay date of the same character. For the Saturday that opens a holiday run, the market level at 45 days out is roughly 97.8% for business hotels, 87.3% for ryokan and 68.1% for resorts, and at 30 days out 99.5%, 94.5% and 76.8% respectively (observed as of September 11, 2026). Comparing levels across segments leads to misreading, because demand enters each segment differently.
Q. Why should the resort hotel figures be read with a margin?
A. Because the base is small at 11 properties and 474 rooms, a single property moves the sell-out rate by the equivalent of 9.1pt. Single-day and single-month swings can arise from one property’s inventory handling alone, so it is more appropriate to look at the direction between points in time than at the level itself.