

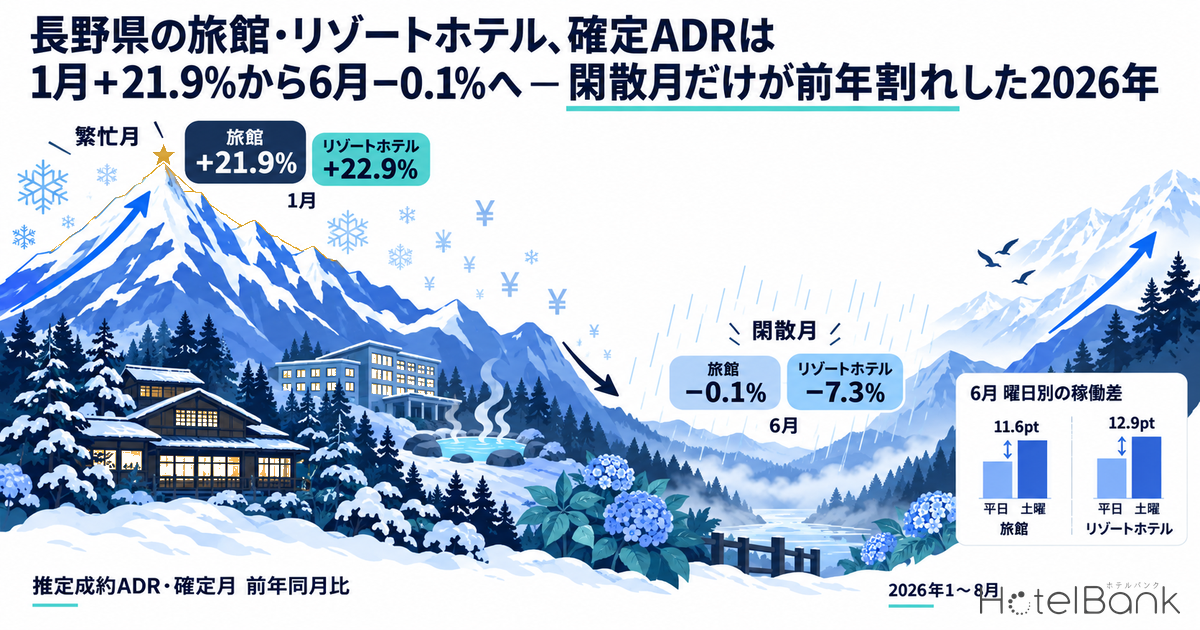
In Nagano Prefecture’s accommodation market, estimated settled ADR through 2026 has traced an extreme shape: strong in winter, stalling in early summer. Line up the finalized months of January through August 2026 against the same months a year earlier and ryokan opened the year at +21.9% while resort hotels opened at +22.9% — double-digit growth for both — yet by June ryokan had slipped to -0.1% (¥11,556, N=501 properties) and resort hotels to -7.3% (¥13,558, N=112 properties), both below the prior year. July also came in below the prior year for both formats (ryokan -2.8% / resort hotels -2.5%), before a recovery in August to ryokan +1.1% and resort hotels +5.0%. In other words, 2026 in Nagano was not “a year when rates rose” but a year when only the peak months rose while shoulder-month pricing was left behind by the prior year. This article works through the finalized-month YoY figures, the occupancy structure behind June, and how to rebuild pricing ahead of the next low season.
Scope: ryokan and resort hotels in Nagano Prefecture (format classification follows our own category definitions). N for finalized months of estimated settled ADR = 485-551 ryokan / 111-137 resort hotels. The price metric used here is estimated settled ADR (the transacted price level estimated from OTA and other sales data, tax-exclusive equivalent); occupancy is an estimate based on OTA-listed inventory. Definitions for both appear at the end of this article. Data as of September 10, 2026.
- — Finalized estimated settled ADR for Nagano ryokan moved from +21.9% in January to -0.1% in June; resort hotels moved from +22.9% to -7.3%. Only the peak months saw rates rise.
- — Across the January-August total, ryokan were +6.7% and resort hotels +5.4% — positive. Half-year totals conceal the stall in the trough months.
- — June estimated OCC for ryokan was 75.7% Mon-Thu against 87.3% on Saturday (a gap of 11.6pt). That is more than double August’s 4.8pt gap: the weaker the month, the sharper the two-tier day-of-week structure.
- — Pickup from T-45 to T-27 was +5.9pt on weekdays and +5.8pt on weekends — virtually identical. Weekday softness cannot be recovered through last-minute discounting; it is settled by where the curve starts at T-45.
- — Across seven ryokan-market prefectures, double-digit winter growth followed by a June decline is not unique to Nagano but a shared regional pattern. That said, Nagano’s June figure of -0.1% was the shallowest decline of the seven.
Finalized Months, Year on Year — Double-Digit Growth to Start, Below Prior Year by June
First, some ground rules. The two formats covered here are ryokan and resort hotels as defined in our own category taxonomy. Nagano has a deep ryokan base (N=485-551 properties in finalized months); resort hotels are fewer in number (N=111-137) but larger in room count, and they carry the prefecture’s high-rate demand.
The table below shows year-on-year comparisons using finalized values only (historical-observation basis). Current and future months sit on a different basis and are excluded from this table entirely.
| Stay month | Ryokan 2026 est. settled ADR |
Ryokan 2025 | YoY | Resort 2026 est. settled ADR |
Resort 2025 | YoY |
|---|---|---|---|---|---|---|
| January | ¥15,361 N=493 | ¥12,600 N=551 | +21.9% | ¥20,938 N=132 | ¥17,036 N=133 | +22.9% |
| February | ¥13,290 N=506 | ¥12,181 N=538 | +9.1% | ¥16,892 N=133 | ¥15,352 N=132 | +10.0% |
| March | ¥13,098 N=518 | ¥11,472 N=548 | +14.2% | ¥15,256 N=137 | ¥13,590 N=135 | +12.3% |
| April | ¥12,945 N=523 | ¥12,125 N=531 | +6.8% | ¥14,756 N=125 | ¥14,314 N=120 | +3.1% |
| May | ¥13,184 N=526 | ¥12,686 N=549 | +3.9% | ¥16,588 N=124 | ¥16,809 N=123 | -1.3% |
| June | ¥11,556 N=501 | ¥11,564 N=514 | -0.1% | ¥13,558 N=112 | ¥14,632 N=112 | -7.3% |
| July | ¥12,105 N=517 | ¥12,455 N=519 | -2.8% | ¥15,772 N=119 | ¥16,171 N=115 | -2.5% |
| August | ¥14,521 N=515 | ¥14,363 N=511 | +1.1% | ¥21,662 N=124 | ¥20,636 N=117 | +5.0% |
Source: MetroEngines Research; compiled by the HotelBank Editorial Team (estimated settled ADR, finalized months = historical basis, tax-exclusive equivalent)
Taken as an eight-month total, ryokan were +6.7% and resort hotels +5.4% against the same period last year — genuinely positive for the first half of the year. But the monthly breakdown is anything but uniform. Double-digit growth in January-March accounts for almost all of the annual gain; from April the growth rate steps down month by month; resort hotels turn negative first in May; and in June both formats sink into the trough. Nagano is a market where winter demand readily pushes rates up, and in 2026 that winter momentum did not carry through to early summer.
Source: MetroEngines Research; compiled by the HotelBank Editorial Team
Overlaying the two years reveals two things. First, the 2026 line runs clearly above 2025 from January through April, but touches or falls below the 2025 line from May through July. Second, the trough itself is deeper than it was a year earlier. Measured as the ratio of the highest to the lowest month across January-August, ryokan widened from 1.25x in 2025 (¥11,472-¥14,363) to 1.33x in 2026 (¥11,556-¥15,361), and resort hotels from 1.52x (¥13,590-¥20,636) to 1.60x (¥13,558-¥21,662). (Because 2026 has finalized values only through August, the prior year is aligned to the same January-August window.) The ceiling in peak months was successfully raised; the floor in shoulder months was held flat, or cut.
Is This Unique to Nagano? A Seven-Prefecture Ryokan Comparison
To test whether this shape is specific to Nagano, we lined up six neighbouring and structurally similar prefectures with deep ryokan bases on the same basis (estimated settled ADR, finalized months, year-on-year). The conclusion up front: “double-digit growth in winter, below prior year in June” is not a Nagano phenomenon but the shared 2026 shape of the ryokan market. All seven prefectures posted double-digit growth in January, and all seven fell below the prior year in June.
| Prefecture | Jan YoY | Jun est. settled ADR | Jun N | Jun YoY | Jan-Aug total YoY |
|---|---|---|---|---|---|
| Nagano | +21.9% | ¥11,556 | N=501 | -0.1% | +6.7% |
| Tochigi | +21.8% | ¥14,105 | N=209 | -2.3% | +4.6% |
| Shizuoka | +17.6% | ¥15,409 | N=449 | -3.6% | +3.5% |
| Gunma | +14.1% | ¥13,539 | N=285 | -3.9% | +2.8% |
| Gifu | +21.9% | ¥12,803 | N=235 | -4.7% | +2.7% |
| Niigata | +13.1% | ¥11,567 | N=243 | -1.7% | +0.7% |
| Yamanashi | +19.3% | ¥10,683 | N=169 | -11.0% | -1.9% |
Source: MetroEngines Research; compiled by the HotelBank Editorial Team (estimated settled ADR, finalized months = historical basis, tax-exclusive equivalent. Jan-Aug total YoY is the ratio of the simple sums of each month’s finalized values)
That said, the depth of the decline differs markedly. June’s shortfall was deepest in Yamanashi at -11.0%, followed by Gifu at -4.7%, Gunma at -3.9% and Shizuoka at -3.6%. Nagano’s -0.1% was the shallowest of the seven, and its Jan-Aug total of +6.7% was the largest. Nagano, then, was not “a market that lost in the trough” but the market that held its footing best through a decline that hit the whole region. And since even here the gap between peak and trough months widened versus the prior year, the amplitude increase is likely to be larger still in the prefectures that fell further.
This comparison also gives you a baseline for judging your own property’s June. If your June came in at -5% year on year, that can be read as “substantially behind the Nagano market average (-0.1%)” or as “mid-pack within the ryokan market’s overall range (-0.1% to -11.0%)”. The choice of yardstick changes the response, so it is worth holding both the prefectural and the regional benchmark. For a closer look at how the split runs across formats, our analysis of the same June inflection in Kanagawa, broken out by city and business hotels can be read on the same basis.
What Was Happening in June — Occupancy Was Standing on Saturdays Alone
To understand why shoulder-month ADR failed to reach the prior year, look outside price. The metric from here is estimated OCC (based on OTA-listed inventory), a separate axis from the price metric. Prefecture-wide estimated OCC for June 2026 was 77.8% for ryokan (179-257 properties / 4,439-6,174 rooms, on a major-booking-site listing basis) and 79.3% for resort hotels (42-57 properties / 3,080-3,971 rooms). On level alone, that is hardly weak. Note that estimated OCC here is an estimate based on OTA-listed inventory and is defined differently from the room occupancy rate reported in Japan’s Accommodation Travel Statistics Survey.
Break it down by day of week, however, and it becomes clear what that average rests on. In June, ryokan averaged 75.7% Monday through Thursday against 87.3% on Saturday — a gap of 11.6pt. Resort hotels ran 75.8% Mon-Thu against 88.7% on Saturday, a gap of 12.9pt, wider still. The softest stay date in the prefecture was Tuesday, June 2, at 66.8% for ryokan and 65.4% for resort hotels.
August of the same year, by contrast, averaged 90.1% for ryokan (89.1% Mon-Thu / 93.9% Saturday = a 4.8pt gap) and 93.3% for resort hotels (92.6% / 94.9% = a 2.2pt gap). In August inventory was tight regardless of the day of week, leaving room to push rates up. In June, only the weekend wore the face of high season; weekdays were a different market altogether. Run a single monthly rate across that two-tier structure and you discount weekdays to fill them while leaving money on the table on Saturdays that would have sold anyway — and the month’s settled rate cannot beat the prior year.
Source: MetroEngines Research; compiled by the HotelBank Editorial Team (estimated OCC, OTA-listed inventory basis)
Day-of-week differences in price are deliberately left out here. Estimated settled ADR is canonically a monthly aggregate and is not a metric that can express price levels at daily or day-of-week granularity. Day-of-week reading is confined to the occupancy axis.
Does Weekday Softness Fill In Late? The Recent Booking Curve
The assumption that “if weekdays are soft, they will fill closer in” can be tested against actual pickup. We compared the most recent observable booking curves for Nagano (from 45 days before the stay date to the present) for a representative weekday, Tuesday, October 6, 2026, and a representative weekend, Saturday, October 10. Our observation of holiday-period curves in Gifu over the five-day September break, using the same ryokan and resort mix, is a useful companion for placing your own property.
For ryokan, the October 6 (Tuesday) stay date sat at an estimated OCC of 68.1% at T-45 and built to 74.0% by T-27, a gain of +5.9pt. October 10 (Saturday) started at 83.9% at T-45 and reached 89.7% at T-31, a gain of +5.8pt. Resort hotels behave the same way: Tuesday moved 71.0% to 76.1% (+5.1pt), Saturday 76.8% to 82.5% (+5.7pt). The amount of pickup is near-identical, so the difference in starting position simply persists. Weekdays do not “surge late”; they carry the gap that was already open at T-45 (15.8pt for ryokan, 5.8pt for resort hotels) all the way to the stay date.
Source: MetroEngines Research; compiled by the HotelBank Editorial Team (estimated OCC, OTA-listed inventory basis)
This shape carries a clear implication for shoulder-season pricing. Weekday softness is not the kind of problem last-minute discounting recovers; the outcome is largely settled by how the curve starts at T-45. Put the other way, whether your property’s estimated OCC at T-45 sits below the market level is a decision input you can act on far earlier than a rate cut. For how to separate the levers by lead time, the back-calculation framework of deciding at T-45, adjusting at T-30 and letting go at T-14 is a useful reference.
Where Current and Future Months Sit — Read Separately as Current-Basis Estimates
Everything so far has used finalized values only. For reference, here is estimated settled ADR for the current month onward. These sit on a different basis: estimates derived from current sales conditions, and they cannot simply be differenced against the prior year’s finalized values to produce a year-on-year figure. What follows is there to confirm “where the market sits given how it is selling now”; comparison with finalized values has to wait for month-end finalization.
| Stay month | Ryokan (current-basis estimate) | Resort hotels (current-basis estimate) |
|---|---|---|
| September 2026 | ¥13,970 (N=506) | ¥18,670 (N=122) |
| October 2026 | ¥14,715 (N=478) | ¥18,980 (N=122) |
| November 2026 | ¥14,530 (N=446) | ¥18,358 (N=114) |
| December 2026 | ¥15,265 (N=355) | ¥21,742 (N=102) |
Source: MetroEngines Research; compiled by the HotelBank Editorial Team (current and future months = estimates based on current sales conditions; subject to change)
Heading from autumn into winter, both formats are selling well above the finalized June level (ryokan ¥11,556 / resort hotels ¥13,558), and December for resort hotels is in the ¥21,742 band, level with finalized August (¥21,662). These figures will move with sales conditions, but at a minimum they confirm that Nagano’s structure — selling high in winter and midsummer — is intact as things stand. The problem, once again, is the other side of that structure: pricing in the trough months.
For Revenue Managers at Nagano Ryokan and Resort Hotels — Implications and Action Plan
1. The year’s result was decided by trough-month pricing, not peak height. Nagano in 2026 posted strong finalized YoY figures from January to March — ryokan +21.9% to +9.1%, resort hotels +22.9% to +10.0% — then fell to ryokan -0.1% and resort hotels -7.3% in June. Peak-month increases went through across the market. The differentiation happened in the shoulder months, which suggests the room to lift your annual RevPAR sits in trough months like June rather than in an already-strong January or August.
2. In shoulder months, run “the weekday market” and “the Saturday market” separately. June estimated OCC was 75.7% Mon-Thu / 87.3% Saturday for ryokan (a gap of 11.6pt) and 75.8% / 88.7% for resort hotels (12.9pt). Against August’s gaps (4.8pt for ryokan, 2.2pt for resort hotels), the two-tier day-of-week structure is sharper the weaker the month. Lay a single monthly rate across it and you lose Saturday upside and over-discount weekdays at the same time. Re-cut your own June results by day of week and confirm whether Saturdays were filling first — because those are nights that would have sold without a discount.
3. Weekday softness cannot be recovered close in. On the recent curves, pickup from T-45 to T-27 was +5.9pt for ryokan and +5.1pt for resort hotels on the representative weekday, against +5.8pt and +5.7pt on the representative weekend. If the gains are essentially the same, the T-45 gap does not close. For shoulder-season weekdays, there is a case for shifting away from “discount late to fill” toward seeding different demand — multi-night stays, weekday-only reasons to stay — before the T-45 mark.
4. The trough is deeper than a year ago. The highest-to-lowest month ratio across January-August moved from 1.25x to 1.33x for ryokan and from 1.52x to 1.60x for resort hotels. Widening amplitude can also be read as a sign that the seasonal rate grid has not kept pace with the market. Revisiting the floor in trough months alone may lift the annual average without touching the peaks.
Translated into actual work, that comes down to three horizons.
| Time horizon | Action | Decision trigger (figures from this article) | Purpose |
|---|---|---|---|
| Today to this week | Break your own June 2026 results down by day of week, tallying Saturday and Mon-Thu separately | Market June estimated OCC was 77.8% for ryokan and 79.3% for resort hotels. If your Saturdays filled in line with the market (87.3% ryokan / 88.7% resort hotels), those dates are candidates for “no discount was needed” | Identify shoulder-month nights that did not need discounting |
| Today to this week | Place your finalized June ADR alongside the market level | Finalized June for the market was ¥11,556 for ryokan (N=501) and ¥13,558 for resort hotels (N=112). If your property is below that band and down year on year, pricing is a redesign candidate | Put an objective number on the trough-month floor |
| Within two weeks | Switch autumn and winter inventory to weekly monitoring of pickup as of T-45 | The market’s representative weekday sat at 68.1% (ryokan) / 71.0% (resort hotels) at T-45, and the representative weekend at 83.9% / 76.8%. Dates where your T-45 position falls well below that band are candidates for early intervention | Buy time for levers that do not depend on last-minute discounting |
| Within two weeks | Review the “trough tier” of the seasonal rate grid on its own, decoupled from the peak tier | The highest-to-lowest month ratio widened from 1.25x to 1.33x for ryokan and 1.52x to 1.60x for resort hotels. If your own amplitude has widened similarly, there is room to revisit the trough side alone | Lift the annual average without touching the peaks |
| Looking to next month | Plan shoulder-season weekday reasons to stay (multi-night stays, weekday-only itineraries) on the assumption they go live before T-45 | Pickup from T-45 to T-27 was limited to +5.9pt on weekdays (ryokan) and +5.1pt (resort hotels), essentially the same as weekends. Late-stage upside is limited | Rebuild how weekdays start filling |
| Looking to next month | Build winter pricing from the finalized January band as the starting point | Finalized January was ¥15,361 for ryokan (+21.9% YoY) and ¥20,938 for resort hotels (+22.9%). The market is accepting winter increases. If your property held rates flat, that is worth revisiting | Capture the full peak-month opportunity |
Source: MetroEngines Research; compiled by the HotelBank Editorial Team
* The above are considerations that can be read from market aggregates and are not a guarantee of results. Applicability varies with each property’s product mix, guest base and distribution channels.
Conclusion — Three Yardsticks for Measuring Nagano’s Shoulder Months
In 2026, Nagano’s ryokan and resort hotels grew finalized winter ADR by double digits and then fell below the prior year in June and July. That asymmetry resolves into three yardsticks you can use when rebuilding pricing for the next low season.
Yardstick 1: read trough-month YoY on its own. Annual and half-year totals (ryokan +6.7%, resort hotels +5.4%) are pulled up by the peak months and hide the stall in the trough. The fact that finalized June was -0.1% for ryokan and -7.3% for resort hotels only becomes visible when the month is cut out on its own.
Yardstick 2: evaluate shoulder months split by day of week. June’s day-of-week gap was 11.6pt for ryokan and 12.9pt for resort hotels, more than double August’s (4.8pt / 2.2pt). Average occupancy in a shoulder month is merely the consequence of a strong Saturday; the monthly average alone cannot detect weekday softness.
Yardstick 3: treat the T-45 position as the decisive point. For both weekdays and weekends, pickup from T-45 to T-27 runs at roughly +5 to +6pt, so the initial gap does not close. Shoulder-season levers fit the structure better when weighted toward preparation ahead of that point rather than price moves close in.
Price a shoulder month with the same reflexes you use for a peak month and you discount weekdays too far while leaving Saturdays on the table. Nagano’s data for the first half of 2026 shows, in finalized values, how much that double loss takes out of the year’s growth.
Methodology and Sources
- Definition of estimated OCC (OTA-listed inventory basis): OTA-listed inventory occupancy = 100 – 100 x rooms remaining on OTA listings / total rooms. The sample is a fixed cohort of properties listing at least 30% of their total rooms on OTAs (the same property set for every stay date). It is an estimate based on how listed inventory is selling and is defined differently from actual room occupancy (it runs high because rooms not listed are counted as sold). The months covered here are June 2026 and August 2026, plus the stay dates of October 6 and October 10, 2026.
- Booking curve: based on observations from 45 days before the stay date through the present. The sample is 286 ryokan / 6,699 rooms in Nagano (October 6 stay) and 283 properties / 6,607 rooms (October 10 stay), plus 64 resort hotels / 4,251 rooms (October 6) and 63 properties / 4,241 rooms (October 10), all on a major-booking-site listing basis.
- Definition of estimated settled ADR: a transacted price level (tax-exclusive equivalent) estimated from OTA and other sales data (lowest-plan level x format-specific coefficient, ensembled across multiple channels). Past months are finalized values; current and future months are estimates based on current sales conditions. Cross-checked against published operating results, the median error is 6.6%. Year-on-year figures are calculated between finalized months only; estimates for current and future months are not used in any YoY calculation.
- Sample sizes: for estimated settled ADR, finalized months cover N=485-551 ryokan (January 2025 to August 2026) and N=111-137 resort hotels. Current and future months (September-December 2026) cover N=355-506 ryokan and N=102-122 resort hotels. For estimated OCC, June 2026 covers 179-257 ryokan / 4,439-6,174 rooms and 42-57 resort hotels / 3,080-3,971 rooms; August 2026 covers 186-257 ryokan / 4,563-6,050 rooms and 52-59 resort hotels / 3,632-4,090 rooms. Format classification follows our own category definitions of “ryokan” and “resort hotel”.
- Data as of: September 10, 2026. Sales conditions and inventory move daily, so the figures here are a snapshot at the time of retrieval.
■ Data Sources
Estimated settled ADR, estimated OCC and booking curves are all aggregated from listed prices and inventory data collected by MetroEngines Research from major booking sites. Coverage spans ryokan and resort hotels in Nagano Prefecture and six comparison prefectures (Tochigi, Gunma, Niigata, Yamanashi, Gifu and Shizuoka), aggregated monthly for stay dates from January 2025 through December 2026. Finalized months use a historical basis (observed results for past months); current and future months are estimates based on current sales conditions. Data retrieved as of September 10, 2026.
■ Calculation Assumptions
Year-on-year figures are calculated between finalized months only; estimates for current and future months, which sit on a different basis, are excluded from any YoY calculation (Table 3). The January-August total YoY is the ratio of the simple sums of each month’s finalized estimated settled ADR, with no weighting by property count, occupancy or room scale. The highest-to-lowest month ratio is calculated over the same January-August window for both years, since 2026 has eight finalized months. For day-of-week estimated OCC, Monday to Thursday is treated as the weekday representative and Saturday as the weekend representative. The action plan in Table 4 sets out considerations that can be read from market aggregates and is not a guarantee of results.
■ Limitations and Caveats
Estimated settled ADR carries a median error of 6.6% when cross-checked against published operating results, so the monthly levels here are estimates with a comparable margin. Note that in months where the year-on-year change is within a few percentage points (ryokan June at -0.1%, for instance), the sign can flip within that estimation error. Estimated OCC reflects how OTA-listed inventory is selling, so it counts unlisted rooms as sold and runs above actual room occupancy. The property count N varies month to month (485-551 for ryokan), and turnover in the sample has a small effect on month-to-month comparison. This article also aggregates at the prefectural level, and within the same prefecture the shape of seasonal variation differs substantially by location (highland resort, hot-spring district, urban centre).
■ Reference Materials
MetroEngines Research estimated settled ADR aggregation (Nagano and six other prefectures / ryokan and resort hotels / January 2025 to December 2026); MetroEngines Research OTA-listed-inventory estimated occupancy aggregation (June and August 2026); MetroEngines Research booking curve observations (stay dates of October 6 and October 10, 2026). All retrieved by the HotelBank Editorial Team as of September 10, 2026.