

The Accommodation Travel Statistics Survey (宿泊旅行統計調査) is the only nationwide monthly statistic on lodging demand in Japan, published by the Japan Tourism Agency (JTA). Its monthly series for total guest nights and room occupancy is referenced everywhere from hotel budgeting to bank credit decisions — yet the question of which population the figures are drawn from, at what response rate, and through how many revision cycles is rarely pushed on. This article first confirms the definitions against primary sources — the survey outline and the JTA glossary — then lines up seven months of first and second preliminary figures to show, with measured values, how far a preliminary number can be trusted.
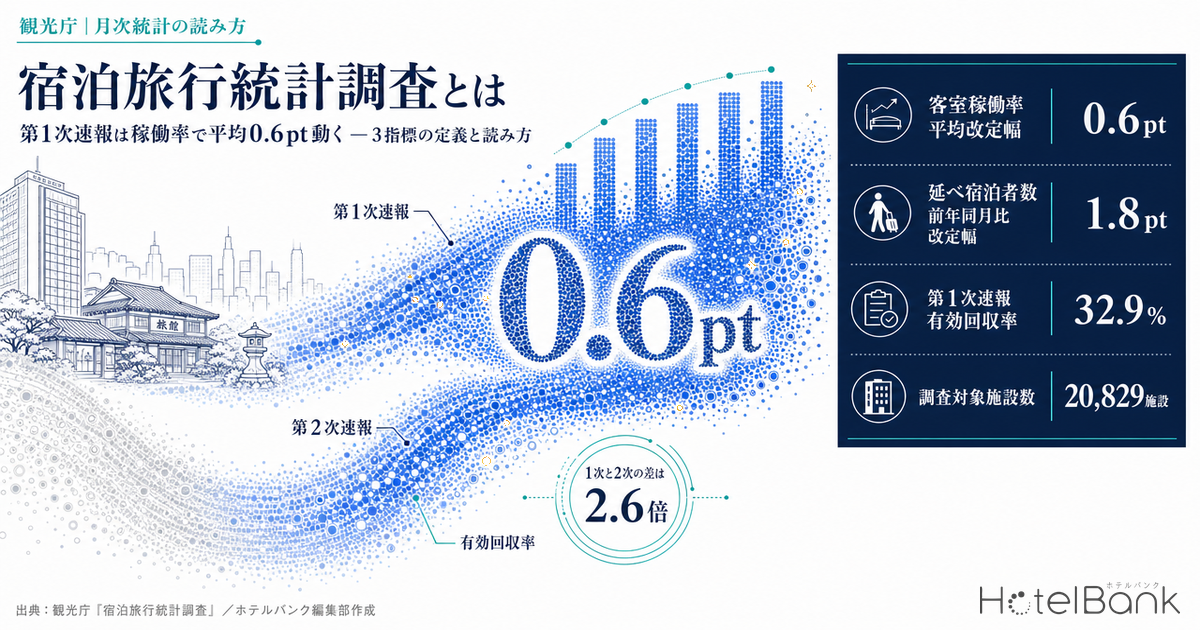
- — The valid response rate for the first preliminary figures is 32.9% (July 2026 data). Properties with 20 or more rooms return 40.1%, those with fewer than 20 rooms 20.4% — a gap of nearly two times by property size.
- — Room occupancy is revised by 0.6pt on average, while the year-on-year change in total guest nights moves by 1.8pt on average and 2.9pt at the maximum (December 2025 through June 2026 data, N=7 months).
- — The gap by property type is 2.6x: 0.46pt for business hotels against 1.20pt for ryokan. Because responses from small properties accumulate by the time of the second preliminary release, preliminary figures move more for ryokan and simple lodgings.
- — Even annual figures flip sign. The 2025 year-on-year change in total guest nights was revised from −0.8% in the preliminary figures to +0.3% in the final figures.
- — Our own estimated occupancy runs 17 to 32pt higher than the JTA room occupancy rate (June 2026, six prefectures). The population and the denominator differ, so the two are used side by side rather than one replacing the other.
Metric Definitions Used in This Article
- Total guest nights: the cumulative number of guests staying in a given month (persons using the facility with bedding, including children and infants), per the JTA glossary.
- Room occupancy rate (JTA): rooms used divided by total rooms, where total rooms is the number of rooms multiplied by the number of days in the month (same source).
- Guest-capacity occupancy rate (JTA): total guest nights divided by total capacity, where total capacity is the guest capacity multiplied by the number of days in the month (same source).
- OCC (occupancy, MetroEngines estimate): the share of rooms sold against total rooms in an area, estimated from OTA-listed sales inventory. The population and the denominator differ from the JTA room occupancy rate, so the levels cannot be compared directly.
- Data sources: Japan Tourism Agency “Accommodation Travel Statistics Survey” press releases, e-Stat, MetroEngines Research
What the Survey Measures — 20,829 Properties Surveyed Out of 75,665 Nationwide
The purpose of the Accommodation Travel Statistics Survey is set out in its survey outline as “to grasp the actual state of overnight travel in Japan on a nationwide scale.” It covers hotels, ryokan, simple lodgings, and company or organization lodgings licensed under the Inns and Hotels Act; as of July 2026, 75,665 lodging establishments are recorded nationwide. Not all of them, however, are asked to report every month.
This is the first fork in the road. From the January 2026 survey month onward, the JTA changed the stratification criterion of its sample design from “number of employees” to “number of rooms.” Through December 2025, establishments with 10 or more employees were subject to complete enumeration, while those with 5 to 9 employees were sampled at one third and those with 0 to 4 employees at one ninth. From January 2026, establishments with 20 or more rooms are subject to complete enumeration, and those with 1 to 19 rooms form a sample survey with sampling rates set by prefecture. The JTA itself states at the top of its press releases that “with respect to year-on-year (same-month) changes and differences, note that the effect of the revision may be included,” so this discontinuity has to be factored in when reading 2026 year-on-year figures.
| Item | Through December 2025 | From January 2026 |
|---|---|---|
| Stratification criterion | Number of employees | Number of rooms |
| Scope of complete enumeration | 10 or more employees | 20 or more rooms |
| Scope of sample survey | 1/3 random sample for 5–9 employees, 1/9 for 0–4 employees | 1–19 rooms (sampling rate set by prefecture) |
| Series for continuous comparison | Establishments with 10 or more employees | Establishments with 20 or more rooms |
| Reporting deadline | Monthly reports due by the middle of the following month (self-completed, by mail or online) | |
| Publication cycle | First preliminary (end of the following month) → second preliminary (end of the second following month) → annual and final figures (the following year) | |
Source: JTA “Accommodation Travel Statistics Survey — Survey Outline,” compiled by the HotelBank Editorial Team
The reporting entity is the lodging property itself. Each month, hotel and ryokan staff enter and submit their own figures for total guest nights, foreign guest nights, rooms used and so on, under a self-completion format with a deadline in the middle of the following month. This “write it yourself and send it in” design is the root cause of the gap between preliminary and final figures discussed below.
The First Preliminary Response Rate Is 32.9% — Smaller Properties Arrive Late
The first preliminary figures for July 2026 are estimated from valid questionnaires collected by August 12, 2026 out of the 20,829 establishments surveyed. The valid response rate was 32.9%. Broken down, properties with 20 or more rooms returned 40.1% and those with fewer than 20 rooms 20.4% — a gap of nearly two times by size.
The second preliminary figures, published a month later, carry a higher response rate because the deadline is extended. The valid response rate for the June 2026 second preliminary figures was 44.6%, with 52.1% for properties of 20 or more rooms and 31.6% for those under 20 rooms. At the first preliminary stage for the same June data, the rate was 36.1%, so 8.5 points accumulated in a single month. What matters is that this increment arrives mainly from small properties.
Source: JTA “Accommodation Travel Statistics Survey (July 2026 first preliminary; June 2026 second preliminary),” compiled by the HotelBank Editorial Team
In other words, the first preliminary figures estimate the state of roughly 75,000 establishments nationwide from about 6,900 responses skewed toward larger properties. Even granting that the sample design restores the population correctly, it is hard to expect an estimate made while small-property responses are thin to match exactly the estimate made once they have filled in. The next section measures that difference.
The Three Headline Metrics — The Denominator Is “Rooms × Days in the Month”
The JTA glossary defines the headline metrics as follows. The wording is presented as written, without reordering.
Total guest nights
“Refers to the cumulative number of guests (persons using the facility with bedding, including children and infants) in each month.”
Room occupancy rate
“Refers to the number of rooms used divided by the total number of rooms, where the total number of rooms is calculated by multiplying the number of rooms by the number of days in each month.”
Guest-capacity occupancy rate
“Refers to total guest nights divided by total capacity, where total capacity is calculated by multiplying the guest capacity by the number of days in each month.”
Source: JTA “Accommodation Travel Statistics Survey — Glossary (excerpted from the annual report)”
The point most often misread in practice is the denominator of the room occupancy rate. That denominator is “rooms × days in the month,” not days of operation. Room inventory continues to count toward the denominator even on days the property is closed, so in regions with many seasonal properties or properties that open only for holiday periods, this definition structurally pushes occupancy down. Likewise, if floors are closed for renovation, the room count the property has registered still goes into the denominator in full. A low occupancy rate does not necessarily mean rooms are not selling — it can mean the denominator contains inventory that was never on the market.
The other metric, the guest-capacity occupancy rate, has people rather than rooms in the numerator. Because total guest nights are divided by “capacity × days,” the value comes out lower the larger the capacity per room. If two guests stay in a Japanese-style room that sleeps four, room occupancy is 100% but guest-capacity occupancy is only 50%. This is why the guest-capacity occupancy rate of ryokan looks structurally low, and it does not mean the business is underperforming.
The relationship can be confirmed numerically. The public data that provides both guest-capacity and room occupancy by property type is the e-Stat final figures, but as discussed below, coverage ends with 2016. Even so, the structure of capacity per room barely changes by property type, so the ratios remain useful for reading the pattern.
| Property type | Guest-capacity occupancy | Room occupancy | Capacity ÷ room |
|---|---|---|---|
| City hotels | 66.8% | 78.7% | 0.85 |
| Business hotels | 62.9% | 74.4% | 0.85 |
| Resort hotels | 42.2% | 56.9% | 0.74 |
| Company / organization lodgings | 18.1% | 27.1% | 0.67 |
| Ryokan | 24.1% | 37.1% | 0.65 |
| Simple lodgings | 14.6% | 25.0% | 0.58 |
Source: e-Stat “Accommodation Travel Statistics Survey (annual final figures),” Tables 6 and 8 (2016, nationwide), compiled by the HotelBank Editorial Team
Source: e-Stat “Accommodation Travel Statistics Survey (annual final figures)” (2016, nationwide), compiled by the HotelBank Editorial Team
City and business hotels reach 0.85 times room occupancy on the guest-capacity measure, while ryokan stop at 0.65 and simple lodgings at 0.58. Hotels are built around singles and twins, capacity per room is small, and a filled room is used close to its capacity. Conversely, at ryokan built around Japanese-style rooms and at simple lodgings designed for multi-person stays, leaving capacity unused in an occupied room is the norm. In practice, the split is this: use the room occupancy rate to compare different property types side by side, and use the guest-capacity occupancy rate to see how deeply a single property is filling the room mix it actually has.
How Far Preliminary Figures Move — 0.6pt on Room Occupancy, 1.8pt on Year-on-Year
This is the core of the article. For the same month and the same metric, we lined up the value first published as the first preliminary figure against the value revised a month later as the second preliminary figure, across the seven months from December 2025 data through June 2026 data. All values are transcribed exactly as printed in the JTA press releases.
| Month | Total guest nights (millions) | Year-on-year change | Room occupancy rate | ||||||
|---|---|---|---|---|---|---|---|---|---|
| 1st | 2nd | Revision | 1st | 2nd | Revision | 1st | 2nd | Revision | |
| December 2025 | 53.42 | 53.59 | +0.3% | -4.5% | -4.2% | +0.3pt | 59.1 | 59.7 | +0.6pt |
| January 2026 | 46.28 | 45.46 | -1.8% | -5.3% | -7.0% | -1.7pt | 53.1 | 52.7 | -0.4pt |
| February 2026 | 46.25 | 47.65 | +3.0% | -3.5% | -0.6% | +2.9pt | 59.0 | 59.6 | +0.6pt |
| March 2026 | 55.46 | 54.41 | -1.9% | -0.1% | -2.0% | -1.9pt | 60.3 | 59.4 | -0.9pt |
| April 2026 | 50.63 | 49.11 | -3.0% | -4.6% | -7.2% | -2.6pt | 59.7 | 59.1 | -0.6pt |
| May 2026 | 53.39 | 54.29 | +1.7% | -4.8% | -3.2% | +1.6pt | 60.6 | 61.0 | +0.4pt |
| June 2026 | 46.78 | 45.82 | -2.1% | -6.5% | -8.4% | -1.9pt | 56.2 | 57.2 | +1.0pt |
| Average revision (absolute) | — | 2.0% | — | 1.8pt | — | 0.6pt | |||
Source: JTA “Accommodation Travel Statistics Survey” monthly press releases (published January 30 to August 31, 2026; N=7 months), compiled by the HotelBank Editorial Team
Three things stand out. First, the level of total guest nights moves by 2.0% on average. Second, the year-on-year change moves by 1.8pt on average and by as much as 2.9pt. Third, the room occupancy rate is relatively stable at 0.6pt on average, with a maximum of 1.0pt.
The second point carries the greatest practical weight. February 2026 was reported at −3.5% year on year in the first preliminary figures, then revised to −0.6% in the second. “A decline of more than 3%” and “roughly flat” land very differently. Conversely, March 2026 came in at −0.1% in the first preliminary figures — essentially level with the prior year — and became −2.0% in the second. Building an argument on a first-preliminary year-on-year figure quoted to one decimal place carries no weight against revisions of this size. As a rule of thumb, treat the first-preliminary year-on-year change as an estimate carrying a band of roughly ±2pt, and watch carefully whether the direction of travel — up or down — survives the revision.
Source: JTA “Accommodation Travel Statistics Survey” monthly press releases (N=7 months), compiled by the HotelBank Editorial Team
Revisions Differ 2.6x by Property Type
Breaking the revision in room occupancy down by property type reproduces exactly the response-rate structure seen in the previous section. For the same seven months, we calculated the average revision (absolute value) for each property type.
Figures are seven-month average revisions (absolute values). Single-month swings are larger still; the largest observed was 3.1pt for simple lodgings in June 2026 data. Source: JTA “Accommodation Travel Statistics Survey” monthly press releases (December 2025 data through June 2026 data; N=7 months), compiled by the HotelBank Editorial Team
The most stable are business hotels at 0.46pt, followed by city hotels at 0.57pt. Around the overall 0.64pt come resort hotels at 1.10pt, simple lodgings at 1.14pt, and ryokan at 1.20pt. Between business hotels and ryokan, the revision differs by a factor of 2.6.
That ordering tracks property size almost exactly. Recall that at the first preliminary stage the valid response rate was 40.1% for properties with 20 or more rooms and 20.4% for those with fewer than 20. Large business and city hotels have nearly all responded by the time the first preliminary figures are compiled, so the later increment does not move their numbers much. Ryokan and simple lodgings, which contain a high share of small properties, have thin response coverage at the first preliminary stage, and their estimates move as responses accumulate for the second. For June 2026 data, simple lodgings were revised upward from 23.0% to 26.1%, a 3.1pt move — the largest revision across the seven months.
This asymmetry matters especially to people at ryokan and resort properties reading the first preliminary figures. The preliminary value for their own property type is structurally less stable than the one for urban hotels. Discussing ryokan occupancy off the first preliminary figures risks having to redo the argument the following month on a number that has moved by 1.2pt on average.
Even Annual Figures Flip Sign
Revision does not stop at the second preliminary stage. The annual figures published the following year carry one more revision, from preliminary to final. The 2025 annual figures were published as preliminary on February 27, 2026 and as final on July 6, 2026.
| 2025 annual figures | Preliminary | Final | Revision |
|---|---|---|---|
| Total guest nights | 653.48 million | 661.11 million | +1.2% |
| Same, year-on-year | -0.8% | +0.3% | +1.1pt (sign flip) |
| Foreign guest nights | 177.87 million | 179.92 million | +1.2% |
| Room occupancy rate (overall) | 61.8% | 61.6% | -0.2pt |
Source: JTA “Accommodation Travel Statistics Survey (2025 annual figures, final)” (published July 6, 2026), compiled by the HotelBank Editorial Team
Annual total guest nights were revised upward from preliminary to final by 7.63 million nights, or 1.2%. As a result, the year-on-year change flipped sign from −0.8% to +0.3%. The preliminary-stage reading that “2025 fell short of the prior year” became, in the final figures, “2025 edged past the prior year.” The room occupancy rate, meanwhile, was revised by only −0.2pt — again the more stable of the two. Headcount-based metrics are vulnerable to revision and ratio-based metrics are resilient to it, and that pattern holds consistently at both monthly and annual frequency. The swing in these 2025 annual figures from preliminary to final is broken out by property type in JTA 2025 Final OCC 61.6%: 0.2pt Revision from 61.8% by Property Type.
Reading the Latest Figure — Separating July 2026’s 60.8% from Seasonality
According to the latest release, published August 31, 2026, the room occupancy rate for July 2026 was 60.8% overall (first preliminary), and June 2026 was 57.2% (second preliminary). Taking a month-on-month reading here and concluding that “occupancy improved 3.6pt from June to July” is close to a mistake. Lodging demand is strongly seasonal, and July running above June is a structure that repeats every year.
Source: JTA “Accommodation Travel Statistics Survey,” room occupancy trend tables by property type, compiled by the HotelBank Editorial Team. 2023–2025 are final figures; January–June 2026 are second preliminary figures; July 2026 is a first preliminary figure.
Overlaying the months shows nearly the same waveform every year: June is the annual trough, with peaks in August and October–November. June 2026’s 57.2% is not a “plunge” but a reflection of June being the trough as usual. What should be read, therefore, is not the month-on-month change but the year-on-year difference: −1.6pt for June 2026 and −0.4pt for July 2026.
It is worth confirming the effect of revision once more here. At the first preliminary stage, June 2026 stood at 56.2%, a year-on-year difference of −2.6pt. The second preliminary figures revised that to 57.2% and −1.6pt, shrinking the decline from the prior year by 1.0pt. Someone who read “a sharp 2.6pt drop” right after the preliminary release and someone who read “a 1.6pt decline” a month later were looking at different pictures of the same month.
| Property type | July 2026 (1st preliminary) | YoY difference | June 2026 (2nd preliminary) | YoY difference |
|---|---|---|---|---|
| Overall | 60.8% | -0.4pt | 57.2% | -1.6pt |
| Business hotels | 74.2% | -0.5pt | 71.5% | -1.3pt |
| City hotels | 71.9% | +0.3pt | 69.2% | -3.3pt |
| Resort hotels | 59.6% | +2.7pt | 50.8% | +0.2pt |
| Ryokan | 40.6% | +3.4pt | 36.7% | +1.7pt |
| Simple lodgings | 30.9% | -1.9pt | 26.1% | -2.1pt |
Source: JTA “Accommodation Travel Statistics Survey (July 2026 first preliminary; June 2026 second preliminary),” compiled by the HotelBank Editorial Team
By property type, July 2026 saw domestic leisure formats run above the prior year — ryokan at +3.4pt and resort hotels at +2.7pt — while urban formats sat near flat. But as the previous section showed, ryokan and resort hotels are the property types whose first preliminary figures carry average revisions of 1.1 to 1.2pt. That “+3.4pt” should be read on the assumption that the number will move in the second preliminary figures scheduled for publication on September 30, 2026.
Prefecture-level detail appears only in the second preliminary figures, most recently for June 2026 data. Overall occupancy is highest in Tokyo at 75.4%, followed by Fukuoka at 70.3%, Osaka at 65.3%, Kanagawa at 64.4%, and Hokkaido at 63.4%. The lowest is Nagano at 34.7%, followed by Yamanashi at 37.1% and Wakayama at 39.3%. This bottom group, however, consists of regions with a high share of ryokan, pensions, and other properties with large capacity per room, plus seasonally operated properties — so, returning to the definitions in the previous section, “low occupancy equals weak demand” is not a conclusion that follows.
Official Statistics Alongside Proprietary Data — Complement, Not Substitute
The JTA room occupancy rate is monthly, and it takes roughly two months for the second preliminary figures to appear. August results firm up at the end of October. Occupancy estimated from the depletion of OTA-listed sales inventory, by contrast, is daily and can be obtained for future stay dates. That difference in time horizon invites the thought that “we can just use our own estimate instead of the official statistic” — but that does not hold. The two measure different quantities even though they carry the same name.
For June 2026, we lined up the JTA second preliminary figures and MetroEngines Research estimated occupancy for the same prefectures and the same month.
| Prefecture | JTA room occupancy | Our estimated occupancy | Difference | Properties in our sample |
|---|---|---|---|---|
| Tokyo | 75.4% | 92.8% | +17.4pt | 1,336 |
| Osaka | 65.3% | 83.9% | +18.6pt | 695 |
| Kanagawa | 64.4% | 84.2% | +19.8pt | 645 |
| Hokkaido | 63.4% | 89.3% | +25.9pt | 1,316 |
| Kyoto | 61.7% | 85.8% | +24.1pt | 967 |
| Okinawa | 55.1% | 87.3% | +32.2pt | 1,136 |
Source: JTA “Accommodation Travel Statistics Survey (June 2026, second preliminary)” / MetroEngines Research (June 2026, estimate based on OTA-listed sales inventory), compiled by the HotelBank Editorial Team
Source: JTA “Accommodation Travel Statistics Survey (June 2026, second preliminary)” / MetroEngines Research, compiled by the HotelBank Editorial Team
Not only do the levels sit 17 to 32pt apart, the prefecture rankings do not match either. On the JTA basis, Okinawa is last among these six prefectures; on our estimate it ranks third, behind only Tokyo and Hokkaido. That ranking mismatch is the clearest expression of the fact that the two are not substitutes. The reasons for the gap sort into three.
| Factor | JTA room occupancy | Our estimated occupancy |
|---|---|---|
| Population | All lodging establishments licensed under the Inns and Hotels Act (75,665 properties), including low-occupancy small ryokan and simple lodgings | Only properties whose activity can be observed on OTAs. Ryokan, minshuku, and simple lodgings not listed on OTAs are excluded |
| Denominator | Registered room count × days in the month (all inventory) | Based on sales inventory listed on OTAs. Rooms held outside those listings — direct, group, and corporate-contract allocations — do not enter the denominator, so the value comes out structurally higher |
| Operating days | Closed days still count toward the denominator, which pushes the rate down in regions with many seasonally operated properties | Days on which nothing is offered for sale are not observed at all |
Source: JTA “Accommodation Travel Statistics Survey — Glossary” / MetroEngines Research, compiled by the HotelBank Editorial Team
Okinawa shows the largest gap, most likely because all three factors compound there. The prefecture holds many small minshuku and simple lodgings, every one of which falls inside the JTA population, while what we can observe is limited to the 1,136 properties listed for sale on OTAs.
In practice, then, the split runs like this: use the JTA published figures when discussing levels, when comparing against the prior year, and when presenting evidence externally; use proprietary data when reading supply and demand for stay dates from next month onward, and when tracking inventory depletion by day of week or by event date. When placing the two side by side, the correct use is not to reconcile the levels but to check whether the direction of travel agrees.
Frequently Asked Questions (FAQ)
Q1. Where can I find the room occupancy rate from the Accommodation Travel Statistics Survey?
On the survey’s page within “Tourism Statistics and White Papers” on the JTA website, and in the press releases issued at the end of each month. The press release PDFs carry nationwide, property-type, and prefecture-level room occupancy rates, plus an appended “total guest nights and room occupancy trend table” listing annual figures from 2007 onward and monthly figures from 2023 onward. If you need prefecture-level monthly time series, the fastest route is to download the trend table Excel file from that same page.
Q2. Why can’t I get the latest month’s data from e-Stat?
Because the Accommodation Travel Statistics Survey database held on e-Stat (the Japanese government statistics portal) has stopped being updated. As of September 2026 there are 32 tables retrievable via the API, but every one of them covers the survey period January to December 2016 and carries an update date of March 16, 2019. Use e-Stat when you need final figures through 2016 broken out in fine detail (by number of employees, by purpose-of-stay share, by guest-capacity occupancy, and so on), and always take the latest month’s figures from the JTA press releases. The guest-capacity occupancy data in this article uses 2016 final figures for the same reason.
Q3. Is there data by prefecture or by municipality?
Prefecture-level data (47 divisions) is published every month with the second preliminary figures. Total guest nights, Japanese guest nights, foreign guest nights, and room occupancy by property type are all available by prefecture. At the first preliminary stage, however, only nationwide and property-type figures appear — there is no prefecture breakdown. Nothing is published at the municipal level; the finer geographic division available is a separate “wide-area municipality (130 divisions)” aggregation. If you need to track occupancy for a single municipality monthly, this statistic cannot serve as a substitute, so you will need to combine other sources such as a local government’s own tourism statistics or accommodation-tax collection records.
Q4. Should I use the guest-capacity occupancy rate or the room occupancy rate?
If the purpose is comparing different property types or different regions side by side, use the room occupancy rate. The guest-capacity occupancy rate is heavily influenced by capacity per room, so measuring a ryokan built around Japanese-style rooms against a business hotel built around singles on the same yardstick makes the ryokan look structurally disadvantaged. In the 2016 final figures, the guest-capacity occupancy rate as a share of the room occupancy rate was 0.85 for city and business hotels, 0.65 for ryokan, and 0.58 for simple lodgings. Where you want to see, for a single property, whether rooms are filling but capacity is being left unused — that is, whether double-capacity rooms are being sold to single occupants — the guest-capacity occupancy rate is the right measure.
Q5. Should I cite the first or the second preliminary figures?
If the number is going to support a decision or an external explanation, use the second preliminary figures or later. As this article shows, across the seven months from December 2025 data through June 2026 data, the year-on-year change in total guest nights was revised from first to second preliminary by 1.8pt on average and 2.9pt at the maximum. The revision in room occupancy is comparatively small at 0.6pt on average, so for the purpose of catching the direction of travel in occupancy at the preliminary stage, the first preliminary figures are serviceable. Ryokan and simple lodgings carry larger revisions of 1.1 to 1.2pt, though, so for those two property types we recommend waiting for the second preliminary figures. Whenever you cite a number, always state whether it is a first preliminary, second preliminary, or final figure.
Q6. I’ve heard year-on-year figures are hard to read from 2026. Why?
Because from the January 2026 survey month, the stratification criterion of the sample design changed from “number of employees” to “number of rooms.” Through December 2025, establishments with 10 or more employees were subject to complete enumeration; from January 2026, that became establishments with 20 or more rooms. The JTA notes at the top of its press releases that “with respect to year-on-year (same-month) changes and differences, note that the effect of the revision may be included.” If continuity of the time series matters to you, one approach is to use the series restricted to “establishments with 20 or more rooms,” which is published alongside in the press releases and trend tables.
Q7. How do total guest nights differ from actual guest counts?
Total guest nights is “the cumulative number of guests in each month” — two people staying two nights counts as four guest nights. The actual guest count is “the number of people who checked in during each month,” and the same case counts as two. Dividing total guest nights by the actual guest count therefore gives the average length of stay. What the press releases feature prominently each month is total guest nights, used together with the room occupancy rate as a measure of total demand. Note that total guest nights include children and infants, and cover anyone using the facility with bedding.
Conclusion
The Accommodation Travel Statistics Survey estimates monthly figures from a population of 75,665 lodging establishments nationwide, of which 20,829 are surveyed. The first preliminary figures are published at a valid response rate of 32.9%, which builds to 44.6% by the second preliminary release a month later. Because that increment arrives mainly from small properties, the size of the revision varies sharply by property type — 0.46pt for business hotels against 1.20pt for ryokan, a gap of 2.6 times.
Among the metrics, the room occupancy rate is resilient to revision, while total guest nights and their year-on-year change are vulnerable to it. The first-preliminary year-on-year change moves by 1.8pt on average and 2.9pt at the maximum, and even the annual figures have on record flipped sign from preliminary to final. It is safer to assume that an argument premised on a preliminary number to one decimal place does not hold.
And the room occupancy rate has to be read faithfully to its definition: rooms used ÷ (rooms × days in the month). Once you take on board that the denominator is calendar days rather than operating days, and that closed rooms stay in the denominator, it becomes clear that low occupancy in regional areas does not signify weak demand alone. Occupancy estimated from OTA inventory depletion has the advantage of being daily and forward-looking, but with a different population and a different denominator, it cannot stand in for the official statistic. The basic split: the JTA when discussing levels, proprietary data when reading ahead.
Related Reading
- What Is Hotel ADR? Settled Rates 34-57% of Listed Prices, 2026
- What Is RevPAR? ADR x Occupancy, and Why GOP Splits 1.81x in 2026
- JTA 2025 Final OCC 61.6%: 0.2pt Revision from 61.8% by Property Type
- June 2026 Occupancy 56.2%: Guest-Nights per Room in 47 Prefectures
- Record Inbound Arrivals, Fewer Guest Nights: 3.96 Nights Per Visitor
- 98,338 Licensed Lodgings vs 27,248 on OTAs: Japan’s 71,090 Gap
- City Hotels: 45.9% of Guest Nights Are Foreign — Ryokan +3.7%
References and Sources
■ Data sources
JTA “Accommodation Travel Statistics Survey” monthly press releases (published January 30 to August 31, 2026; seven releases in total), the same survey’s “Survey Outline” and “Glossary (excerpted from the annual report),” the annual final figures held on e-Stat (Tables 6 and 8, 2016, nationwide), and MetroEngines Research OTA-listed sales inventory data (June 2026, six prefectures, 6,095 properties in total).
■ Calculation assumptions
Revisions are calculated by taking the difference between the first and second preliminary values for the same reference month, then averaging the absolute values across seven months. Property-type revisions use the same seven months and the same method. Our estimated occupancy is derived from the depletion of sales inventory listed on OTAs, computed daily within the month and aggregated to a monthly average. Year-on-year differences and changes are used exactly as published by the JTA and are not recalculated on our side.
■ Limitations and caveats
(1) From the January 2026 survey month, the stratification criterion of the sample design changed from number of employees to number of rooms, so 2026 year-on-year changes and differences may include the effect of that revision (JTA note). (2) Because e-Stat coverage of guest-capacity occupancy by property type stops at 2016, the capacity-to-room ratios use 2016 final figures. (3) Our estimated occupancy differs from the JTA room occupancy rate in both population and denominator, so the levels cannot be compared directly. (4) July 2026 is a first preliminary figure and will be revised in the second preliminary release scheduled for September 30, 2026.
■ Primary sources (Japan Tourism Agency)
- JTA “Accommodation Travel Statistics Survey” (Tourism Statistics and White Papers)
- JTA “Accommodation Travel Statistics Survey — Survey Outline” (PDF) — survey scope, stratification criteria, property-type definitions
- JTA “Accommodation Travel Statistics Survey — Glossary (excerpted from the annual report)” (PDF) — definitions of total guest nights, room occupancy, and guest-capacity occupancy
- JTA “Accommodation Travel Statistics Survey (July 2026 first preliminary; June 2026 second preliminary)” (August 31, 2026)
- JTA “Accommodation Travel Statistics Survey (May 2026 second preliminary; June 2026 first preliminary)” (July 31, 2026)
- JTA “Accommodation Travel Statistics Survey (April 2026 second preliminary; May 2026 first preliminary; and 2025 annual figures, final)” (July 6, 2026)
- JTA “Accommodation Travel Statistics Survey (March 2026 second preliminary; April 2026 first preliminary)” (May 29, 2026)
- JTA “Accommodation Travel Statistics Survey (February 2026 second preliminary; March 2026 first preliminary)” (April 30, 2026)
- JTA “Accommodation Travel Statistics Survey (January 2026 second preliminary; February 2026 first preliminary)” (March 31, 2026)
- JTA “Accommodation Travel Statistics Survey (December 2025 second preliminary; January 2026 first preliminary) and 2025 annual figures (preliminary)” (February 27, 2026)
- JTA “Accommodation Travel Statistics Survey (November 2025 second preliminary; December 2025 first preliminary)” (January 30, 2026)
■ Government statistics database
- e-Stat “Accommodation Travel Statistics Survey (annual final figures),” Table 6: guest-capacity occupancy rate by property type (table ID: 0003313681)
- e-Stat “Accommodation Travel Statistics Survey (annual final figures),” Table 8: room occupancy rate by property type (table ID: 0003313904)
■ Market data
- MetroEngines Research — estimated occupancy based on OTA-listed sales inventory (June 2026, six prefectures, 6,095 properties in total)