

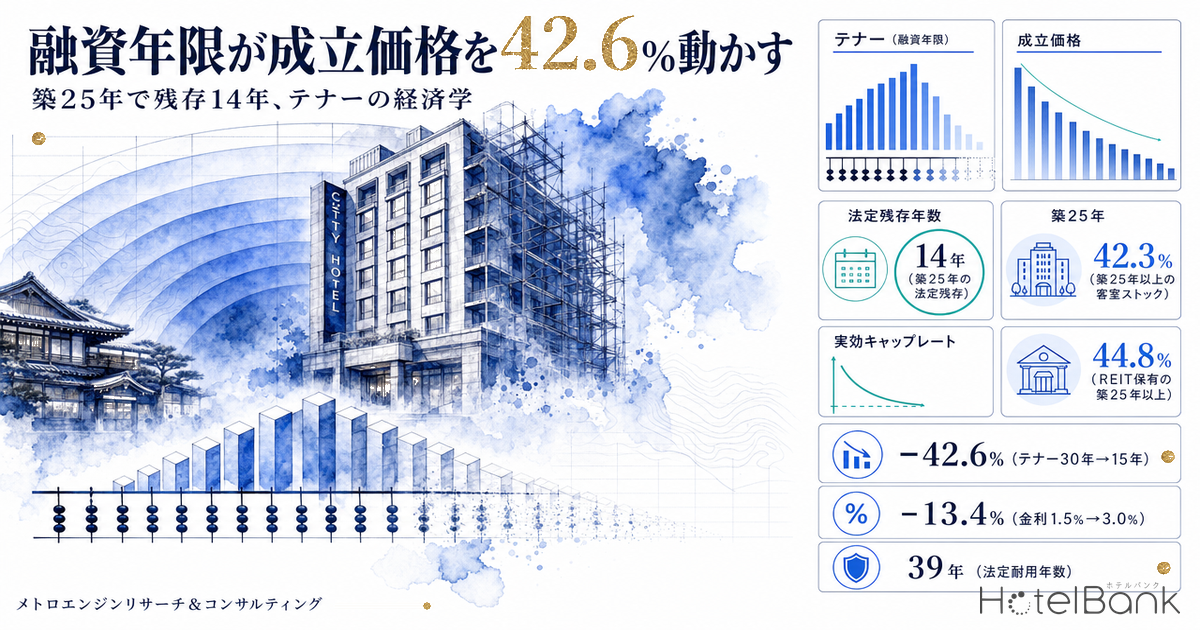
In a hotel acquisition memo, the interest rate always gets debated. So does LTV. Yet the variable that moves the supportable price the most is sometimes neither of them. It is the loan tenor — how many years the lender will actually lend for. Even if the rate doubles from 1.5% to 3.0%, the supportable price falls only around 13% as long as a 20-year repayment term holds. By contrast, hold the rate flat at 2.0% and halve the repayment term from 30 years to 15, and the supportable price drops 42.6% on the same NOI, the same LTV and the same DSCR. This article quantifies that “term-as-the-subject” view of pricing using the statutory useful-life regime, our own lodging market data, and the building-age distribution of 299 listed hotel REIT properties.
How this differs from our earlier work: A 1.00% Policy Rate and Hotel Development and Hotel Funding in a 1% Rate Era are about cost of capital (rates and funding instruments); PML Moves LTV and Yield is about leverage levels; 236,000 Pre-1981 Seismic-Code Hotel Rooms, Hotel Capital Expenditure and Is a Glamping Facility Depreciated Over 4 Years or 39? are about physical condition and depreciation. What this article covers is neither rates, nor LTV, nor depreciation, but a single question: the repayment term itself and how much it moves the supportable price.
Metric Definitions Used in This Article
- ADR (average daily rate): An estimated settled rate (tax-excluded equivalent) calculated by applying a category-specific adjustment factor to the lowest published plan rate each property lists on OTAs (two guests per room, per-room rate, tax included). Cross-checked against property-level results disclosed by listed hotel REITs (91 properties, most recent three months), the median error is roughly 7%. These are estimates and differ from each property’s actual transacted rates or accounting figures. Area-level ADR is the median of the properties covered (the level of a typical property in that area). Where listed prices are referenced, they are per-room rates for two guests per room (tax included).
- RevPAR: The RevPAR shown in this article consists of property-level results disclosed monthly by listed hotel REITs (tax-excluded equivalent). These are not our own estimates.
- Tenor (loan term): The contractual repayment period of the borrowing. This article assumes level-payment (equal principal-and-interest) amortization.
- DSCR: NOI ÷ annual principal-and-interest payment. Below 1.0, NOI does not cover debt service.
- Supportable price: The maximum acquisition price a buyer can pay under given constraints on rate, tenor, LTV and DSCR. It is a computational concept within this article’s worked examples, and is neither an appraisal value nor an actual transaction price.
- Building age: Years counted back from 2026 based on the opening year of each property in our database (the point at which it opened as a lodging facility). It may not match the building’s actual completion year or its renovation and extension history.
- Data sources: MetroEngines Research & Consulting / monthly operating results disclosed by each REIT (IR disclosures)
- — Tenor 30 yrs → 15 yrs cuts the supportable price 42.6%. On the same NOI, the same rate and the same LTV, halving the repayment term alone cuts what a buyer can pay by more than 40%.
- — Moving the rate from 1.5% to 3.0% costs 13.4% (tenor fixed at 20 years). Term bites more than three times as hard as rate, so sensitivity analysis in an investment memo needs tenor as one of its axes.
- — At age 25, 14 years of statutory life remain. That is counted back from the 39-year statutory useful life for hotel-use SRC/RC buildings, and every additional year of age shortens the tenor by one year.
- — Earnings do not fall with building age. Across 171 REIT-held properties, disclosed results put median occupancy highest in the 30–39-year band at 89.6%, and median RevPAR there also exceeds the newer bands.
- — The affected stock is 42.3% of all rooms (956,200). Assets whose earnings hold up but whose tenor shortens mechanically by regulation account for 40% of the market.
Term bites harder than rate — the supportable price moves 42.6% on identical NOI
Start with the conclusion. Even with identical NOI (net operating income), what a buyer can pay changes substantially when the tenor changes. The reason is simple: under level-payment amortization, the annual debt service is divided back out across the term. With annual debt service DS, interest rate i and term n years, the borrowable amount L is determined as follows.
DS = NOI ÷ DSCR / L = DS ÷ [ i ÷ ( 1 − (1+i)−n) ] / Supportable price P = L ÷ LTV
The rate i enters linearly in the numerator, but the term n sits inside the exponent. The shorter n becomes, the faster the annuity present-value factor shrinks, and the smaller the principal that the same DS can carry. The chart below puts the price impact of moving the rate and the price impact of moving the tenor on the same vertical axis.
Doubling the rate from 1.5% to 3.0% takes the supportable price only from ¥4,064 million to ¥3,521 million — a 13.4% decline — so long as a 20-year tenor holds. But keep the rate at 2.0% and move the tenor from 30 years to 15, and ¥5,301 million becomes ¥3,041 million, a fall of 42.6%. The contrast is sharper still at the extremes. A 1.5% rate with a 15-year tenor supports ¥3,158 million; a 3.0% rate with a 30-year tenor supports ¥4,639 million. Even at double the rate, double the term lets the buyer pay 46.9% more. Grinding the rate assumption down in 0.25% increments has its place in an investment memo, but there are situations where negotiating one more year of tenor moves the price by an order of magnitude more.
Why 39 years is the starting point — statutory useful life and the simplified method set the remaining years
So what determines the tenor? The practical benchmark is the building’s remaining useful life. Under Appended Table 1 of the Ministerial Ordinance on Useful Lives of Depreciable Assets, the statutory useful life of hotel- and ryokan-use buildings of steel-framed reinforced concrete or reinforced concrete construction is set at 39 years (within the same hotel-use category, brick, stone and block construction is 36 years; metal-frame construction is 29, 24 or 17 years depending on the thickness of the frame members; and wooden and synthetic-resin construction is 17 years).
In lending practice, financial institutions widely use the “statutory remaining life” — 39 years less elapsed years — as the ceiling benchmark for loan tenor. There is also a second yardstick, the simplified method used to determine the useful life of used assets for tax purposes. An asset that has passed its full statutory useful life is assigned “statutory useful life × 20%”; one that has passed part of it is assigned “(statutory useful life − elapsed years) + elapsed years × 20%”. Some regional banks and shinkin banks will extend loan terms out to the simplified-method figure, or apply their own standard (for RC construction, “70 − building age”, for example), so tenor is not uniform. The direction of travel is common to all of them, however: for every additional year of building age, the term you can borrow for shortens by one year.
| Building age | Statutory remaining life (39 − elapsed years) | Simplified-method years ((39−n)+0.2n) | Indicative tenor in practice |
|---|---|---|---|
| Age 5 | 34 yrs | 35.0 yrs | approx. 34 yrs |
| Age 10 | 29 yrs | 31.0 yrs | approx. 29 yrs |
| Age 15 | 24 yrs | 27.0 yrs | approx. 24 yrs |
| Age 20 | 19 yrs | 23.0 yrs | approx. 19 yrs |
| Age 25 | 14 yrs | 19.0 yrs | approx. 14 yrs |
| Age 30 | 9 yrs | 15.0 yrs | approx. 9 yrs |
| Age 35 | 4 yrs | 11.0 yrs | approx. 4 yrs |
| Age 40 | 0 yrs | 7.8 yrs | approx. 8 yrs |
| Age 45 | 0 yrs | 7.8 yrs | approx. 8 yrs |
The threshold to watch here is age 25. At that point the statutory remaining life drops below 14 years. Assuming lenders for whom regional-bank and shinkin credit practice makes it hard to lend beyond the statutory remaining life, properties older than 25 years effectively enter a world of 14-year tenors or less, and those older than 30 years, 9 years or less. On the sensitivity above, a tenor of around 14 years sits in the zone where the supportable price falls by more than 40% versus 30 years.
Supportable price by tenor — ¥5,301 million at 30 years, ¥2,126 million at 10
Worked-example assumptions (fully disclosed)
· 150 rooms, annual NOI ¥200 million (about ¥1.33 million per room) / · funding rate 2.0% (assuming a 1.00% policy rate plus a 1.00% spread) / · LTV 65% / · DSCR standard 1.30 / · level-payment amortization, constant through the holding period / · NOI held constant (no growth or decay assumed) / · acquisition costs, tail period and prepayment penalties are not considered
All figures in this section are worked examples and do not represent any actual property, transaction or financing terms. Please read them as clearly distinct from the real data presented later. How much the acquisition costs this article sets aside erode the net yield is built up separately in Hotel acquisition costs run to 7.1% of price.
| Tenor | Annual debt service (¥mn) | Borrowable amount (¥mn) | Supportable price (¥mn) | Price per room (¥mn) | Equity required (¥mn) | Effective CR | CoC | vs 30 yrs |
|---|---|---|---|---|---|---|---|---|
| 30 yrs | 153.8 | 3,446 | 5,301 | 35 | 1,855 | 3.77% | 2.49% | +0.0% |
| 25 yrs | 153.8 | 3,004 | 4,621 | 31 | 1,617 | 4.33% | 2.85% | -12.8% |
| 20 yrs | 153.8 | 2,516 | 3,870 | 26 | 1,355 | 5.17% | 3.41% | -27.0% |
| 15 yrs | 153.8 | 1,977 | 3,041 | 20 | 1,064 | 6.58% | 4.34% | -42.6% |
| 10 yrs | 153.8 | 1,382 | 2,126 | 14 | 744 | 9.41% | 6.20% | -59.9% |
| 7 yrs | 153.8 | 996 | 1,532 | 10 | 536 | 13.06% | 8.61% | -71.1% |
Reading the table across, three consequences of a shorter tenor happen at once. First, the supportable price falls. Second, because the price falls, the effective cap rate jumps from 3.77% to 13.06% — which shows that the main driver of the “older assets look high-yielding” phenomenon is not only property risk premium, but the fact that financing constraints have pushed the price down in the first place. Third, levered cash-on-cash improves in the opposite direction (2.49% → 8.61%). A shorter repayment term amortizes principal faster, so cash flow during the hold is thinner but equity turns over more quickly. In other words, a short-tenor property is an investment that is “cheap to buy, thin on interim cash flow, and fast on principal repayment”. That is a different kind of equity story, and an investor seeking interim income and one targeting equity build-up through principal amortization will pay different amounts for the very same property.
| Scenario | NOI (¥mn) | Tenor | Borrowable amount (¥mn) | Supportable price (¥mn) | Price per room (¥mn) | Effective CR | CoC | How the assumption is set |
|---|---|---|---|---|---|---|---|---|
| Optimistic | 220 | 19 yrs | 2,653 | 4,082 | 27.2 | 5.39% | 3.55% | Term secured by bringing in long-term funding or applying the simplified method |
| Base | 200 | 14 yrs | 1,862 | 2,865 | 19.1 | 6.98% | 4.60% | Exactly the statutory remaining life (age 25) |
| Pessimistic | 175 | 9 yrs | 1,099 | 1,690 | 11.3 | 10.35% | 6.83% | Tighter credit shortens the tenor and NOI deteriorates at the same time |
Up to this point NOI was held constant and only the tenor moved, but in practice the two move together. Placing a 25-year-old property into the three scenarios above puts the supportable price at ¥1,690 million to ¥4,082 million — the optimistic case is 42.5% above the base case (¥2,865 million) and the pessimistic case 41.0% below it, a 2.41-fold spread from bottom to top. What is worth noting is that even in the pessimistic scenario the effective cap rate looks high, at 10.35%. Looking high-yielding and being a good investment are two different things.
| Rate \ Tenor | 30 yrs | 25 yrs | 20 yrs | 15 yrs | 10 yrs | Tenor delta |
|---|---|---|---|---|---|---|
| 1.0% | 6,108 | 5,213 | 4,271 | 3,282 | 2,242 | -63.3% |
| 1.5% | 5,684 | 4,904 | 4,064 | 3,158 | 2,183 | -61.6% |
| 2.0% | 5,301 | 4,621 | 3,870 | 3,041 | 2,126 | -59.9% |
| 2.5% | 4,954 | 4,361 | 3,690 | 2,931 | 2,071 | -58.2% |
| 3.0% | 4,639 | 4,121 | 3,521 | 2,826 | 2,019 | -56.5% |
| Rate delta | -24.1% | -20.9% | -17.6% | -13.9% | -9.9% | — |
Laid out on two axes, the difference in impact is immediately visible. Moving horizontally (shortening the tenor from 30 years to 10), the price change at each rate level is −56.5% to −63.3%, while moving vertically (raising the rate from 1.0% to 3.0%, a tripling), the price change at each tenor is no more than −9.9% to −24.1%. In the most extreme diagonal comparison, a 3.0% rate with a 30-year tenor (¥4,639 million) supports 2.07 times what a 1.0% rate with a 10-year tenor (¥2,242 million) does. Even at one-third the rate, one-third the term halves the price and more. And because the rate bites harder the longer the tenor is (−24.1% at 30 years, −9.9% at 10), the ordering also tells you that negotiating the rate only matters on deals where long-term funding is available in the first place.
Real data: building age is not pushing room rates down monotonically
Everything so far has been a worked example. So do hotels that have aged actually generate less cash flow? From here we test that against real data — our own lodging market data and the property-level results disclosed by listed hotel REITs.
Start with our own data. We extracted properties with a known opening year and 30 or more rooms into building-age bands (taking the top 400 properties by room count in each band as the population, and limiting it to properties with at least three recent months of results), then aggregated the property-level median of estimated settled ADR for March–August 2026 by band (N=1,767 properties). The result is not a monotonic decline.
| Age band | Properties | Median ADR | 1st quartile | 3rd quartile |
|---|---|---|---|---|
| Under 10 yrs | 275 | ¥13,902 | ¥9,360 | ¥21,926 |
| 10–19 yrs | 253 | ¥10,934 | ¥7,949 | ¥15,331 |
| 20–24 yrs | 328 | ¥8,708 | ¥7,552 | ¥11,166 |
| 25–29 yrs | 334 | ¥8,992 | ¥7,197 | ¥13,037 |
| 30–39 yrs | 289 | ¥10,650 | ¥7,659 | ¥15,652 |
| 40+ yrs | 288 | ¥12,114 | ¥8,748 | ¥18,927 |
The highest band is under 10 years old (¥13,900), but that reflects new openings being concentrated in high-occupancy urban locations. The trough is the 20–24-year band (¥8,700), and from there the figures actually rise. The 40+ band is ¥12,100, 39.1% above the 20–24 band. The reason is category mix. The 40+ band contains a heavy weighting of hot-spring ryokan and resorts that serve two meals and command high rates, while the 20–24 band is concentrated in limited-service properties supplied in bulk in the early 2000s. Building age is a weak variable for explaining room rates.
The same pattern holds in the property-level results disclosed by listed hotel REITs. Of the 299 properties held by seven investment corporations (our ownership master, snapshot as of 31 August 2026, domestic properties), the 171 for which property-level RevPAR was available in the most recent disclosure month line up by building-age band as follows.
| Age band | Properties | Median RevPAR | Median ADR | Median occupancy |
|---|---|---|---|---|
| Under 10 yrs | 56 | ¥7,670 | ¥9,940 | 80.7% |
| 10–19 yrs | 28 | ¥11,916 | ¥13,588 | 84.2% |
| 20–24 yrs | 5 | ¥10,305 | ¥11,240 | 91.7% |
| 25–29 yrs | 7 | ¥17,643 | ¥19,852 | 88.1% |
| 30–39 yrs | 39 | ¥10,635 | ¥11,749 | 89.6% |
| 40+ yrs | 36 | ¥10,889 | ¥11,794 | 84.8% |
Median RevPAR is ¥10,600 in the 30–39 band and ¥10,900 in the 40+ band, both above the ¥7,700 of the under-10 band.On occupancy, the 30–39 band is the highest of the well-populated bands at 89.6% (the outright maximum is the thin 20–24 band at 91.7%, N=5).What these properties actually earn does not fall monotonically with building age.
This is the crux of the article. Earnings are not falling, yet the tenor shortens mechanically in line with the regime. The result is a financing-driven price gap between two properties generating identical NOI, attributable to building age alone. Back in the worked example, a 10-year-old property (29-year tenor) at ¥5,170 million and a 30-year-old property (9-year tenor) at ¥1,932 million are both generating exactly the same ¥200 million of NOI.
Properties aged 25+ hold 42.3% of room stock — 956,200 rooms with a narrowed buyer pool
How large is the asset base this applies to? Breaking down the 38,390 properties and 2,261,074 rooms we track that have a known opening year and 10 or more rooms by building-age band, properties aged 25 and over account for 19,169 properties and 956,200 rooms, or 42.3% of the total on a room basis.
| Age band | Properties | Rooms | Room share | Statutory remaining life |
|---|---|---|---|---|
| Under 10 yrs | 8,498 | 652,537 | 28.9% | 29 yrs or more |
| 10–19 yrs | 7,238 | 450,684 | 19.9% | 20–29 yrs |
| 20–24 yrs | 3,485 | 201,653 | 8.9% | 15–19 yrs |
| 25–29 yrs | 2,282 | 144,106 | 6.4% | 10–14 yrs |
| 30–39 yrs | 10,803 | 438,147 | 19.4% | 0–9 yrs |
| 40+ yrs | 6,084 | 373,947 | 16.5% | 7.8 yrs, simplified method |
| Total | 38,390 | 2,261,074 | 100.0% | — |
The 956,200 rooms aged 25 and over sit, on standard lender credit criteria, in a world of tenors of 14 years or less. That is selective about buyers. Core investors chasing thin cap rates with long-dated non-recourse loans cannot even enter the bidding, because the repayment term cannot be arranged. What remains are three types: (1) cash buyers able to raise the equity ratio substantially, (2) funds that come in on short-term bridge or value-add money and turn the asset in three to five years after renovation and rebranding, and (3) operating companies that can absorb the short repayment term with unrealized gains on land they hold or with cash flow from their core business. Behind the complaint that trades in older hotels “price inconsistently” or “fail to attract bidders” lies not a demand problem, but a contraction of the buyer pool caused by tenor. How far the option of converting to a non-lodging use supports the downside is a separate question, and one that turns on the breadth of available exits.
That said, listed REITs are not avoiding older assets. The median building age across the 299 properties held by the seven investment corporations is 19 years; properties aged 25 and over account for 44.8% (134 properties), and those aged 40 and over for 16.1% (48 properties). The median building age at the time of acquisition is 8 years, but 30.3% of acquisitions were of properties older than 25 years. Because REITs have unsecured corporate bonds, long-dated syndicated loans and follow-on unit issuance available to them, their loan tenor is less tightly bound to any single property’s remaining life. One way to read this is that a difference in financing structure translates directly into a difference in which buyer the asset suits.
Tenor decay — a seven-year hold can erode the exit price by up to 40.9%
The tenor problem does not end at acquisition. It bites at the exit too. The tenor a buyer can arrange at the point of sale is shorter again by the length of the holding period. Even if NOI does not fall by a single yen, the sale price falls purely from the decay in remaining years — what this article calls tenor decay.
The table below applies the same assumptions as the worked example (NOI ¥200 million, rate 2.0%, LTV 65%, DSCR 1.30), sets a holding period of seven years, and estimates the exit price by building age at acquisition. Tenor follows the statutory remaining life, with a floor of 7.8 years from the simplified method.
| At acquisition | Tenor at acquisition | Acquisition price (¥mn) | At sale | Tenor at exit | Exit price (¥mn) | Price change | NOI growth needed to hold the price (annual) |
|---|---|---|---|---|---|---|---|
| Age 10 | 29.0 yrs | 5,170 | Age 17 | 22.0 yrs | 4,179 | -19.2% | 3.09% |
| Age 15 | 24.0 yrs | 4,477 | Age 22 | 17.0 yrs | 3,383 | -24.4% | 4.08% |
| Age 20 | 19.0 yrs | 3,711 | Age 27 | 12.0 yrs | 2,503 | -32.5% | 5.79% |
| Age 25 | 14.0 yrs | 2,865 | Age 32 | 7.8 yrs | 1,694 | -40.9% | 7.80% |
| Age 30 | 9.0 yrs | 1,932 | Age 37 | 7.8 yrs | 1,694 | -12.3% | 1.90% |
The most painful case is buying at age 25 and selling at age 32. Against a 14-year tenor at acquisition, the exit tenor falls to the 7.8-year floor, and on identical NOI the exit price erodes by 40.9%. Offsetting that erosion through price would require NOI to grow over the seven-year hold at 7.80% a year (69.1% cumulatively). Sustaining 7.8% a year for seven years through ADR gains and occupancy improvement is not easy. Put the other way round, an acquisition at around age 25 calls for a design that places the return on interim cash flow and principal amortization rather than on sale proceeds. As shown above, CoC in this band is a healthy 4%-plus, and over a seven-year hold principal falls appreciably. The erosion in exit price is absorbed by the equity recovered through the principal repaid during the hold — that is the shape of the structure.
By contrast, buying at age 10 and selling at age 17 erodes the price by 19.2%, and the NOI growth required is only 3.09% a year. In the recent ADR upcycle that is comfortably within range, producing an asymmetry in which newer assets can “build an exit through NOI growth” while older assets cannot. Whether tenor remains is what governs the choice of exit strategy.
Age 20 and under — term is a weapon
A tenor of 19 years or more can be secured and the drag on the supportable price is limited. Exit erosion can be absorbed with NOI growth of 3–4% a year. Because players who can arrange long-term funding compete here, the acquisition contest is fierce.
Ages 25 to 35 — term sets the price
Statutory remaining life of 14 years or less. The supportable price falls more than 40% versus a 30-year tenor, and the effective cap rate looks high on the surface. Buyers narrow to cash buyers and value-add money, and price discovery works poorly.
Age 40 and over — the debate about term disappears
Statutory remaining life is zero. Tenor flattens out at around the 7.8 years of the simplified method as an effective floor, and no further tenor decay occurs. Pricing shifts its centre of gravity to land value and a redevelopment premise.
Implications for investment memos, credit underwriting and exit design
Finally, the practical implications by role.
For investment professionals writing an acquisition memo. We would suggest making tenor a mandatory axis in sensitivity analysis, alongside rate and cap rate. As shown above, a five-year difference in tenor has a larger price impact than a 1.5-percentage-point difference in rate. Confirming up front how many years your expected lender can go, before setting the bid price, avoids having to redo the price assumptions later in the process. And when you see a deal with a high effective cap rate, it is worth separating whether that reflects a property-specific risk premium or a price pushed down by a tenor constraint. If it is the latter, simply bringing longer-dated funding captures the upside on the same asset.
For lenders setting collateral values and terms. What the real data in this article shows is thatmedian occupancy in the 30–39-year band, at 89.6%, is the highest of the well-populated bands, and RevPAR there also exceeds the newer bands.Statutory remaining life is a tax yardstick, not a measure of how long cash flow will last. Read alongside the history of major repairs, the record of renewal investment and recent occupancy and rate trends, there is room for term-setting more precise than a mechanical application of statutory remaining life. As our earlier work on hotel capital expenditure showed — annual capex runs ¥130,000 to ¥620,000 per room — properties receiving continuous capital expenditure have extended their physical remaining life.
For asset managers reading the exit on older assets. The fact that tenor falls by one year for every year of the hold feeds directly into how the holding period is designed. If the holding period passes through the band where tenor decay is steepest (ages 20 to 32), you need either a design that absorbs the fall in exit price with interim cash flow and principal amortization, or a decision to sell out before leaving that band. The premise that “growing NOI grows the exit too” holds only for properties that still have tenor left.
Limitations and caveats: (1) Loan tenor is determined very differently by each lender’s credit policy, the borrower’s creditworthiness, the collateral and guarantee structure, sponsor support and other factors, and the “statutory remaining life = tenor” presented here is only one practical benchmark. In reality there are loans longer than the statutory remaining life, and also terms set far shorter. (2) The sensitivity tables and scenarios are all worked examples, and changing a single assumption changes the conclusion. An actual investment decision requires a property-specific feasibility study. (3) Building age is estimated from each property’s opening year in our database and may not match the building’s completion year, renovation and extension history, or structural classification.For wooden and metal-frame properties the statutory useful life is 17 to 29 years rather than 39, so tenor is shorter still. (4) ADR in this article is an estimate (median error of roughly 7% when cross-checked against listed REIT disclosed results). (5) ADR and RevPAR disclosed by REITs are shown excluding consumption tax.
Related reading
- A 1.00% Policy Rate and Hotel Development — Working Back to the Break-Even ADR Across 8 Major Markets
- 236,000 Pre-1981 Seismic-Code Hotel Rooms, 19.1% of All Rooms — Retrofit or Rebuild, the Tipping Point Across 588 Buildings
- A Structural Analysis of Regional Bank-Led Small-Scale Continuous Development and Renovation Funds
- Hotel Acquisition Costs Run to 7.1% of Price — Building Up How a 6.5% Gross Yield Becomes 4.65% Net
- Hotel Capital Allocation 2026 — One Deal Took 27% of J-REIT Quarterly Acquisitions, an Annual Breakdown of ¥941.9 Billion Actually Acquired
References and sources
■ Data sources
Estimated settled ADR by building-age band covers properties with a known opening year and 30 or more rooms, taking the top 400 properties by room count in each band as the population, limited to properties with at least three recent months of results, aggregating the property median for March–August 2026 (N=1,767 properties across five categories). The building-age distribution of room stock comes from our property master (N=38,390 properties, 2,261,074 rooms). REIT figures come from the ownership master for seven listed hotel REITs (snapshot as of 31 August 2026, 299 domestic properties) and from the property-level monthly operating results each investment corporation discloses (most recent disclosure month; 171 properties with RevPAR disclosed).
■ Calculation assumptions
All worked examples share common assumptions of 150 rooms, annual NOI ¥200 million, LTV 65%, DSCR 1.30, level-payment amortization and constant NOI (no growth or decay assumed), with the rate at 2.0% unless otherwise noted (assuming a 1.00% policy rate plus a 1.00% spread). Supportable price is the borrowable amount ÷ LTV; annual debt service is NOI ÷ DSCR; the borrowable amount is discounted back using the annuity present-value factor. Tenor uses the statutory remaining life (39 − building age) as its ceiling benchmark, floored at the 7.8 years given by the simplified method. Acquisition costs, tail period, prepayment penalties and disposal costs are not considered. The three scenarios show the spread when NOI and tenor move together and are not confidence intervals derived from a probability distribution.
■ Limitations and caveats
Loan tenor differs greatly by each lender’s credit policy, the borrower’s creditworthiness, the collateral and guarantee structure and sponsor support, and this article’s “statutory remaining life = tenor” is only one practical benchmark (loans longer than the statutory remaining life exist, as do far shorter terms). The worked-example figures do not represent any actual property, transaction or financing terms, and changing a single assumption changes the conclusion. Building age is counted back from each property’s opening year and may not match the building’s completion year, renovation and extension history or structural classification (for wooden and metal-frame construction the statutory useful life is 17 to 29 years, making the tenor shorter still). ADR is an estimate (median error of roughly 7% when cross-checked against listed REIT disclosed results). ADR and RevPAR disclosed by REITs are shown excluding consumption tax. The 20–24 and 25–29 bands are thin at N=5 to 7, so their medians should be read with care.
■ Market data
- MetroEngines Research & Consulting — estimated settled ADR (N=1,767 properties, March–August 2026); property opening years and room counts (N=38,390 properties, 2,261,074 rooms); REIT ownership master (snapshot as of 31 August 2026, 299 domestic properties)
■ Regulations and statutes
- Ministerial Ordinance on Useful Lives of Depreciable Assets (Ministry of Finance Ordinance No. 15 of 1965), Appended Tables 1 and 3 (e-Gov Law Search)
- National Tax Agency, Tax Answer No. 5404, “Useful Lives of Used Assets” (simplified method)
- Hyatt Japan (日本ハイアット株式会社), “Press Materials, April 2026” (used to cross-check opening years and room counts of Hyatt-affiliated properties shown on the map)
■ REIT monthly disclosures
- Invincible Investment Corporation (インヴィンシブル投資法人), monthly operating status (July 2026)
- Japan Hotel REIT (ジャパン・ホテル・リート投資法人), monthly disclosure (July 2026)
- Hoshino Resorts REIT (星野リゾート・リート投資法人), monthly operating results (June 2026)
- Ichigo Hotel REIT (いちごホテルリート投資法人), monthly disclosure (July 2026)
- Japan Hotel & Residential REIT (日本ホテル&レジデンシャル投資法人), monthly disclosure (July 2026)
- Kasumigaseki Hotel REIT (霞ヶ関ホテルリート投資法人), monthly disclosure (June 2026)
- Mori Trust REIT (森トラストリート投資法人), monthly disclosure (June 2026)
■ References on rates and lending practice
- Bank of Japan, “Statement on Monetary Policy” (policy rate around 1.0%, June 2026)
- Daiwa Zaitaku (大和財託), “What Is Useful Life in Real Estate Investment?” (practical explanation of loan terms and remaining useful life)
- Ooya no Mikata (大家の味方), “Bank Loan Terms Depend on the Building’s Useful Life”