

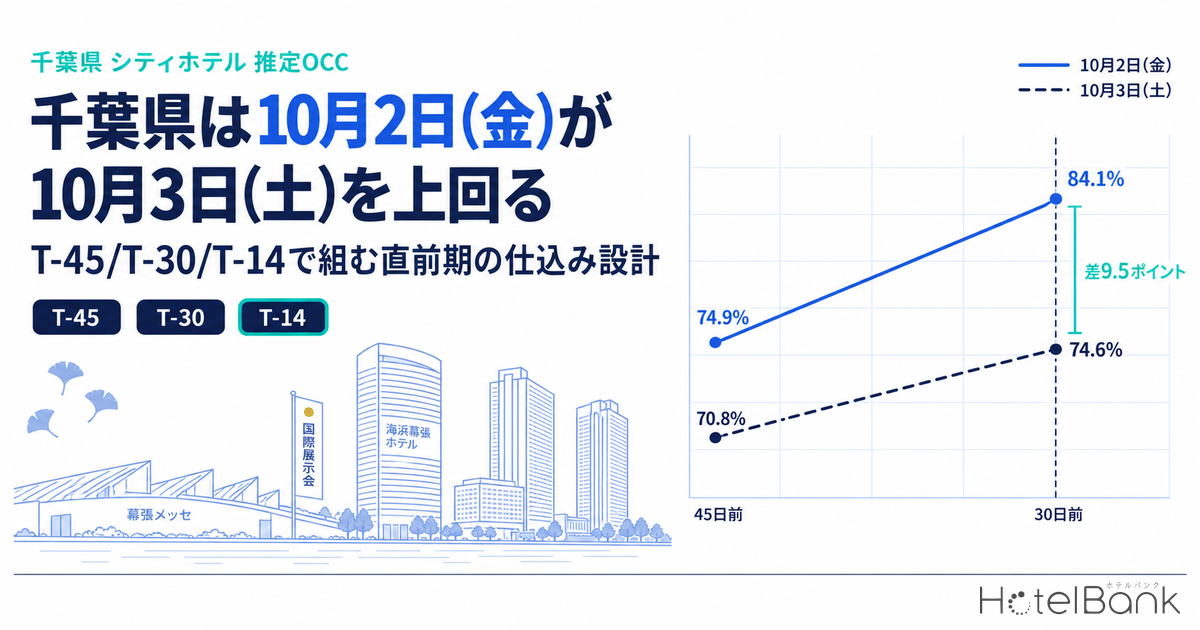
In Chiba Prefecture, the usual weekend roles have flipped for Friday, October 2 and Saturday, October 3, 2026. City-hotel estimated OCC (OTA-listed-inventory basis) stood at 74.9% for Friday versus 70.8% for Saturday 45 days before the stay date, with Friday already ahead, and by 30 days out the gap had widened to 9.5 points, at 84.1% versus 74.6%. For the most recent completed Friday–Saturday pair (Friday, September 4 and Saturday, September 5), Saturday had led Friday by 15.2 points at the same 45-days-out mark. In other words, the usual “Saturday leads the weekend” pattern is not holding this time. Using observed data alone, this article works out what to set up in the final stretch before arrival for three hotel types in Chiba (city, business and resort), using a T-45 / T-30 / T-14 countdown framework.
Coverage: city hotels (N=52 properties), business hotels (N=141 properties) and resort hotels (N=57–58 properties) in Chiba Prefecture. The price metric in this article is the settled ADR estimate (the transaction-price level estimated from OTA and other sales data, roughly tax-exclusive), and occupancy is an estimate on an OTA-listed-inventory basis. Both are defined at the end of the article. Data as of: September 8, 2026.
- — Friday beats Saturday: Chiba city-hotel estimated OCC was 74.9% for Friday, October 2 versus 70.8% for Saturday, October 3 at 45 days out. By 30 days out it was 84.1% versus 74.6%, a gap that had widened to 9.5 points.
- — The opposite of the reference pair: for the most recent completed pair, Friday, September 4 and Saturday, September 5, Saturday led Friday by 15.2 points at the same 45-days-out mark. The default weekend premium is not working this weekend.
- — The final 14 days’ share of pickup differs by date: in the reference pair, 60% of city-hotel Friday pickup came in the final 14 days, versus just 7% for city-hotel Saturday.
- — October 2 is heading toward full occupancy: applying the pickup actually recorded on the reference same-weekday dates, city hotels on October 2 reach 96.8% even in the downside case. At T-14 the question shifts from “filling rooms” to “protecting rate.”
- — Take the price yardstick from finalised months: the settled ADR estimate for Chiba city hotels was ¥10,700 in August 2026 (N=53; −9.5% YoY) and ¥11,277 in October 2025 (N=51). The October 2026 figure is on a different basis, so it should not be compared directly.
October 2 (Fri) outpaces October 3 (Sat): three hotel types from 45 days out to the latest observation
Start with the facts. The chart below plots estimated OCC for the three hotel types in Chiba Prefecture for the stay dates Friday, October 2 and Saturday, October 3, from 45 days before the stay date to the latest observation (25 days out for October 2 and 26 days out for October 3, both as of September 7). Solid lines are Friday; dashed lines are Saturday.
Source: MetroEngines Research; compiled by the HotelBank Editorial Team
The clearest case is city hotels. At 45 days out, Friday stood at 74.9% against 70.8% for Saturday, so Friday was already 4.1 points ahead. Over the following three weeks or so, Friday added +12.0 points to reach 86.9%, while Saturday added only +7.4 points to reach 78.2%, so the gap actually widened to 8.7 points. For business hotels, Friday was at 68.1% and Saturday at 69.7% at 45 days out, and 75.5% and 76.4% at the latest observation, a difference of only about 1 point between the two days. For resort hotels, Friday was at 73.9% and Saturday at 76.3% at 45 days out, and 79.5% and 81.0% at the latest observation. Saturday is slightly ahead, but here too the gap is only about 1.5 points.
What holds across all three types is that the assumption “it’s Saturday, so occupancy will be high” is not working this weekend. City hotels in particular show a full reversal, with Friday well above Saturday. Note that on some observation dates the number of properties captured temporarily dips, and the chart above excludes such thin observation dates (below 60% of target properties). All figures below are shown with the number of observed properties.
| Type / stay date | 45 days out | 30 days out | Latest | 45 days out → latest | Sell-out rate (latest) |
|---|---|---|---|---|---|
| City, Oct 2 (Fri) | 74.9% (N=49) | 84.1% (N=52) | 86.9% (N=51) | +12.0pt | 5.8% |
| City, Oct 3 (Sat) | 70.8% (N=51) | 74.6% (N=52) | 78.2% (N=51) | +7.4pt | 9.6% |
| Business, Oct 2 (Fri) | 68.1% (N=127) | 72.6% (N=125) | 75.5% (N=141) | +7.4pt | 7.8% |
| Business, Oct 3 (Sat) | 69.7% (N=134) | 73.8% (N=139) | 76.4% (N=141) | +6.7pt | 14.2% |
| Resort, Oct 2 (Fri) | 73.9% (N=54) | 79.3% (N=55) | 79.5% (N=57) | +5.6pt | 5.2% |
| Resort, Oct 3 (Sat) | 76.3% (N=55) | 80.1% (N=55) | 81.0% (N=56) | +4.7pt | 10.5% |
Latest = 25 days out for Oct 2 and 26 days out for Oct 3 (both observed September 7, 2026). N is the number of properties whose inventory could be confirmed on each observation date. Sell-out rate = the share (estimated) of properties with no listed inventory confirmable on OTAs or similar channels. Source: MetroEngines Research; compiled by the HotelBank Editorial Team
For demand context, Makuhari Messe (幕張メッセ) is scheduled to host the 17th Highly-functional Material Week (第17回 高機能素材Week) from Wednesday, September 30 to Friday, October 2, 2026, and 猛暑テック (Mosho Tech, an exhibition of heat-countermeasure technology) over the same September 30 – October 2 dates (Makuhari Messe official event information). Both close on the Friday and do not run into Saturday, October 3. The observed pattern, heavy on Friday and light on Saturday, is consistent with this event schedule.
Comparing with the most recent completed pair at the same days out, and what happened from T-14 onward
Whether the curve now in progress is “fast” or “slow” cannot be judged on its own. So we use as a yardstick the most recent Friday–Saturday pair whose stay dates have already passed and whose full observation window is complete: Friday, September 4 and Saturday, September 5. Comparing at equal days out brings the picture into focus. The same approach of aligning weekdays and reading at a common snapshot is used in Yamagata Hanagasa 2026: Demand Settled 45 Days Out.
City hotels on October 2 (Fri) stood at 84.1% at 30 days out. September 4 (Fri) was at 70.9% at the same 30 days out, so October 2 is running +13.2 points ahead. At the common 25-days-out snapshot it is 86.9% versus 72.0%, or +14.9 points. October 3 (Sat), meanwhile, was at 74.6% at 30 days out against 85.8% for September 5 (Sat) at the same snapshot, −11.2 points behind. At the latest snapshot (26 days out) it is 78.2% versus 87.0%, still −8.8 points. For business hotels, October 2 (Fri) was at 72.6% at 30 days out, almost level with the reference Friday’s 73.3% (−0.7 points). October 3 (Sat) was at 73.8% versus 82.0%, −8.2 points behind. For resort hotels, Friday is −1.5 points and Saturday −3.3 points, both below but by small margins. The weak leg of this weekend is consistently Saturday: that is the common read across all three types.
Next, look at how that reference pair built up from 45 days out to the day before arrival. This feeds directly into how T-14 should be designed.
Reference pair = stay dates Friday, September 4 and Saturday, September 5, 2026. Source: MetroEngines Research; compiled by the HotelBank Editorial Team
City hotels on September 4 (Fri) moved from 68.0% at 45 days out to 70.9% at 30 days out, 77.4% at 14 days out and 91.7% on the day before. Total pickup over the 45 days was +23.7 points, of which +14.3 points, fully 60%, came in the final 14 days. September 5 (Sat), by contrast, was already high at 83.2% at 45 days out, then 91.7% at 14 days out and 92.3% on the day before. Its total pickup was +9.1 points, and the final 14 days contributed only +0.6 points. Business hotels picked up +19.8 points on the Friday and +15.9 points on the Saturday, with the final 14 days contributing 38% in both cases. Resort-hotel Friday pickup was small at +6.7 points, but 87% of it was concentrated in the final 14 days.
In other words, in Chiba Prefecture the slower a date starts, the more it depends on the final 14 days, a structure observed regardless of hotel type. This time, October 2 (Fri) is running more than 13 points faster than the reference Friday, while October 3 (Sat) is 8–11 points slower than the reference Saturday. Within the same weekend, the moves to make in the final stretch point in opposite directions. T-14 for October 2 falls on Friday, September 18, and T-14 for October 3 on Saturday, September 19. Neither had arrived as of this article’s data date.
The range from the latest snapshot to the final result: applying the reference pair’s actual pickup
So far we have only laid out observed values. In practice, you also need a rough sense of where things are likely to land if the current trend continues. So we take how many points the reference pair (Fri Sep 4 / Sat Sep 5) actually picked up from the same days out to the day before arrival and apply that to the latest snapshot for October 2 and 3. This is not a forecasting model. It is a simple conversion that uses the actual results of the most recent completed same-weekday dates as a yardstick.
| Type / stay date | Latest estimated OCC | Reference same-weekday pickup (same snapshot → day before) |
Downside (half the pickup) |
Mid (equal pickup) |
|---|---|---|---|---|
| City, Oct 2 (Fri) | 86.9% (25 days out, N=51) | +19.7pt | 96.8% | Full-occupancy level (ceiling reached) |
| City, Oct 3 (Sat) | 78.2% (26 days out, N=51) | +5.3pt | 80.8% | 83.5% |
| Business, Oct 2 (Fri) | 75.5% (25 days out, N=141) | +11.4pt | 81.2% | 86.9% |
| Business, Oct 3 (Sat) | 76.4% (26 days out, N=141) | +9.6pt | 81.2% | 86.0% |
| Resort, Oct 2 (Fri) | 79.5% (25 days out, N=57) | +5.1pt | 82.0% | 84.6% |
| Resort, Oct 3 (Sat) | 81.0% (26 days out, N=56) | +6.8pt | 84.4% | 87.8% |
Reference estimate. Reference pair = the measured pickup for stay dates Friday, September 4 and Saturday, September 5, 2026 (city Friday: 72.0% at 25 days out → 91.7% on the day before). This does not guarantee the final result. Source: MetroEngines Research; compiled by the HotelBank Editorial Team
How to read it depends on the hotel type. For city hotels, October 2 (Fri) reaches 96.8% even in the downside case. If the same pickup as the reference Friday occurs, it would mathematically pin at the full-occupancy level, with inventory running out before demand does. In other words, T-14 for this date is a day for protecting rate, not for filling rooms. City-hotel October 3 (Sat), by contrast, only reaches 83.5% even in the mid case. Because the reference Saturday’s pickup was small (+5.3pt), there is little last-minute headroom to begin with. Within the same weekend, the issue on October 2 is rate, and on October 3 it is selling power.
Business hotels converge at around 86% in the mid case for both dates, and the Friday–Saturday gap stays under 1 point here too. Resort hotels come in at 84.6% / 87.8% in the mid case, with Saturday landing slightly higher. Note that this conversion depends on the results of a single reference pair and does not reflect circumstances specific to the week in question (event schedules, weather, groups). Treat the range as a rough guide with a margin, not as grounds for firm conclusions.
For context on market size, Chiba Prefecture, the focus of this article, has 750 properties and 50,128 rooms whose listed inventory can be tracked continuously. The OCC figures above are estimates that use as the denominator the properties (N) whose inventory could be confirmed for each hotel type on each observation date.
The price framework: monthly settled ADR estimates for Chiba Prefecture
We do not go down to day-of-week pricing. Before setting rates for the final stretch, however, you do need to know the monthly price range your hotel sits within. Below is the settled ADR estimate for Chiba city hotels, with years overlaid. All months of 2025 are finalised figures. For 2026, January–August are finalised, and September onward are estimates based on the current state of sales (dotted line).
Settled ADR estimate (roughly tax-exclusive). Source: MetroEngines Research; compiled by the HotelBank Editorial Team
Finalised figures for Chiba city hotels were ¥10,000 in June 2026 (N=52), ¥10,100 in July (N=53) and ¥10,700 in August (N=53). Year on year, June was +0.3%, July −8.2% and August −9.5%, so the summer months finished below the previous year. The first half, on the other hand, grew (January +19.6%, March +7.8%, May +10.9%), making 2026 a year of large month-to-month swings. Finalised August figures were ¥8,000 for business hotels (N=165; −1.8% YoY) and ¥20,600 for resort hotels (N=72; −10.7% YoY).
| Type | July 2026 (finalised, YoY) |
August 2026 (finalised, YoY) |
October 2025 (finalised) |
October 2026 (current estimate) |
|---|---|---|---|---|
| City hotels | ¥10,105 (N=53) −8.2% | ¥10,699 (N=53) −9.5% | ¥11,277 (N=51) | ¥12,002 (N=53) |
| Business hotels | ¥7,739 (N=163) −2.0% | ¥8,042 (N=165) −1.8% | ¥7,749 (N=161) | ¥10,386 (N=156) |
| Resort hotels | ¥17,276 (N=70) −2.7% | ¥20,646 (N=72) −10.7% | ¥15,751 (N=65) | ¥16,563 (N=67) |
Settled ADR estimate (roughly tax-exclusive). October 2026 is an estimate based on the current state of sales and is on a different basis from finalised figures. Source: MetroEngines Research; compiled by the HotelBank Editorial Team
The point that needs care here is how to treat the October 2026 figure. It is not a finalised figure but an estimate derived from what is currently being sold, and it is on a different basis from finalised figures. It should therefore not be compared directly with the finalised October 2025 figure; the month-end finalisation needs to come first. The yardsticks that are practically usable for final-stretch rate setting are the previous October’s finalised figures (city ¥11,300, business ¥7,700, resort ¥15,800) and the level of the most recent finalised month, August 2026 (¥10,700 / ¥8,000 / ¥20,600 respectively).
For revenue managers running city, business and resort hotels in Chiba: implications and an action plan
Four implications from an operator’s perspective
1. Drop the “weekend = Saturday leads” default, for this weekend only. In the reference pair of September 4 and 5, city-hotel Saturday led Friday by 15.2 points at 45 days out. For October 2 and 3, Friday led Saturday by 4.1 points, and the gap widened to 9.5 points by 30 days out. If you run rules that switch rates automatically by day of week, this weekend is set up with rate-ceiling headroom on the Friday side and room to push sales on the Saturday side. Make decisions on the occupancy snapshot, and do not treat the day-of-week price difference itself as a general rule.
2. Read your own pace against the most recent same weekday at the same days out. In the market, October 2 is +13.2 points faster than the reference Friday at the same snapshot, and October 3 is −11.2 points slower than the reference Saturday. Compare your own booking progress not as an absolute figure but against what the most recent completed same weekday recorded at the same days out, and your fast-or-slow call becomes more stable.
3. Hold the final 14 days’ share of pickup as a different number for each date. In the reference pair, 60% of city-hotel Friday pickup was concentrated in the final 14 days, versus only 7% for city-hotel Saturday. Business hotels were at 38% on both Friday and Saturday. Because slower-starting dates depend more on the final stretch, for a date like October 3 (Sat) that is behind the reference, decide by T-14 where to draw the line between inventory to hold and inventory to move.
4. Take price ceilings and floors from finalised months. The October 2026 estimate is based on the current state of sales and is on a different basis, so do not use it for a direct comparison with the previous year’s finalised figure. As a range yardstick, you will get a smaller margin of error by placing the previous October’s finalised figures and the August 2026 finalised figures at the two ends of the range and deciding your hotel’s position between them.
We translate the above into three stages: T-45 = the framework for inventory and rates, T-30 = channel allocation, and T-14 = handling remaining rooms. T-14 for October 2 is Friday, September 18, and T-14 for October 3 is Saturday, September 19. For an example of the same three-stage countdown framework applied to a holiday run, see Osaka Sep 2026 Holiday: Demand Peaks First 2 Nights.
| Stage | Action | Decision trigger (tied to figures in this article) | Aim |
|---|---|---|---|
| T-45 Inventory and rate framework | Treat Friday and Saturday as separate demand days and split the rate table by date | If the market snapshot at 45 days out shows a reversal (city: Friday 74.9%, Saturday 70.8%), drop blanket day-of-week rate settings | Prevent the weekend premium from being misapplied |
| T-45 | Revisit the release timing of group and block allotments: bring it forward on the Friday side and push it back on the Saturday side | If your Friday progress is below the market level at 45 days out (city 74.9% / business 68.1% / resort 73.9%) | Avoid locking up high-demand-date inventory too early |
| T-30 Channel allocation | On the Friday side, consider raising the share of direct and corporate allotments and limiting exposure on discount-dependent channels | If your Friday is in line with the market level at 30 days out (city 84.1%), prioritise checking for upside | Protect rate on high-progress dates |
| T-30 | On the Saturday side, widen exposure and add bundled products that do not drop rate, such as two-night (Fri–Sat) stays or meal-inclusive plans | If your Saturday is below the market level at 30 days out (city 74.6% / business 73.8% / resort 80.1%) | Fill with selling power before resorting to straight discounts |
| T-14 Handling remaining rooms | Fix Friday, September 18 and Saturday, September 19 as decision dates, and split remaining rooms into a “hold” block and a “move” block | For the reference Friday, 60% of pickup came in the final 14 days, versus 7% for the reference Saturday. Take the slower-starting dates to the move decision first | Structurally prevent decisions from being put off |
| T-14 | Set the floor price first, working back from monthly finalised levels, and run on the rule that no rate goes below it | Use the previous October’s finalised figures (city ¥11,300 / business ¥7,700 / resort ¥15,800) and the August 2026 finalised figures as the two bounds | Keep last-minute fire sales from eroding the monthly rate |
Source: MetroEngines Research; compiled by the HotelBank Editorial Team
None of these guarantees results, and whether they fit depends on each hotel’s demand mix, location and guest profile. What is presented here is a framework for translating market observations into your own hotel’s decision triggers.
Conclusion: three yardsticks to take away
Yardstick 1: Decide by snapshot, not by day of week. For Chiba city hotels, Saturday led Friday by 15.2 points at 45 days out on the September 4–5 weekend, whereas on October 2–3 Friday led Saturday by 4.1 points, widening to 9.5 points by 30 days out. Even the same “Friday and Saturday” is different every time.
Yardstick 2: Judge fast or slow against the same weekday at the same days out. October 2 (Fri) is +13.2 points above the reference Friday at the 30-days-out snapshot, and October 3 (Sat) is −11.2 points below the reference Saturday. Relative position, not the absolute figure, sets the direction of your moves.
Yardstick 3: Hold the final 14 days’ share of pickup for each date. In the reference pair it varied widely by date and hotel type: 60% for city Friday, 7% for city Saturday, 38% for business on both Friday and Saturday, and 87% for resort Friday. Fix T-14 as a decision date, and the higher a date’s share, the earlier you should draw the line on handling remaining rooms. If these three points become a fixed weekly check, final-stretch decisions become repeatable work.
About the Data
- Definition of estimated OCC: occupancy on an OTA-listed-inventory basis = 100 − 100 × rooms remaining on OTA listings ÷ total rooms. It is an estimate based on how inventory sold on OTAs is being taken up, and its definition differs from actual room occupancy (it reads higher). The target months in this article are September and October 2026 (stay-date basis).
- Booking curve: based on observations from 45 days before the stay date up to the most recent point.
- Definition of the settled ADR estimate: a transaction-price level (roughly tax-exclusive) estimated from OTA and other sales data (lowest-plan level × segment coefficient, ensembled across multiple channels). Past months are finalised figures; current and future months are estimates based on the current state of sales. Median error against published operating results is 6.6%.
- Breakdown of N: Chiba Prefecture city hotels N=52 properties (N=51–53 for the settled ADR estimate), business hotels N=141 properties (N=156–165 for the settled ADR estimate), resort hotels N=57–58 properties (N=65–72 for the settled ADR estimate). At each booking-curve snapshot, the number of properties whose inventory could be confirmed on that observation date is shown in the text and tables. Days on which observed properties fell below 60% of target properties are excluded from the charts.
- Sell-out rate: the share (estimated) of properties with no listed inventory confirmable on OTAs or similar channels.
- Data as of: September 8, 2026. Sales conditions and inventory move daily, so the figures in this article are a snapshot at the time of retrieval.
References and Sources
- Makuhari Messe, “17th Highly-functional Material Week” event information (dates: September 30 – October 2, 2026; International Exhibition Halls 1–8)
- Makuhari Messe event calendar
Related Reading
- Tokyo Game Show 2026: 4,532 Rooms in 3km, Occupancy +41.8pt at T-45
- Kaihin-Makuhari 1,000-Room ¥30bn Mixed-Use: Breakeven ADR ¥13,200
- Osaka Sep 2026 Holiday: Demand Peaks First 2 Nights, Sep 23 at 58.0%
- Yamagata Hanagasa 2026: Demand Settled 45 Days Out, +9.6pt vs Normal
- Saitama Business Hotels: Sat 77.2% vs Sun 70.1%, Gap Widens to 11pt
- Kyoto Day-of-Week OCC: Thursday 90.4% Edges Friday, May–Jul 2026