

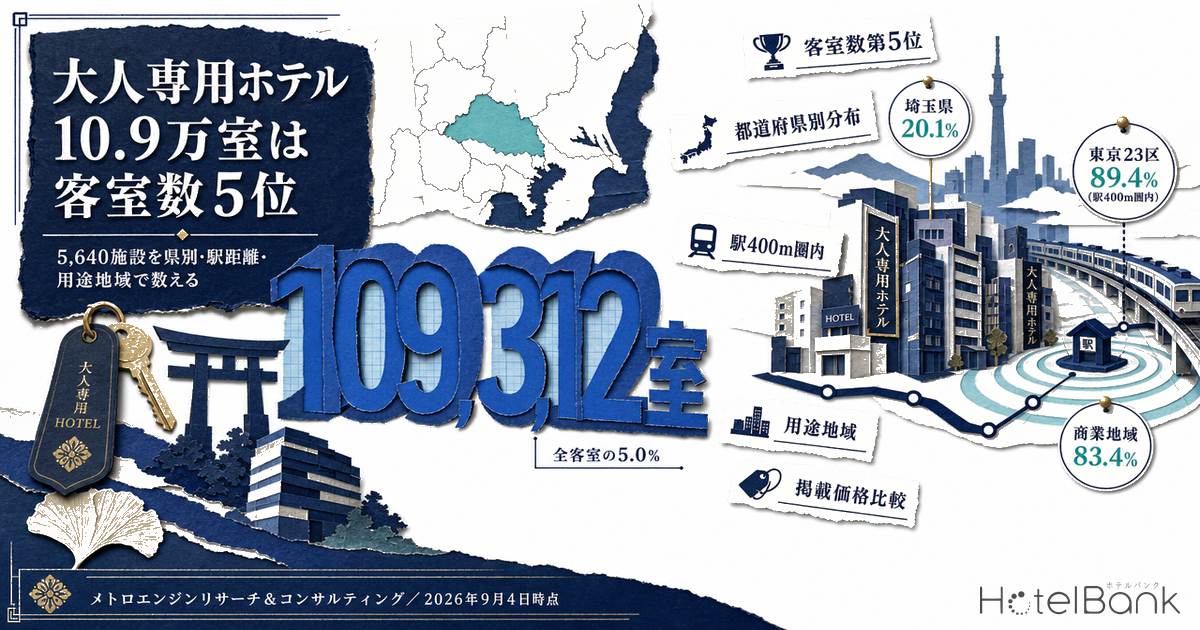
Count Japan’s lodging room stock by property type and a category that is rarely analyzed takes fifth place, behind business hotels, ryokan, city hotels and resort hotels. According to the Japanese lodging database maintained by MetroEngines Research & Consulting, properties classified as “adults-only” on OTAs total 5,640 properties and 109,312 rooms — 2.4 times the room count of capsule hotels (45,564 rooms) and 2.8 times that of deluxe hotels (39,591 rooms).
This article measures that room stock along six axes — scale, geographic distribution, rooms per property, listed price range, distance from the nearest station and zoning district — and sets out how it could connect to general lodging demand and which practical issues need checking before a conversion. It is written for investors considering acquisitions of existing stock, hotel operators looking for management contracts, and brokers structuring deals.
Metric Definitions and Population Used in This Article
- Definition of “adults-only”: One of the property classifications used on OTAs, covering properties listed as accepting adult guests only. The category mixes properties operating under a hotel/ryokan license under the Hotel Business Act in the same way as ordinary hotels, stay-focused properties with amenities such as spa baths and large TVs, and design-led leisure properties. Individual license types and business formats cannot be determined from OTA listing information. This article does not assess the nature of the category itself; its purpose is to count the scale and distribution of the room stock linked to this classification.
- Listed price (all-plan average): The average of the selling prices each property publishes on OTAs. Per-room rate for two guests sharing one room (tax included), covering all plans from room-only to meal-inclusive. This differs from actual transacted prices.
- Why we do not use estimated settled ADR: Our estimated settled ADR (a metric derived by applying property-type correction factors to listed prices and reconciling them with property-level disclosures by listed REITs) has been validated only for five property types: business, city, resort, ryokan and capsule. “Adults-only” is outside that validation, so every price comparison in this article is listed price versus listed price.
- Population: The Japanese lodging database maintained by MetroEngines Research & Consulting (77,804 properties and 2,167,728 rooms excluding deleted records, as of September 4, 2026). It is not a census but a de-duplicated database built starting from OTA listings, so properties that have never been listed on an OTA are not included. Property and room counts also include information as of registration and therefore do not match the number of properties currently operating (see below).
- Data sources: MetroEngines Research & Consulting / Ministry of Land, Infrastructure, Transport and Tourism (MLIT) Real Estate Information Library / Ministry of Health, Labour and Welfare (MHLW) “Report on Public Health Administration and Services”
- — 109,312 rooms, 5.0% of all rooms — The OTA “adults-only” category spans 5,640 properties and ranks fifth by room count: 2.4 times the stock of capsule hotels and 2.8 times that of deluxe hotels.
- — 20.1% of all rooms in Saitama — followed by Nara at 13.1% and Saga at 11.0%. Whether this layer is included shifts the baseline for a prefecture’s lodging supply by one-fifth.
- — 89.4% within 400m of a station in Tokyo’s 23 wards — above the 87.4% for business hotels. Of the 433 properties whose zoning district could be identified, 99.8% sit in districts where hotel/ryokan buildings are permitted.
- — Listed prices at 67–94% of same-prefecture business hotels — 93.6% in Kanagawa and 89.4% in Tokyo versus 66.8% in Fukuoka and 72.0% in Saitama. The wider the gap, the more room remains for rates to rise by ¥3,400–¥6,000.
- — Only 661 properties (16.3% of rooms) are visible — The remaining roughly 90,000 rooms do not appear as general lodging inventory on OTAs. Turning them into deals requires property-level checks of license type and building condition.
Fifth in Japan by Room Count — The Scale of a 109,312-Room Stock
Start with scale. Breaking Japan’s 77,804 properties and 2,167,728 rooms down by property type, the largest room counts are business hotels at 1,006,416 rooms, ryokan at 277,279, city hotels at 229,100 and resort hotels at 160,897 — followed by “adults-only” at 109,312 rooms. That is 5.0% of total room stock.
Placing this figure next to other industry benchmarks clarifies its weight. According to MHLW’s “Report on Public Health Administration and Services,” the number of rooms under hotel/ryokan business licenses under the Hotel Business Act was 1,739,124 (as of end-FY2020, the latest value in the annual series published on e-Stat). 109,312 rooms equals 6.3% of that. By property count, too, 5,640 properties ranks fifth, after ryokan (16,196), business hotels (11,059), vacation rentals (9,302) and minshuku guesthouses (8,572).
Source: MetroEngines Research & Consulting (N=77,804 properties, 2,167,728 rooms, as of September 4, 2026)
| Rank | Property type | Rooms | Properties | Rooms per property | Room share |
|---|---|---|---|---|---|
| 1 | Business hotel | 1,006,416 | 11,059 | 93.8 | 46.4% |
| 2 | Ryokan | 277,279 | 16,196 | 18.6 | 12.8% |
| 3 | City hotel | 229,100 | 1,400 | 163.8 | 10.6% |
| 4 | Resort hotel | 160,897 | 2,291 | 71.0 | 7.4% |
| 5 | Adults-only | 109,312 | 5,640 | 21.6 | 5.0% |
| 6 | Hostel | 54,726 | 3,625 | 15.5 | 2.5% |
| 7 | Minshuku (guesthouse) | 53,666 | 8,572 | 7.6 | 2.5% |
| 8 | Capsule hotel | 45,564 | 407 | 114.2 | 2.1% |
| 9 | Deluxe hotel | 39,591 | 222 | 179.1 | 1.8% |
“Rooms per property” uses only properties with a known room count as the denominator, so its denominator differs from the total property count in the same row. Source: MetroEngines Research & Consulting (Japan, excluding deleted records, as of September 4, 2026)
Not all 5,640 of these properties are currently on sale on OTAs, however. Limiting the count to properties whose recent listing status can be confirmed gives 661 properties and 17,841 rooms — just 11.7% by property count and 16.3% by room count. Confirmed-listing properties average 27.1 rooms against 21.6 for the category as a whole, suggesting that larger properties are more likely to also use OTA sales channels. Put the other way, the remaining roughly 90,000 rooms are room stock not currently visible as general lodging inventory on OTAs. That is the starting point for this article.
Geographic Distribution — 20.1% of Saitama’s Rooms; Top 8 Prefectures Hold 50%
Next, where are these 109,312 rooms? By property count, the leading prefectures are Tokyo (660), Osaka (363), Saitama (263), Kanagawa (262), Chiba (247), Fukuoka (232), Aichi (224) and Hokkaido (223). By room count the order is Tokyo 13,442, Osaka 9,087, Aichi 6,900, Kanagawa 6,261 and Saitama 5,729, with the top eight prefectures accounting for 50.2% of the national total.
How much weight does the category carry relative to each prefecture’s total lodging stock? Here the differences are large. As a share of total prefectural rooms in our database, Saitama stands out at 20.1%, followed by Nara 13.1%, Saga 11.0%, Ibaraki 10.3%, Aichi 9.7% and Kanagawa 9.6%. By contrast, prefectures with deep tourism stock score low: Hokkaido 3.0%, Kyoto 2.5%, Nagano 2.2% and Okinawa 1.2%. The pattern is that the category’s weight is highest in prefectures with a small absolute volume of tourist rooms that sit on access corridors to major metropolitan areas.
Saitama’s 20.1% is too large to ignore when working with the prefecture’s lodging stock. Its total hotel and ryokan rooms of 28,515 are relatively thin for the Tokyo metropolitan area, and 5,729 rooms sit on top of that. Whether this layer is included shifts the baseline for the prefecture’s overall lodging supply by one-fifth.
Circle size = room count; color intensity = share of prefectural room stock. Coordinates are the average location of the relevant properties in each prefecture. Source: MetroEngines Research & Consulting
Source: MetroEngines Research & Consulting (N=5,640 properties, 109,312 rooms)
| Prefecture | Properties | Rooms | Rooms per property | Share of prefectural rooms | Confirmed listings |
|---|---|---|---|---|---|
| Tokyo | 660 | 13,442 | 23.3 | 5.7% | 68 |
| Osaka | 363 | 9,087 | 26.6 | 6.3% | 120 |
| Aichi | 224 | 6,900 | 32.9 | 9.7% | 29 |
| Kanagawa | 262 | 6,261 | 25.5 | 9.6% | 31 |
| Saitama | 263 | 5,729 | 22.7 | 20.1% | 38 |
| Fukuoka | 232 | 4,893 | 23.1 | 7.0% | 46 |
| Chiba | 247 | 4,590 | 20.8 | 6.9% | 27 |
| Hyogo | 170 | 3,963 | 24.0 | 8.2% | 37 |
| Hokkaido | 223 | 3,698 | 18.9 | 3.0% | 19 |
| Shizuoka | 179 | 3,173 | 19.7 | 4.6% | 8 |
| Ibaraki | 170 | 2,993 | 20.1 | 10.3% | 6 |
| Miyagi | 126 | 2,428 | 21.7 | 7.0% | 7 |
| Gifu | 90 | 2,210 | 26.3 | 7.7% | 17 |
| Hiroshima | 120 | 2,147 | 20.4 | 5.8% | 12 |
| Gunma | 115 | 2,083 | 19.1 | 6.8% | 4 |
| Tochigi | 135 | 2,072 | 17.3 | 6.2% | 7 |
| Kyoto | 82 | 1,938 | 25.5 | 2.5% | 30 |
| Fukushima | 143 | 1,909 | 14.8 | 4.8% | 3 |
| Niigata | 112 | 1,874 | 17.8 | 4.5% | 2 |
| Okayama | 84 | 1,837 | 22.7 | 8.4% | 4 |
Top 20 prefectures by room count. “Confirmed listings” is the number of properties with a recently confirmed OTA listing. Source: MetroEngines Research & Consulting (as of September 4, 2026)
21.6 Rooms per Property — One-Quarter the Size of Business Hotels, Priced at 67–94% of Them
Scale per property defines the character of the stock. “Adults-only” properties average 21.6 rooms — just 23% of the 93.8 rooms of business hotels and 13% of the 163.8 rooms of city hotels. Splitting the 5,070 properties with known room counts into size bands, 10–19 rooms accounts for 41.8% and 20–29 rooms for 34.0%, so these two bands alone make up 75.8%. Extending to under 30 rooms brings the figure to 81.8%, and only two properties have 100 rooms or more.
Running the same breakdown for business hotels (10,734 properties with known counts) gives 36.8% at 100 rooms or more and 20.6% at 50–99 rooms — an entirely different size structure. Ryokan (14,892 properties with known counts) skew small, with 36.9% at 1–9 rooms and 36.8% at 10–19 rooms. “Adults-only” sits in a middle band concentrated in the 10–30 room range — larger than ryokan, smaller than business hotels.
Only properties with a known room count are included (adults-only N=5,070 / business hotels N=10,734 / ryokan N=14,892). Source: MetroEngines Research & Consulting
Now the price range. Comparing listed prices (two guests per room, tax included, all-plan average) for “adults-only” properties and business hotels on a three-month average for June–August 2026, when listed prices can be observed consistently, gives ¥14,600 vs ¥15,600 in Kanagawa (93.6%), ¥12,800 vs ¥14,300 in Aichi (89.6%) and ¥17,700 vs ¥19,800 in Tokyo (89.4%) — a gap of only around 10% in these three prefectures. The gap is wider in Fukuoka at ¥12,000 vs ¥18,000 (66.8%), Saitama at ¥10,000 vs ¥13,900 (72.0%) and Osaka at ¥10,700 vs ¥14,100 (76.1%).
In other words, in many areas the price range already overlaps with the business hotel band. In pursuing general lodging demand, the distance on price is already small. Viewed the other way, Fukuoka, Saitama and Osaka, where the gap is large, have a ¥3,400–¥6,000 range open up to the business hotel level in the same area, leaving upside on rate depending on facility standards and sales design.
Three-month average of listed prices for June–August 2026 (two guests per room, tax included, all-plan average). See the table below for the number of properties counted. Source: MetroEngines Research & Consulting
| Prefecture | Adults-only listed price | Properties counted | Business hotel listed price | Properties counted | Ratio | Gap |
|---|---|---|---|---|---|---|
| Kanagawa | ¥14,600 | 61 | ¥15,600 | 216 | 93.6% | ¥1,000 |
| Aichi | ¥12,800 | 71 | ¥14,300 | 327 | 89.6% | ¥1,500 |
| Tokyo | ¥17,700 | 150 | ¥19,800 | 990 | 89.4% | ¥2,100 |
| Osaka | ¥10,700 | 117 | ¥14,100 | 548 | 76.1% | ¥3,400 |
| Saitama | ¥10,000 | 56 | ¥13,900 | 151 | 72.0% | ¥3,900 |
| Fukuoka | ¥12,000 | 41 | ¥18,000 | 354 | 66.8% | ¥6,000 |
Properties counted are three-month averages. All comparisons are based on listed prices and differ from estimated settled ADR. Source: MetroEngines Research & Consulting
89.4% Within 400m of a Station in Tokyo’s 23 Wards — Locations on Par with Business Hotels
Location matters most in investment decisions. Using railway station data from the National Land Numerical Information obtained through the MLIT Real Estate Information Library, we calculated the straight-line distance from each property to its nearest station for Tokyo’s 23 wards (1,013 station points) and the Osaka City area (522 station points).
The results were clear. Of the 555 “adults-only” properties in Tokyo’s 23 wards, 36.9% are within 200m of the nearest station and 52.4% are 200–400m away, so 89.4% fall within 400m. The figure for the 1,183 business hotels in the same area is 87.4%: station proximity is essentially equal, and slightly higher. In the Osaka City area, the within-400m share for the 218 “adults-only” properties is lower at 68.0%, but reaches 90.4% when the radius is extended to 800m.
In short, a substantial part of this room stock already sits within a five-minute walk of a station in central urban areas — locations that are hard to secure for new development. Compared with new development that starts from land acquisition, the location itself is competitive. How far station distance affects rates is measured band by band in Station Premium Ends at an 8-Minute Walk: 8 Stations, 1,012 Hotels.
Straight-line distance to the nearest station. Tokyo 23 wards: adults-only N=555 / business hotels N=1,183. Osaka City area: adults-only N=218 / business hotels N=671. Source: Compiled by MetroEngines Research & Consulting from the MLIT Real Estate Information Library (station locations in the National Land Numerical Information passenger-by-station data)
Zoning districts were obtained from the same library. Among the 433 relevant properties in Tokyo’s 23 wards whose zoning district could be identified, 83.4% are in Commercial districts, 8.1% in Category I Residential, 5.1% in Neighborhood Commercial and 3.0% in Quasi-Industrial districts. The average floor-area ratio is 525%. The 837 business hotels show 78.5% in Commercial districts and an average floor-area ratio of 550% — almost the same zoning profile. The 131 relevant properties in the Osaka City area are more spread toward residential districts, with 59.5% in Commercial, 17.6% in Category II Residential and 16.0% in Quasi-Industrial districts.
Under Appended Table 2 of the Building Standards Act, hotel and ryokan uses may be built in Commercial, Neighborhood Commercial, Quasi-Industrial, Quasi-Residential and Category II Residential districts, and in Category I Residential districts if the floor area is 3,000 square meters or less. By this standard, 432 of the 433 properties (99.8%) with identified zoning in Tokyo’s 23 wards, and 129 of 131 (98.5%) in the Osaka City area, sit in zoning districts where hotel/ryokan buildings are permitted.
| Area / type | Commercial | Neighborhood commercial | Quasi-industrial | Residential | Avg. floor-area ratio | Properties identified |
|---|---|---|---|---|---|---|
| Tokyo 23 wards / Adults-only | 83.4% | 5.1% | 3.0% | 8.5% | 525% | 433 |
| Tokyo 23 wards / Business hotels | 78.5% | 10.3% | 5.1% | 5.5% | 550% | 837 |
| Osaka City area / Adults-only | 59.5% | 0.8% | 16.0% | 23.7% | 435% | 131 |
| Osaka City area / Business hotels | 90.5% | 1.7% | 2.5% | 5.3% | 575% | 402 |
Shares use as the denominator only properties whose zoning district could be identified by overlay with zoning polygons. Properties at the edges of the polygon coverage could not be identified and are excluded (122 adults-only and 346 business hotels in Tokyo’s 23 wards; 87 and 269 in the Osaka City area). Source: Compiled by MetroEngines Research & Consulting from the MLIT Real Estate Information Library (urban planning decision information: zoning districts)
Connecting to General, Long-Stay and Group Demand — Three Upsides
Combining the figures so far, the opportunities in this stock can be organized in three directions.
First, connection to general lodging demand. Listed prices already sit at 67–94% of business hotel levels, and in Tokyo’s 23 wards the within-400m-of-a-station share exceeds that of business hotels. On the two main factors of price and location, the distance to the general lodging market is small. In fact, the 661 properties with confirmed listings average 5.5 more rooms than the category as a whole, suggesting that sales channel diversification is progressing from the larger properties down. The same path is open to the remaining properties.
Second, long-stay and multi-night demand. Properties in this category often have in-room bathtubs, separate washbasins, large TVs and refrigerators, and rooms tend to be larger than standard business hotel rooms. They fit well with “stays where space and amenities take priority over rate” — extended stays by construction workers, bridge periods for employees relocating without family, and relocation demand. A size of 10–30 rooms is also easy to handle for whole-building corporate contracts or as a substitute for company housing.
Third, group and multi-guest demand. Rooms designed primarily for two guests can serve families and groups of friends when combined with extra beds or connecting-room operation. This is a segment that business hotels, built mainly around single and semi-double rooms, cannot fully capture, and it can act as a differentiation axis within the same area.
Common to all three directions is that using what is already built is faster than building new. Developing a 20-room lodging property in a central Commercial district within a five-minute walk of a station requires factoring in the lead time from land acquisition to opening and rising construction costs. Acquiring and renovating existing stock is an option that compresses both, and deserves a place in the comparison.
Three Rate Scenarios and Rate × Occupancy Sensitivity — Illustrative Ranges
Up to this point we have dealt only with observed figures. Here we set out, as illustrative cases starting from observed values, how wide a range the upsides in the previous section could represent in terms of rate. All of the following are mechanical calculations based on listed prices and do not represent the income or investment case of any individual property.
First, the attainable rate level. Defining the listed price of business hotels in the same prefecture as the ceiling (optimistic), maintaining the status quo as pessimistic, and the midpoint as the middle case, the ranges for the six prefectures are as follows.
| Prefecture | Pessimistic (status quo) |
Middle (gap halved) | Optimistic (same-prefecture business hotel level) |
Uplift in optimistic case |
|---|---|---|---|---|
| Kanagawa | ¥14,600 | ¥15,100 | ¥15,600 | +6.8% |
| Aichi | ¥12,800 | ¥13,550 | ¥14,300 | +11.7% |
| Tokyo | ¥17,700 | ¥18,750 | ¥19,800 | +11.9% |
| Osaka | ¥10,700 | ¥12,400 | ¥14,100 | +31.8% |
| Saitama | ¥10,000 | ¥11,950 | ¥13,900 | +39.0% |
| Fukuoka | ¥12,000 | ¥15,000 | ¥18,000 | +50.0% |
| Six-prefecture average | ¥12,967 | ¥14,458 | ¥15,950 | +23.0% |
Pessimistic and optimistic are the observed values in Table 4; middle is their midpoint. Properties counted are the same as in Table 4. Source: MetroEngines Research & Consulting
What stands out is that the range varies widely by prefecture. Kanagawa gains only +6.8% even in the optimistic case, leaving almost no upside on rate; conversely, occupancy and sales channel design matter more there than rate. Fukuoka (+50.0%), Saitama (+39.0%) and Osaka (+31.8%), on the other hand, have wide ranges, with large attainable upside depending on facility standards and sales design. The six-prefecture average goes from ¥12,967 today to ¥15,950 in the optimistic case, an uplift of +23.0%.
Next, we vary annual room revenue per room along two axes: rate and full-year occupancy. Because we have no validated actual occupancy figures for this category, we set a range of 50–90% as assumed full-year (annual average) occupancy (these are not actual values observed as of 2026). Rate steps match the ¥10,000–¥19,800 range observed in Table 7.
| Rate (per room, tax incl.) | Full-year occupancy 50% (assumption) | 60% | 70% | 80% | 90% |
|---|---|---|---|---|---|
| ¥10,000 | 182 | 219 | 256 | 292 | 328 |
| ¥12,000 | 219 | 263 | 307 | 350 | 394 |
| ¥14,000 | 256 | 307 | 358 | 409 | 460 |
| ¥16,000 | 292 | 350 | 409 | 467 | 526 |
| ¥18,000 | 328 | 394 | 460 | 526 | 591 |
Calculated mechanically as rate × full-year occupancy × 365 days. The shaded cell is the middle case (¥14,000 × 70%). Based on listed prices; actual transacted rates are normally below listed prices. Full-year occupancy is an assumption, not an observed value. Source: MetroEngines Research & Consulting estimates
The middle case (¥14,000 × 70% full-year occupancy, assumed) gives ¥3.58 million per room per year; applying the category’s average size of 21.6 rooms gives about ¥77 million per property. The pessimistic case (¥10,000 × 50% full-year occupancy) gives ¥1.82 million per room and about ¥39 million per property, while the optimistic case (¥18,000 × 90% full-year occupancy) gives ¥5.91 million per room and about ¥128 million per property — a 3.2x spread between the top and bottom (full-year occupancy of 50%, 70% and 90% are all assumptions, not observed actual values).
The width of this range is itself the key issue. Rates can be observed by prefecture as in Table 7, but occupancy cannot be observed for this category. In evaluating an acquisition or management contract, where the occupancy assumption can be set moves the outcome far more than the attainable rate upside. That also sets the priorities for property-level due diligence.
Practical Checkpoints for Conversion — Licensing, Zoning, Front-Desk Requirements and Listing Category
This section organizes the issues worth checking in advance when considering an acquisition or management contract. What follows summarizes the general regulatory framework; individual deals require confirmation with the competent public health center, local government and professional advisers. Since the regulatory amendments of 2018, a ryokan business license can also be obtained for properties with very small room counts, down to a single room.
| Checkpoint | Details | What the data shows |
|---|---|---|
| Business license type | Whether the property holds a “hotel/ryokan business” license under the Hotel Business Act, or operates as a notified facility under the Act on Control and Improvement of Amusement Business, etc., determines whether it can switch to general lodging and what procedures apply. The type cannot be determined from OTA listing information, so on-site verification through the property register, license certificate and inquiries to the public health center is essential. | Both types coexist within the category. Property-level verification is a prerequisite. |
| Zoning and buildability | Under Appended Table 2 of the Building Standards Act, hotels and ryokan may be built in Commercial, Neighborhood Commercial, Quasi-Industrial, Quasi-Residential and Category II Residential districts. Category I Residential districts are subject to a limit of 3,000 square meters of floor area. Category I and II Medium-to-High-Rise Exclusive Residential districts, Industrial districts and others are excluded, and buildings there may be treated as legally non-conforming existing structures. | Of the 433 properties identified in Tokyo’s 23 wards, 99.8% sit in zoning districts where the use is permitted. |
| Front desk (reception) requirements | Under the amended Hotel Business Act effective June 2018, a physical front desk is no longer mandatory if ICT equipment serving as a substitute for the reception function is installed. Requirements include proper identity verification, monitoring of entry and exit and key handover, and a system allowing staff to arrive in roughly 10 minutes in an emergency. Local ordinances may impose additional standards. | High compatibility with small-scale stock designed for unstaffed or low-staff operation. |
| Room configuration and renovation scope | A structure with large rooms and full bathrooms in every room may allow conversion to general lodging without major layout changes. On the other hand, refreshing the exterior, signage, common areas and bedding configuration becomes a major branding investment item. | 21.6 rooms per property; 81.8% concentrated in the under-30-room bands. |
| Building age and equipment renewal | Acquisition due diligence checks seismic performance according to the year of completion, the remaining useful life of plumbing and HVAC equipment, and whether renovation triggers survey obligations. Renovation cost estimates swing widely depending on these assumptions. | An issue common to all existing stock. |
| Sales channels and listing category | Selling as general lodging requires redesigning the property classification, listing category, photo set and plan design for general lodging. Because search exposure and comparison sets change, pricing should be reviewed at the same time. | Listings confirmed for only 661 of 5,640 properties (11.7%). |
Descriptions of regulations summarize the general framework and do not constitute a judgment on any individual deal. Sources: MHLW “Hotel Business” page; Building Standards Act, Appended Table 2; MetroEngines Research & Consulting
Conclusion — Should the 109,312 Rooms Count in Supply Assumptions?
To summarize the facts counted in this article: the room stock linked to the OTA “adults-only” classification totals 5,640 properties and 109,312 rooms, fifth in Japan by room count and 5.0% of all rooms. Geographically, it accounts for 20.1% of rooms in Saitama, 13.1% in Nara and 11.0% in Saga; in Tokyo’s 23 wards 89.4% of properties are within 400m of a station, and 99.8% of properties with identified zoning sit in districts where hotel/ryokan buildings are permitted. Listed prices are 67–94% of same-prefecture business hotels and overlap with them in many areas.
This scale and these locations affect the assumptions used to estimate an area’s lodging supply. Reading supply and demand by stacking up only the new-opening pipeline leaves an already-built stock on the order of 100,000 rooms out of view. The perspective of measuring new supply against existing stock is also tested ward by ward in Tokyo 23 Wards Supply Pressure 2026. Conversely, for those considering acquisitions or management contracts for existing stock, here is an option to secure central Commercial-district locations within a five-minute walk of a station with a shorter lead time than new development.
At the same time, OTA listings can be confirmed for only 661 of the 5,640 properties. This gap means both that unseen inventory exists and that deals cannot be formed without on-site verification of each property’s license type, building condition and owner intentions. The macro figures show the outline of the opportunity; what lies beyond is property-by-property work.
Methodology and sources: Property and room counts aggregate the Japanese lodging database maintained by MetroEngines Research & Consulting (excluding deleted records, as of September 4, 2026) by property type classification. The database is built starting from OTA listings and is not a census. Room counts are database-registered values; properties with unknown room counts (570 adults-only properties) are excluded from average calculations. Listed prices are three-month averages for the actual months of June–August 2026, a period selected for stable sample sizes. Station distance and zoning use the National Land Numerical Information and urban planning decision information from the MLIT Real Estate Information Library, calculated only for Tokyo’s 23 wards and the Osaka City area. Descriptions of regulations are general summaries based on published materials and do not assess the legality of any individual deal.
Related Articles
- Department Store Sites: 6 of 14 Go Hotel, ADR Needs 1.4-3.1x Market
- Station Premium Ends at an 8-Minute Walk: 8 Stations, 1,012 Hotels
- Tokyo 23 Wards Supply Pressure 2026: Arakawa 16.0%, Minato Just 4.5%
- Japan’s Pre-1981 Hotel Stock: 236k Rooms, 19.1% — Retrofit or Rebuild
- 98,338 Lodging Facilities: 30 of 47 Prefectures Lost Rooms in FY2024
References and Sources
■ Data Sources
Property and room counts aggregate the Japanese lodging database maintained by MetroEngines Research & Consulting (77,804 properties and 2,167,728 rooms excluding deleted records, as of September 4, 2026) by property type classification. Listed prices are three-month averages for June–August 2026 (two guests per room, tax included, all-plan average; the area median of each property’s daily average, averaged by month). Station distance and zoning overlay property coordinates with the National Land Numerical Information (station locations from railway station data) and urban planning decision information (zoning districts) from the MLIT Real Estate Information Library, limited to Tokyo’s 23 wards and the Osaka City area. National figures for the hotel business are from MHLW’s “Report on Public Health Administration and Services” (e-Stat statistical table ID 0004026910).
■ Calculation Assumptions
Rooms per property is calculated using only properties with known room counts as the denominator (adults-only N=5,070, business hotels N=10,734, ryokan N=14,892), so the denominator differs from the total in the property count column. The rate scenarios in Table 7 define the listed price of business hotels in the same prefecture as the ceiling (optimistic), the status quo as pessimistic, and the midpoint as the middle case. The two-axis sensitivity in Table 8 is an illustrative case mechanically calculating annual room revenue per room as rate × occupancy × 365 days; because we hold no validated actual occupancy figures for this category, a range of 50–90% is set as assumed full-year (annual average) occupancy. Per-property conversion uses the average of 21.6 rooms.
■ Limitations and Caveats
The population is a de-duplicated database built starting from OTA listings and is not a census. Properties that have never been listed on an OTA are excluded, and because property and room counts include information as of registration, they do not match the number of properties currently operating. “Adults-only” is an OTA listing classification and does not indicate the business license type under the Hotel Business Act or the actual business format. Because this category is outside the validation scope of our estimated settled ADR, all price comparisons are between listed prices, and actual transacted rates are normally below listed prices. Tables 7 and 8 are mechanical illustrative cases based on listed prices and do not represent the income or investment case of any individual property. Zoning shares use only properties identified within the polygon coverage as the denominator; properties at the edges of the coverage are excluded. Descriptions of regulations are general summaries based on published materials and do not assess the legality of any individual deal.
■ Market Data
- MetroEngines Research & Consulting — Property and room counts by property type from the Japanese lodging database (N=77,804 properties, 2,167,728 rooms, as of September 4, 2026), distribution by prefecture, listed prices (June–August 2026)
■ Government Statistics and Public Data
- MLIT Real Estate Information Library (不動産情報ライブラリ) — Urban planning decision information (zoning districts); National Land Numerical Information (station locations from passenger-by-station data)
- e-Stat, Portal Site of Official Statistics of Japan: “Report on Public Health Administration and Services” (衛生行政報告例) — Number of hotel business establishments (annual), properties and rooms under hotel/ryokan business licenses (statistical table ID: 0004026910)
- MHLW “Hotel Business” page (旅館業のページ) — Business categories under the Hotel Business Act, structural and equipment standards, requirements for ICT equipment substituting for a reception desk
■ Regulatory and Practical References
- MHLW notice on the enforcement of the Cabinet Order partially amending the Order for Enforcement of the Hotel Business Act (Japanese)
- Tanseisha “Ba to Hito” — Definition of conversion hotels and domestic case studies (Japanese)
- How to tell which properties can be converted to hotels: points to check before acquisition (Property Partners, Japanese)
- Hotel business facilities up 5.2% to 98,338 as tourism recovers — FY2024 Report on Public Health Administration and Services (Japanese)