

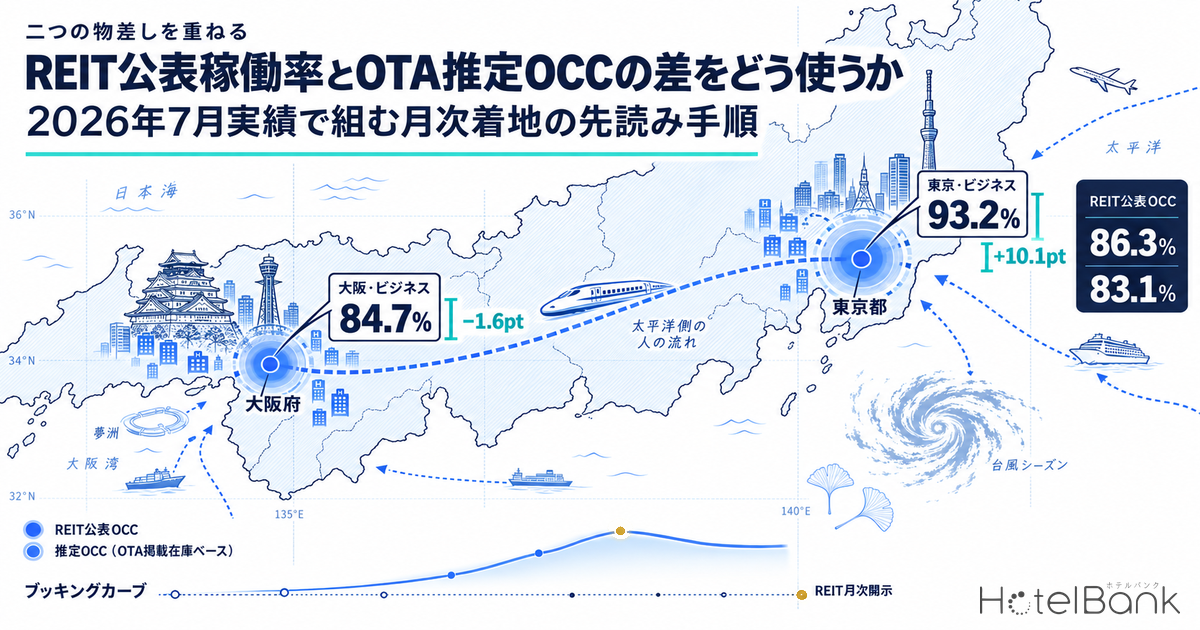
The July 2026 results are in. Three listed hotel REITs reported occupancy of 83.1–86.3%, while occupancy for the same month estimated from OTA and other listed inventory came in at 93.2% for business hotels in Tokyo (N=862 properties) and 84.7% for business hotels in Osaka (N=449 properties). The two measures sit as much as 10.1 points apart, but this is not a case of one of them being wrong. They are two yardsticks with different denominators, and what matters to a revenue manager is not the size of the gap itself but whether the gap is stable. REIT monthly figures come out in the second half of the month after the stay month. This article uses real data to build a procedure for forecasting your own hotel’s monthly landing with OTA-based estimated OCC, which moves 6–8 weeks earlier.
Scope: city hotels and business hotels in Tokyo and Osaka, N=100, 862, 91 and 449 properties (as of July 2026), plus reported results from three REITs. Price metrics in this article are estimated settled ADR (the settled price level estimated from OTA and other sales data, tax-exclusive equivalent); occupancy is an estimate based on OTA-listed inventory. Definitions are given at the end of the article. Data as of: September 9, 2026.
- — Three REITs reported July 2026 occupancy of 83.1–86.3%; estimated OCC based on OTA-listed inventory for the same month was 84.7–93.2%. The gap between the two ranges from −1.6 to +10.1 points.
- — The size of the gap is determined by area × hotel type, and even within the same segment it moves 2.2–3.5 points over four months. No single company-wide correction factor works; hold it as a range over the most recent 3–4 months.
- — REIT-reported ADR YoY was −1.0% to +0.1%, while estimated settled ADR for the same month was −5.3% for Tokyo business hotels and −31.9% for Osaka business hotels. Change the population and both the sign and the magnitude change.
- — REIT monthly disclosures come out in the second half of the month after the stay month. A booking curve shows progress from 45 days before the stay date, letting you act 6–8 weeks before actuals arrive.
- — Pickup over the 15 days from 45 to 30 days out was +3.7pt for Tokyo city hotels and +4.6pt for Osaka business hotels (median). Benchmark your own hotel’s pickup over the same window against these.
July 2026: Results Reported by Three REITs
Start with the actuals. Only a limited number of listed hotel REITs publish monthly operating results (OCC, ADR, RevPAR). Here we take three that have already published July 2026 figures and focus mainly on limited-service hotels, quoting the values exactly as they appear in the published materials. Nothing has been rounded or converted.
The key point is that the three sets of figures do not refer to the same population. The scope labels each company uses in its published materials are shown in the table below, and both property counts and hotel-type mix differ. Any averaging such as “hotel REIT occupancy in July was around 84%” loses its meaning at this point.
| Investment corporation | Scope in published materials | OCC | ADR | RevPAR | YoY (as reported) |
|---|---|---|---|---|---|
| Invincible Investment Corporation (インヴィンシブル投資法人, 8963) | 101 domestic hotels | 86.3% | ¥15,100 | ¥13,039 | OCC +1.9 / ADR −1.0% / RevPAR +1.2% |
| Ichigo Hotel REIT Investment Corporation (いちごホテルリート投資法人, 3463) | Entire portfolio | 84.4% | ¥9,684 | ¥8,175 | OCC −0.7 / ADR −0.8% / RevPAR −1.6% |
| Japan Hotel REIT Investment Corporation (ジャパン・ホテル・リート投資法人, 8985) | 29 hotels with variable rent, etc. (total) | 83.1% | ¥21,806 | ¥18,119 | OCC +4.0 / ADR +0.1% / RevPAR +5.1% |
July 2026 results. Source: Invincible Investment Corporation, Monthly Operating Results / Ichigo Hotel REIT Investment Corporation, Monthly Operating Results / Japan Hotel REIT Investment Corporation, Monthly Results (each company’s reported figures quoted as-is)
8963 discloses its absolute figures on a “101 domestic hotels” basis. Its reported YoY change (OCC +1.9) does not match the simple difference (+1.8 points) from the 84.5% shown alongside it for the prior-year month. This is because the absolute figures and the YoY figures reference different property-count bases, so even within the same document you need to read the “population behind the absolute figures” and the “population behind the YoY figures” separately. 8985’s “29 hotels with variable rent, etc.” is an aggregate line carved out by rent scheme, not the whole portfolio. 3463 is labeled “entire portfolio,” and its ADR level of ¥9,684 suggests the portfolio is centered on limited-service hotels, mainly in regional markets.
The Same July, Seen Through Estimated OCC Based on OTA-Listed Inventory
Next, the leading indicator. Occupancy for July 2026 estimated from how OTA and other listed inventory was absorbed came to 92.6% for city hotels in Tokyo (N=100 properties / 32,712 rooms), 93.2% for business hotels in Tokyo (N=862 properties / 125,706 rooms), 89.6% for city hotels in Osaka (N=91 properties / 24,219 rooms), and 84.7% for business hotels in Osaka (N=449 properties / 72,951 rooms). All are based on listings on major booking sites.
It should be made clear here that this estimated OCC is not the actual room occupancy rate. It is defined as “100 − (listed rooms remaining ÷ total rooms) × 100,” and the listed inventory that serves as the denominator does not match the actual total room count. Inventory not listed on OTAs and similar channels — direct bookings, corporate contracts, group blocks — enters neither the denominator nor the numerator, and if a property deliberately narrows its listed allotment, remaining rooms fall and estimated OCC rises. It is a metric that structurally runs higher than actual occupancy, and it needs to be used with the understanding that it is a figure designed to be something different from REIT-reported OCC in the first place.
July 2026. The three REIT bars are each company’s reported figures; the four bars on the right are estimated OCC based on OTA-listed inventory. Source: Monthly disclosures of each investment corporation; compiled by the HotelBank Editorial Team from MetroEngines Research data
The gaps are summarized in the table below. Using 8963 (101 domestic hotels) as the baseline, Tokyo business hotels are 6.9 points higher and Tokyo city hotels 6.3 points higher. Osaka business hotels, on the other hand, are 1.6 points lower. Using 8985 (29 hotels with variable rent, etc.) as the baseline widens the Tokyo business hotel gap to +10.1 points. Simply changing which REIT is used as the baseline moves the gap anywhere from −1.6 to +10.1 points, so it is not possible to hold a single company-wide correction factor such as “REIT + X points.”
| Estimated OCC (July 2026) | Estimated OCC | vs. 8963 (86.3%) |
vs. 3463 (84.4%) |
vs. 8985 (83.1%) |
|---|---|---|---|---|
| Tokyo, city hotels (N=100 properties / 32,712 rooms) | 92.6% | +6.3pt | +8.2pt | +9.5pt |
| Tokyo, business hotels (N=862 properties / 125,706 rooms) | 93.2% | +6.9pt | +8.8pt | +10.1pt |
| Osaka, city hotels (N=91 properties / 24,219 rooms) | 89.6% | +3.3pt | +5.2pt | +6.5pt |
| Osaka, business hotels (N=449 properties / 72,951 rooms) | 84.7% | −1.6pt | +0.3pt | +1.6pt |
Source: Monthly disclosures of each investment corporation; compiled by the HotelBank Editorial Team from MetroEngines Research data
So what is estimated OCC for? The answer is comparing shape, not level. The chart below shows monthly estimated OCC from April through August 2026. The two Tokyo segments — city and business alike — step down in June and then decline gradually into August, while Osaka dips sharply in June and recovers in July: clearly different shapes. Osaka business hotels fell 5.0 points from 86.7% in May to 81.7% in June, then recovered to 84.7% in July. Tokyo business hotels over the same stretch went 94.7% → 92.7% → 93.2%, a swing less than half as large. The very fact that segments do not move in the same direction in the same month is itself useful information in practice.
Monthly estimated OCC, April–August 2026 (based on OTA-listed inventory). N = about 100 Tokyo city / 815–871 Tokyo business / 91–92 Osaka city / 447–453 Osaka business properties. Source: compiled by the HotelBank Editorial Team from MetroEngines Research data
How Much Does the Gap Move from Month to Month?
So far we have looked at a single snapshot: July 2026. But whether the gap is usable in practice depends on whether it stays stable across months. Here we line up four months of gaps using 8985 as the baseline, since its scope is explicitly stated as “29 hotels with variable rent, etc. (total)” and its monthly series runs continuously.
| Area × hotel type (gap vs. 8985) | Apr 2026 |
May | Jun | Jul | 4-month range |
4-month average |
|---|---|---|---|---|---|---|
| Tokyo, city hotels | +8.2 | +10.3 | +11.5 | +9.5 | 3.3pt | +9.9pt |
| Tokyo, business hotels | +8.0 | +10.7 | +11.5 | +10.1 | 3.5pt | +10.1pt |
| Osaka, city hotels | +4.0 | +6.4 | +6.3 | +6.5 | 2.5pt | +5.8pt |
| Osaka, business hotels | +0.6 | +2.7 | +0.5 | +1.6 | 2.2pt | +1.4pt |
Gap = estimated OCC (based on OTA-listed inventory) − reported occupancy. The REIT’s reported occupancy was 85.8% in April, 84.0% in May, 81.2% in June and 83.1% in July 2026. Source: Japan Hotel REIT Investment Corporation, Monthly Results; compiled by the HotelBank Editorial Team from MetroEngines Research data
Two things stand out. First, the gap is not a fixed value. The four-month range was 3.3 points for Tokyo city hotels, 3.5 points for Tokyo business hotels, 2.5 points for Osaka city hotels and 2.2 points for Osaka business hotels, and in all four segments the gap was widest in June. In the month when the REIT’s occupancy fell to 81.2%, estimated OCC based on OTA-listed inventory did not fall by the same amount. Apply a correction factor measured at a single point to the following month as-is, and you will be off by roughly this range.
Second, the ranking holds. The order — the two Tokyo segments > Osaka city > Osaka business — is the same in all four months; the only swap is between Tokyo city and Tokyo business. In other words, while the level of the correction factor moves month to month, the band your hotel falls into is hard to shift. When you start keeping your own records, the practical approach is to hold the gap as a range over the most recent 3–4 months rather than as a single fixed value. The “stability of the gap” mentioned earlier does not mean the value doesn’t move; it means the range within which it moves is predictable.
Note that this article does not cover YoY comparisons of estimated OCC against our own prior-year data. The time series is less than two years long, and observation conditions for the prior-year month are not comparable. The YoY axis is built from REIT-reported figures and from comparisons of finalized months of estimated settled ADR, discussed below.
ADR YoY: Change the Population and Both Sign and Magnitude Change
After occupancy comes ADR. The three REITs’ reported ADR YoY for July 2026 was −1.0% for 8963, −0.8% for 3463 and +0.1% for 8985 — all readable as “roughly flat.” Look at the same July through estimated settled ADR (finalized values) by area × category, however, and a completely different picture emerges.
| Area × category | July 2026 Estimated settled ADR (finalized) |
July 2025 Estimated settled ADR (finalized) |
YoY |
|---|---|---|---|
| Tokyo, city hotels | ¥22,434 (N=107) | ¥27,055 (N=107) | −17.1% |
| Tokyo, business hotels | ¥12,306 (N=913) | ¥12,990 (N=902) | −5.3% |
| Osaka, city hotels | ¥12,582 (N=97) | ¥16,798 (N=90) | −25.1% |
| Osaka, business hotels | ¥8,429 (N=497) | ¥12,380 (N=502) | −31.9% |
All comparisons are between finalized months (tax-exclusive equivalent). Source: compiled by the HotelBank Editorial Team from MetroEngines Research data
The two Osaka segments show declines of more than 20% because the comparison month, July 2025, fell during the Expo 2025 Osaka, Kansai (held April 13 – October 13, 2025, with more than 29 million total visitors). A YoY figure built on a base year with special demand needs to be read not by the size of the decline itself, but by whether rates have “returned to pre-boom levels or fallen below them.” For Tokyo too, the city hotel segment (N=107 properties) is easily affected by the mix of upper-price-tier properties, so the −5.3% for the business hotel segment (N=913 properties) is closer to the temperature of the market as a whole.
How the post-Expo rebound in Osaka deepened month by month is broken down in Osaka Settled ADR June 2026: City -26.3%, Business -32.8% Post-Expo.
The practical implication here is clear. A REIT’s reported “roughly flat” ADR YoY cannot be used as a proxy for the YoY trend in your own hotel’s area × category. REIT portfolios are spread nationwide across mixed hotel types, and the three REITs in this article each carry a different population label. To evaluate your own hotel’s ADR YoY, the reference should be “a group in the same prefecture, the same hotel type and a similar price tier” — not the average of a listed portfolio.
Reconciling REIT-disclosed ADR against market-estimated ADR is most useful when done over a longer window, such as a full half-year, rather than a single month.
An Indicator That Moves 6–8 Weeks Ahead of REIT Results — Fixed-Point Booking Curve Tracking
REIT monthly disclosures come out in the second half of the month after the stay month. All three REITs published their July 2026 figures on August 25–27. In other words, actuals become available roughly eight weeks after the month’s operations have ended — far too late to change that month’s landing.
A booking curve, by contrast, shows progress through observations from 45 days before the stay date up to the most recent point. The chart below shows the cumulative trend in estimated OCC for city hotels in Tokyo (N=100 properties / 32,712 rooms) for stay dates of Friday, September 18, Friday, September 25 and Friday, October 2, 2026. All three curves rise almost in parallel, and their ranking at 45 days out carries straight through to the ranking at the latest observation.
Tokyo city hotels, N=100 properties / 32,712 rooms (based on listings on major booking sites). Based on observations from 45 days before the stay date to the most recent point. Source: compiled by the HotelBank Editorial Team from MetroEngines Research data
Sampled at fixed points, the data looks like the table below. Looking at just three points — 45 days out, 30 days out and the latest observation — is enough to read the pattern of progress.
| Stay date (Friday) | Tokyo city 45 days out |
Tokyo city 30 days out |
Tokyo city Latest |
Osaka business 45 days out |
Osaka business 30 days out |
Osaka business Latest |
|---|---|---|---|---|---|---|
| September 18, 2026 | 79.1% | 82.2% | 87.4% | 58.5% | 62.7% | 70.7% |
| September 25, 2026 | 81.1% | 85.2% | 88.1% | 63.2% | 67.1% | 72.5% |
| October 2, 2026 | 81.2% | 85.7% | 88.4% | 61.5% | 66.5% | 69.2% |
| October 9, 2026 | 83.6% | 86.8% | — | 63.7% | 69.1% | — |
| October 16, 2026 | 86.7% | — | — | 66.9% | — | — |
“Latest” is the most recent observation as of September 9, 2026. Tokyo city N=100 properties; Osaka business N=454–456 properties (based on listings on major booking sites). Based on observations from 45 days before the stay date to the most recent point. Source: compiled by the HotelBank Editorial Team from MetroEngines Research data
Pickup over the 15 days from 45 to 30 days out was +3.1 to +4.5 points for Tokyo city hotels (median across the four dates: +3.7 points) and +3.9 to +5.4 points for Osaka business hotels (median: +4.6 points). Although Tokyo’s curves sit 18–21 points higher in absolute terms, pickup over this window is actually larger in Osaka. Level and slope are separate pieces of information, and when checking your own hotel’s progress against the market, the two need to be looked at separately.
How this 45→30-day pickup is distributed nationwide is laid out in Booking Curves Across 47 Prefectures: +4.1pt Median Pickup from T-45 (median across the 47 prefectures: +4.1 points). The +3.7 / +4.6 points in this article sit at a standard level within that distribution.
One more property of this indicator worth noting is how the number of observed properties changes. Taking Tokyo city hotels for September 18, 2026 as an example, 99 properties were observed at 45 days out and 100 at 30 days out, but the latest observation (9 days out) covers just 23 properties. For Osaka business hotels, too, 450 properties were observed at 45 days out versus 103 at the latest observation. The closer you get to the stay date, the fewer properties are being observed at that point. Rather than taking the latest single point and treating it as the level of the market as a whole, it is more robust to read it as a “difference” against the 45-day and 30-day fixed points, where the observed property counts are thick.
For Revenue Managers Running City and Business Hotels in Tokyo and Osaka — Implications and Action Plan
(a) Operational insights
1. REIT-reported OCC is not a “target for your hotel,” but it can be the baseline for building “your own correction factor.” As of July in this article, estimated OCC was +6.9 points for Tokyo business hotels and −1.6 points for Osaka business hotels against 8963’s 86.3% — not even in the same direction. What you should do here is not try to match the level, but record each month the gap between your hotel’s monthly actuals (the actual OCC in your own PMS) and the estimated OCC for your hotel’s area × category, and find out at how many points that gap stabilizes. As long as the gap is stable, you can work backward from next month’s estimated OCC to your hotel’s landing range.
2. REIT YoY is “the industry’s temperature,” not “your area’s temperature.” While the reported ADR YoY for all three REITs falls within −1.0% to +0.1%, estimated settled ADR on a finalized basis was −5.3% for Tokyo business hotels and −31.9% for Osaka business hotels. The average of a nationally diversified portfolio is not a yardstick for judging whether your hotel’s pricing is appropriate. If you cite an external benchmark in internal reporting, it only becomes meaningful once you also state the population label (how many properties, which hotel types, which areas).
3. In Osaka, check the “quality of the base” for YoY first. Osaka’s estimated settled ADR for July 2026 was down 31.9% YoY (business hotels), but the comparison month, July 2025, fell during the Expo. Don’t use the YoY figure on its own either to explain a budget shortfall or as evidence of a demand downturn; put it side by side with a comparison against pre-boom levels. Conversely, looking toward 2027, 2026 will be the baseline “normal year without special demand,” which makes keeping records now highly valuable.
4. You can start forecasting monthly landing with just two points: 45 days out and 30 days out. The 15-day pickup of +3.7 points for Tokyo city hotels and +4.6 points for Osaka business hotels (both medians) serves as the market-side reference. If your own pickup over the same window is clearly below this, that is grounds for deciding to adjust sales conditions for the remaining 30 days. Because the number of observed properties shrinks at the latest observation, treat it as a difference against the fixed points rather than as a standalone level comparison.
Laid out on a timeline, this looks as follows.
| Time horizon | Action | Decision trigger (figures from this article) | Aim |
|---|---|---|---|
| Today – this week | Record in a single line the gap between your hotel’s July 2026 actual OCC and the estimated OCC for your area × category (Tokyo city 92.6% / Tokyo business 93.2% / Osaka city 89.6% / Osaka business 84.7%) | Start unconditionally if you don’t yet keep such records | Create the starting point for holding a correction range specific to your hotel |
| Today – this week | Change the format of external benchmarks used in internal and owner-facing materials so that the population label is stated alongside them | If materials still contain citations such as “REIT average” with no stated population | Make differences in scope — such as “101 domestic hotels” versus “29 hotels with variable rent, etc.” — clear to readers |
| Within 2 weeks | For October weekends (October 2, 9 and 16), compare your hotel’s 45→30-day pickup against the market median | If your pickup over the same window is clearly below Tokyo city +3.7pt / Osaka business +4.6pt (median) | Secure room to review sales conditions while the remaining 30 days can still be influenced |
| Within 2 weeks | Compare your hotel’s October–November rate settings against the range of estimated settled ADR for your area × category | If your settings remain well out of line with the market’s finalized levels (e.g., July 2026: Tokyo business ¥12,300 / Osaka business ¥8,400) | Confirm where your price band sits against a population matched on hotel type and area |
| Toward next month | Add “the monthly shape of estimated OCC” to your standard monthly review and determine whether your hotel is closer to the Tokyo pattern (small swings) or the Osaka pattern (sharp dip in June, recovery in July) | Use Osaka business hotels’ −5.0pt from May to June and Tokyo business hotels’ −2.0pt over the same stretch as pattern references | Rebuild your rate-change calendar to fit your seasonal shape |
| Toward next month | As a budget assumption for 2027, save your 2026 monthly figures as the “baseline year without special demand” (especially in Osaka) | If you are about to use YoY figures versus 2025 — Osaka business −31.9%, Osaka city −25.1% — as a budget basis | Avoid distorting targets with YoY figures based on a special-demand year |
Source: compiled by the HotelBank Editorial Team from MetroEngines Research data
Summary — Three Points for Overlaying the Two Yardsticks
First, measure the stability of the gap, not the level. As of July 2026, the gap between REIT-reported OCC and area estimated OCC ranged from −1.6 to +10.1 points. That spread reflects differences in hotel type and area, and no uniform correction factor exists. The only correction you can use is one specific to your hotel, obtained by recording each month the gap between your hotel’s actual OCC and the estimated OCC for your area.
Second, align the population before reading YoY figures. The three REITs’ ADR YoY was −1.0% to +0.1%, while finalized estimated settled ADR for the same month was −5.3% to −31.9%. The numbers diverge because the populations differ, and in Osaka the circumstances of the comparison base — the 2025 Expo period — come on top of that. Never take the numbers out of context without the label of the group they refer to.
Third, act without waiting for actuals. REIT results for July 2026 were published on August 25–27. A booking curve shows progress from 45 days before the stay date. Compare your hotel’s slope against the market at three fixed points — 45 days out, 30 days out and the latest observation — and reflect it in your moves for the remaining 30 days. By the time actuals come out, every decision for that month has already been made.
Related Articles
- Osaka Settled ADR June 2026: City -26.3%, Business -32.8% Post-Expo
- Booking Curves Across 47 Prefectures: +4.1pt Median Pickup from T-45
- What Is RevPAR? ADR x Occupancy, and Why GOP Splits 1.81x in 2026
- Osaka Expo’s Impact on Hotel ADR: REIT & OTA Data Analysis
About the Data
| Definition of estimated OCC | Occupancy based on OTA-listed inventory = 100 − 100 × OTA-listed rooms remaining ÷ total rooms. An estimate based on how inventory sold on OTAs is absorbed; its definition differs from actual room occupancy (it runs higher). Referred to in this article as “estimated OCC (based on OTA-listed inventory).” Target months are April–August 2026 (monthly) and individual stay dates in September–October 2026. |
| Booking curve | Based on observations from 45 days before the stay date to the most recent point. The number of observed properties decreases as the stay date approaches (e.g., for city hotels in Tokyo on September 18, 2026: 99 properties at 45 days out, 23 at the latest observation). |
| Definition of estimated settled ADR | The settled price level (tax-exclusive equivalent) estimated from OTA and other sales data (lowest-plan level × hotel-type coefficient, ensembled across multiple channels). Past months are finalized values; current and future months are estimates based on current sales. Median error versus published operating results: 6.6%. All values used in this article are for finalized months (July 2025 and July 2026). |
| Breakdown of N | Estimated OCC (July 2026): Tokyo city hotels 100 properties / 32,712 rooms; Tokyo business hotels 862 properties / 125,706 rooms; Osaka city hotels 91 properties / 24,219 rooms; Osaka business hotels 449 properties / 72,951 rooms. Estimated settled ADR (July 2026 / July 2025): Tokyo city 107 / 107 properties; Tokyo business 913 / 902 properties; Osaka city 97 / 90 properties; Osaka business 497 / 502 properties. REIT results follow the scope stated in each investment corporation’s published materials (101 domestic hotels / entire portfolio / 29 hotels with variable rent, etc.). |
| Treatment of YoY | YoY for estimated OCC against our own prior-year data has not been calculated. YoY figures use only REIT-reported values and comparisons between finalized months of estimated settled ADR. |
| Data timing | Data as of: September 9, 2026. Because sales and inventory change daily, the figures in this article are a snapshot as of the time of retrieval. |
References and Sources
■ Data sources
Published monthly operating results of three listed hotel REITs (8963 / 3463 / 8985), and our own aggregation of inventory and sales data listed on OTAs and other channels. REIT figures are quoted exactly as reported by each company, with no rounding or conversion.
■ Calculation assumptions
The “gap” is estimated OCC (based on OTA-listed inventory) minus reported occupancy. For month-to-month comparisons, the baseline is standardized on “29 hotels with variable rent, etc. (total),” whose scope is explicitly stated and whose series is continuous. YoY figures use only REIT-reported values and comparisons between finalized months of estimated settled ADR.
■ Limitations and caveats
Estimated OCC is inferred from how listed inventory is absorbed and structurally runs higher than actual room occupancy. Because the number of properties observed on a booking curve decreases as the stay date approaches, the latest single point is not suited to level comparisons on its own. The three REITs have different populations and cannot be simply averaged and treated as an “industry average.”
| Invincible Investment Corporation, “Monthly Operating Results” (published August 25, 2026) https://www.invincible-inv.co.jp/news/upd/140120260825525695.pdf |
| Ichigo Hotel REIT Investment Corporation, “Monthly Operating Results” (published August 25, 2026) https://www.ichigo-hotel.co.jp/ir/news/news_file/file/IchigoHotel_20260825_Monthly_Operating_Results_JPN.pdf |
| Japan Hotel REIT Investment Corporation, “Monthly Results” (published August 27, 2026) https://www.jhrth.co.jp/file/review_exceldl-347fcee763387952f68e1b7a06e0839aaef0cd6e.xlsx |
| Japan Association for the 2025 World Exposition, “Looking Back at Expo 2025 Osaka, Kansai Through Data” https://www.expo2025.or.jp/expo_data/ |
| Japan Association for the 2025 World Exposition, “On Visitor Numbers and Admission Ticket Sales” https://www.expo2025.or.jp/news/news-20251014-01/ |