

In first-pass hotel site screening, “how many minutes’ walk from the station” is still the first yardstick. Yet a 5-minute walk from a station used by 30,000 people a day and one used by 660,000 people sits on top of completely different volumes of people. This article sets distance aside and screens rail nodes across Japan using a single unit metric: supply density with the station’s own size (daily passengers) as the denominator — “hotel rooms per 10,000 daily passengers.” We matched station ridership data (FY2023) from the Ministry of Land, Infrastructure, Transport and Tourism (MLIT) Real Estate Information Library against inventory of 24,518 properties and 1,408,537 rooms with confirmed sales activity on online travel agencies (OTAs) nationwide.
First, how this article differs from earlier pieces. Our earlier study measuring station distance against room rates dealt with the relationship between distance from a station and ADR; this article does not use distance at all. “Japan’s 50 Smart Interchanges: Median 1,130 Hotel Rooms Within 10km” treated expressway interchanges as the nodes. A previous study of “room stock per passenger” at 43 major stations limited its scope to large terminals; this article widens the population to 1,033 nodes nationwide with 20,000 or more daily passengers and adds a functional axis, the daytime-to-nighttime population ratio. Our deep dive into 37 hotels and 4,160 rooms in Tachikawa, Hachioji and Machida focused on one specific sub-region, Tama. This article is none of these: it is a cross-sectional screening that lines up every rail station in Japan on the same unit metric.
Metric Definitions Used in This Article
- Rooms per 10,000 daily passengers (this article’s unit metric): rooms within a 1km radius of a rail node ÷ (daily passengers ÷ 10,000). The lower the value, the thinner the room stock relative to the scale of rail demand. Passenger counts are from the MLIT Real Estate Information Library “Passengers by Station (FY2023).”
- Rooms per 10,000 workers: rooms within the same 1km radius, normalized by the number of workers in that area (Economic Census). Used as a second axis that is less affected by the through-traffic and commuting embedded in passenger counts.
- Day/night ratio: workers within a 1km radius ÷ resident population of the same area (250m mesh estimate, 2025). A ratio of 1.0 or higher is treated as a “destination-type” station (one that draws people in); below 1.0 as a “commuter-origin” station (one that sends people out).
- ADR (average daily rate): estimated settled room rate (tax-exclusive equivalent), calculated by applying segment-specific adjustment factors to the lowest published plan rate each property lists on OTAs (2 guests per room, per-room price, tax-inclusive). Checked against property-level results disclosed by listed hotel REITs (91 properties, most recent 3 months), the median error is about 7%. These are estimates and differ from each property’s actual settled prices and accounting figures. Area-level ADR is the median across the covered properties (the level of a typical property in the area).
- OCC (occupancy rate): share of rooms sold relative to total rooms in the area (an estimate based on OTA sales inventory; consistency checks against monthly REIT disclosures confirm accuracy within roughly a few points).
- Data sources: MetroEngines Research & Consulting / MLIT Real Estate Information Library / Ministry of Internal Affairs and Communications (MIC) and Ministry of Economy, Trade and Industry (METI) Economic Census for Business Activity / MLIT National Land Numerical Information
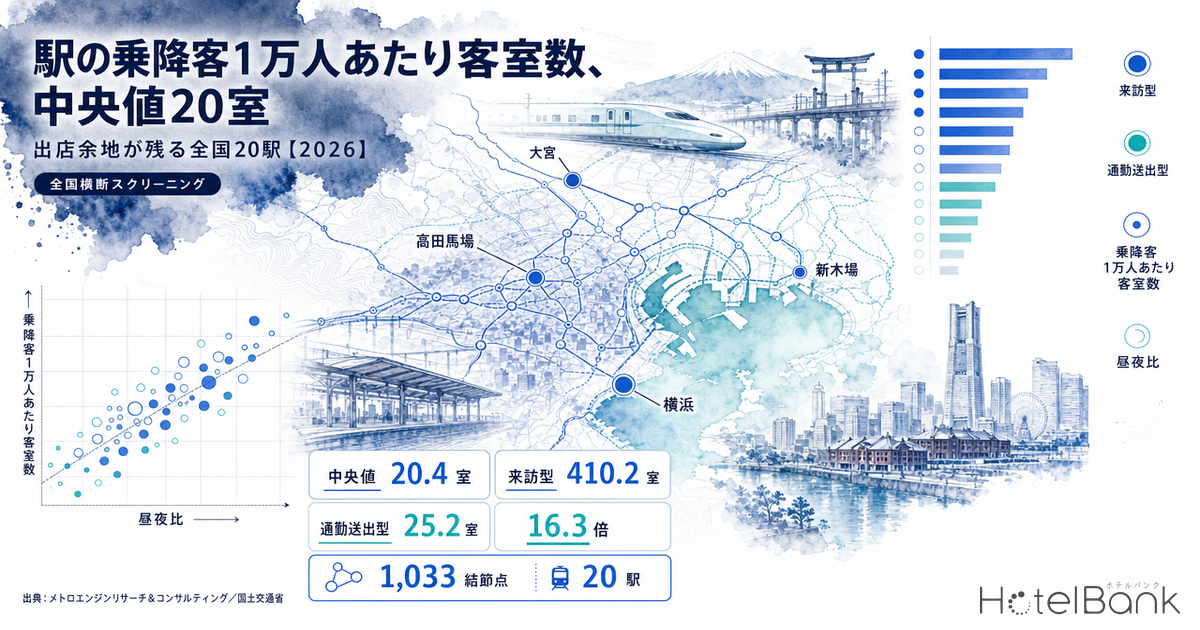
- — The median across 1,033 nodes nationwide is 20.4 rooms per 10,000 passengers. The interquartile range runs from 0.0 to 129.1 rooms — an extreme spread that city-size tiers cannot explain.
- — What matters is the station’s function. Splitting at a day/night ratio of 1.0 yields 410.2 rooms for destination-type nodes versus 25.2 rooms for commuter-origin nodes — a 16.3x gap that holds in all four city-size tiers.
- — 20 destination-type nodes fall below the median on both axes. Of these, 18 stay thin even when the radius is widened to 1.5km; Yokohama (16.8 rooms), Takadanobaba (7.9 rooms) and Shin-Kiba (9.6 rooms) are representative.
- — Thin supply does not mean weak demand. The 18 cities and wards containing the 20 nodes show estimated occupancy of 98.3–99.5% for July 2026; existing rooms are not going unsold.
- — Screening strictness moves the candidate count between 15 and 86 nodes. A single axis leaves 86, while two axes narrow it to 20 — so the unit metric should be used as one more column on a candidate list, not as a stand-alone decision criterion.
Why Cut by Demand Scale Instead of Distance — How the Metric Is Built and the Population
The method is very simple. We first pulled station ridership (FY2023) nationwide from the Real Estate Information Library. The data is split into records by operator and line, and at shared stations the same passengers are counted by multiple operators. We therefore grouped records by station group code, removed records flagged with duplicate codes, and summed the actual figures by operator. Of 9,075 station groups nationwide, 7,628 have FY2023 passenger counts recorded.
From these we extracted 1,163 stations with 20,000 or more daily passengers and merged stations whose centers lie within 500m of each other into a single “node.” This consolidates cases such as Umeda, where station names differ by operator, into one point, giving 1,033 nodes. Passenger counts are the merged totals, and coordinates are the passenger-weighted centroid.
For the numerator, room stock, we limited coverage to properties with recently observed sales on OTAs. The target is 24,518 properties and 1,408,537 rooms with location data; 19 properties without registered room counts are counted as properties but not added to the room total. The gap versus the number of licensed lodging facilities (98,338 nationwide) reflects the exclusion of simple lodging facilities not listed on OTAs and properties that are closed. Rooms were aggregated by straight-line distance from each node’s center, using a 1km radius as the main metric and 1.5km as a sensitivity check. Because properties within 1km of multiple nodes would be double-counted in a gross total, the unique set appearing in this article’s numerator is 5,307 properties and 676,042 rooms.
What this metric can and cannot answer. Passenger counts measure the scale of rail use, not lodging demand itself. A low unit metric therefore cannot be read directly as room for new openings. Below, we use employment data and resident population to separate station functions, and then check whether the headroom is supported on the pricing and occupancy side as well.
Cut by City-Size Tier, the Order Runs Counter to Intuition
We began with the textbook approach, dividing nodes into four tiers — the cores of the three major metropolitan areas (Tokyo’s 23 wards, Osaka City, Nagoya City) / ordinance-designated cities / prefectural capitals / other — and computing the median and quartiles for each. Ordinance-designated cities here means the 18 cities excluding the three metropolitan cores, and prefectural capitals means the remaining 31 prefectural capital cities.
| City-size tier | Nodes | Properties within 1km (gross) | Rooms within 1km (gross) | Q1 | Median | Q3 | 1.5km median | Zero rooms within 1km |
|---|---|---|---|---|---|---|---|---|
| Major metro cores | 374 | 5,417 | 838,725 | 0.0 | 57.5 | 295.9 | 132.8 | 96 |
| Ordinance-designated cities | 257 | 3,397 | 392,539 | 0.0 | 4.6 | 104.0 | 22.6 | 108 |
| Prefectural capitals | 25 | 435 | 46,848 | 135.9 | 568.2 | 827.0 | 653.6 | 3 |
| Other | 377 | 994 | 113,470 | 0.0 | 11.3 | 59.5 | 21.9 | 156 |
The result runs counter to intuition. The highest unit metric — meaning the thickest room stock relative to rail demand — is in prefectural capitals (median 568.2 rooms), and the thinnest is in ordinance-designated cities (4.6 rooms). Major metro cores come in at 57.5 rooms and other at 11.3 rooms. The idea that bigger cities have thicker room stock does not hold at all.
The width of the quartiles explains why. In major metro cores, Q1 is 0.0 rooms and Q3 is 295.9 rooms — nodes in the same tier are scattered to both extremes. Ordinance-designated cities likewise have a Q1 of 0.0 rooms, and 108 of their 257 nodes have no rooms within a 1km radius. Prefectural capitals, by contrast, have only 3 zero-room nodes out of 25, and even their Q1 is 135.9 rooms. In other words, a city-size tier is merely a container for stations of widely varying character. Large metro areas contain both central-business-district stations and residential stations, and averaging them within one tier makes them cancel out. Prefectural capitals have few large residential stations to begin with, so only the central stations remain and the values come out high.
Station Function Is What Matters — Splitting by Day/Night Ratio Opens a 16x Gap
So we re-cut by station function. Using the day/night ratio — workers within a 1km radius (Economic Census) divided by resident population of the same area (250m mesh estimate, 2025) — we classified nodes at 1.0 or above as “destination-type (stations that draw people in)” and below 1.0 as “commuter-origin (stations that send people out).” Nodes without employment data were excluded from classification. Restricting to nodes of meaningful size on both the rail and employment side (30,000+ daily passengers and 15,000+ workers within the area) leaves 174 destination-type and 234 commuter-origin nodes.
The median is 410.2 rooms for destination-type nodes versus 25.2 rooms for commuter-origin nodes, a 16.3x gap. The spread of 4.6 to 568.2 rooms seen across city-size tiers turns out not to be a difference between the tiers themselves, but a difference in how destination-type and commuter-origin nodes are mixed within each tier. Indeed, the functional gap holds in every tier.
| City-size tier | Destination-type nodes | Destination-type median | Commuter-origin nodes | Commuter-origin median | Multiple |
|---|---|---|---|---|---|
| Major metro cores | 105 | 347.7 | 126 | 39.3 | 8.8x |
| Ordinance-designated cities | 40 | 451.2 | 40 | 12.1 | 37.3x |
| Prefectural capitals | 8 | 649.5 | 4 | 469.4 | 1.4x |
| Other | 21 | 204.2 | 64 | 24.4 | 8.4x |
The top end of the distribution is also meaningful. The highest unit metrics belong to subway stations in nightlife districts: Susukino in Sapporo (5,531.8 rooms), Nagahoribashi in Osaka (4,178.9 rooms), Nakasu-Kawabata in Fukuoka (3,764.5 rooms) and Marunouchi in Nagoya (3,422.0 rooms). Each has a mid-sized 30,000–50,000-range passenger count, yet around 10,000 rooms cluster within 1km. Lodging here locates next to concentrations of entertainment and dining rather than rail nodes, so using rail scale as the denominator produces extremely high values. When reading the unit metric side by side, this structure — nightlife-district nodes sitting at the top — should be factored in from the outset.
20 Nodes With Remaining Headroom — Stations Below the Median on Both Axes
From the 174 destination-type nodes, we extracted those where both rooms per 10,000 passengers (median 410.2 rooms) and rooms per 10,000 workers (median 416.7 rooms) fall below the median. Looking at passenger counts alone, giant terminals with heavy through- and transfer traffic mechanically rise to the top. We therefore used worker counts, which directly measure daytime business demand, as a second denominator and kept only nodes that are thin on both axes. The top 10 are shown for the major metro cores and for all other areas, in ascending order of the sum of relative values on both axes.
Table A: Major metro cores (Tokyo’s 23 wards, Osaka City, Nagoya City)
| # | Node | Daily passengers | Workers within 1km | Day/night ratio | Rooms within 1km | Rooms per 10k passengers | Rooms per 10k workers | Metric at 1.5km | Est. settled ADR Jul 2026 | Est. OCC Jul 2026 |
|---|---|---|---|---|---|---|---|---|---|---|
| 1 | Tsurumai Naka Ward, Nagoya | 67,624 | 44,971 | 1.2 | 47 2 properties | 7.0 | 10.5 | 626.8 Resolved | ¥8,534 N=87 | 98.4% |
| 2 | Naka-Meguro Meguro Ward | 363,724 | 63,699 | 1.14 | 386 6 properties | 10.6 | 60.6 | 62.8 Remains | ¥16,024 N=10 | 99.5% |
| 3 | Toyosu Koto Ward | 235,987 | 86,243 | 1.35 | 553 3 properties | 23.4 | 64.1 | 82.4 Remains | ¥12,201 N=39 | 99.0% |
| 4 | Omotesando Minato Ward | 168,791 | 188,938 | 6.34 | 843 7 properties | 49.9 | 44.6 | 211.6 Remains | ¥15,138 N=132 | 98.7% |
| 5 | Meguro Shinagawa Ward | 636,632 | 85,615 | 1.35 | 762 5 properties | 12.0 | 89.0 | 38.1 Remains | ¥11,535 N=35 | 99.5% |
| 6 | Takadanobaba Shinjuku Ward | 783,543 | 63,457 | 1.04 | 620 5 properties | 7.9 | 97.7 | 17.7 Remains | ¥13,259 N=99 | 99.1% |
| 7 | Ichigaya Chiyoda Ward | 311,646 | 149,641 | 3.26 | 1,172 9 properties | 37.6 | 78.3 | 158.5 Remains | ¥13,860 N=80 | 99.3% |
| 8 | Ebisu Shibuya Ward | 340,535 | 106,778 | 1.9 | 1,068 8 properties | 31.4 | 100.0 | 69.5 Remains | ¥22,030 N=34 | 99.1% |
| 9 | Gaiemmae Minato Ward | 72,412 | 107,839 | 4.47 | 567 4 properties | 78.3 | 52.6 | 364.2 Remains | ¥15,138 N=132 | 98.7% |
| 10 | Shin-Kiba Koto Ward | 282,481 | 21,616 | 48.68 | 272 3 properties | 9.6 | 125.8 | 9.6 Remains | ¥12,201 N=39 | 99.0% |
Table B: Ordinance-designated cities, prefectural capitals and other
| # | Node | Daily passengers | Workers within 1km | Day/night ratio | Rooms within 1km | Rooms per 10k passengers | Rooms per 10k workers | Metric at 1.5km | Est. settled ADR Jul 2026 | Est. OCC Jul 2026 |
|---|---|---|---|---|---|---|---|---|---|---|
| 1 | Minami-Funabashi Funabashi, Chiba | 43,356 | 22,230 | 1.02 | 0 0 properties | 0.0 | 0.0 | 23.1 Remains | ¥9,283 N=13 | 99.5% |
| 2 | Yokogawa Nishi Ward, Hiroshima | 30,654 | 32,539 | 1.04 | 94 4 properties | 30.7 | 28.9 | 46.6 Remains | ¥6,707 N=5 | 98.3% |
| 3 | Yokohama Nishi Ward, Yokohama | 1,961,481 | 158,671 | 3.63 | 3,288 17 properties | 16.8 | 207.2 | 21.3 Remains | ¥20,257 N=17 | 98.5% |
| 4 | Tachikawa Tachikawa City | 373,576 | 62,233 | 1.67 | 1,436 14 properties | 38.4 | 230.7 | 38.4 Remains | ¥9,919 N=17 | 99.1% |
| 5 | Kariya Kariya, Aichi | 79,660 | 41,920 | 3.69 | 773 7 properties | 97.0 | 184.4 | 97.0 Remains | ¥5,880 N=8 | 98.8% |
| 6 | Chiba-Minato Chuo Ward, Chiba City | 49,566 | 53,357 | 2.23 | 769 5 properties | 155.1 | 144.1 | 467.9 Resolved | ¥8,878 N=35 | 98.3% |
| 7 | Omiya Omiya Ward, Saitama / Shinkansen stop | 660,537 | 98,009 | 2.79 | 2,659 13 properties | 40.3 | 271.3 | 47.1 Remains | ¥8,601 N=17 | 98.8% |
| 8 | Odawara Odawara, Kanagawa / Shinkansen stop | 168,783 | 23,117 | 1.34 | 721 13 properties | 42.7 | 311.9 | 42.8 Remains | ¥8,040 N=15 | 99.3% |
| 9 | Esaka Suita, Osaka | 98,851 | 54,277 | 1.07 | 1,393 8 properties | 140.9 | 256.6 | 140.9 Remains | ¥7,934 N=9 | 99.4% |
| 10 | Hachioji Hachioji City | 199,417 | 48,276 | 1.17 | 1,612 12 properties | 80.8 | 333.9 | 80.8 Remains | ¥8,304 N=12 | 99.1% |
Which Nodes Stay Thin Even at 1.5km — Sensitivity Check
A 1km radius cuts off adjacent clusters. We therefore ran the same calculation at 1.5km and checked whether each node recovers above the destination-type median. Of the 20 nodes, 18 remained below the median even at 1.5km; only two recovered — Tsurumai in Nagoya (7.0 → 626.8 rooms) and Chiba-Minato in Chiba City (155.1 → 467.9 rooms). The 1.5km radius around Tsurumai takes in the room cluster of Sakae, and Chiba-Minato’s takes in the cluster around Chiba Station, so their thinness at 1km was simply the flip side of “having a thick cluster next door.”
Thin at both 1km and 1.5km (clear headroom)
Yokohama (16.8 → 21.3 rooms), Omiya (40.3 → 47.1 rooms), Takadanobaba (7.9 → 17.7 rooms), Shin-Kiba (9.6 → 9.6 rooms) and others. Supply does not build up even when the radius widens, so headroom relative to rail scale remains structurally.
Thin only within walking distance (absorbed by adjacent clusters)
Tsurumai (7.0 → 626.8 rooms), Chiba-Minato (155.1 → 467.9 rooms). Because the 1.5km radius far exceeds the median, station-front sites may be scarce, but supply reaches the catchment as a whole.
Nodes with outsized employment clusters
Omotesando (day/night ratio 6.34), Gaiemmae (4.47), Ichigaya (3.26). Passenger counts are not especially large, but the daytime population is thick, and thinness shows up in the worker-based metric. The reading here is capacity for business-travel and corporate demand.
Yokohama’s breakdown is emblematic. Despite one of the largest passenger counts in Japan at 1.96 million a day, rooms within a 1km radius total just 3,288 across 17 properties. Even at 1.5km the total is 4,171 rooms, and the unit metric is 21.3 rooms — about one-twentieth of the destination-type median. The large properties toward Minato Mirai are spread beyond 1.5km from the station’s centroid, so the walking-distance area around Yokohama Station itself still has considerable headroom relative to the level implied by its rail scale. Omiya is similar: a Shinkansen stop used by 660,000 people a day, yet with only 13 properties and 2,659 rooms within 1km, and 3,109 rooms even at 1.5km.
How Many Candidate Nodes at Each Screening Strictness — Two-Axis Sensitivity
The extraction so far used one set of thresholds: “day/night ratio of 1.0 or higher” and “below the median on both the passenger and worker axes.” To see how much the number and makeup of candidates shift with the thresholds, we tested the 173 nodes classified as destination-type (the one node with zero rooms is excluded from the log-scale tabulation). Everything below is recalculated from this article’s aggregates; no new demand forecast is assumed.
Candidate portfolio by screening strictness
| Screen | Day/night ratio | Rooms per 10k passengers | Candidate nodes | Total passengers | Total rooms | Weighted metric of group |
|---|---|---|---|---|---|---|
| Conservative (narrow focus) | 1km day/night ratio 3.0+ | Under 102.5 rooms | 15 | 15,279,404 | 78,843 | 51.6 rooms |
| Moderate (close to this article’s criteria) | 1.5+ | Under 205.1 rooms | 40 | 27,959,918 | 206,528 | 73.9 rooms |
| Broad (wide net) | 1.0+ | Under 410.2 rooms | 86 | 37,530,959 | 366,793 | 97.7 rooms |
Tightening the screen reduces candidates to 15 nodes, and the group’s weighted unit metric drops to 51.6 rooms. Casting a wide net instead yields a population of 86 nodes and roughly 360,000 rooms, but the weighted metric rises to 97.7 rooms and the sharpness of “thinness” is blunted. This article narrows to 20 nodes because it uses an AND condition on two axes, with workers as a second denominator alongside passengers; taking nodes below the median on the passenger axis alone leaves 86. The unit metric is not an indicator that settles candidates on its own.
Two-axis threshold matrix — number of qualifying destination-type nodes
| Rooms per 10k passengers \ Day/night ratio | 1.0+ Base 173 | 1.5+ Base 135 | 2.0+ Base 110 | 3.0+ Base 75 | 5.0+ Base 40 |
|---|---|---|---|---|---|
| Under 20.5 rooms | 7 | 3 | 3 | 3 | 2 |
| Under 102.5 rooms | 37 | 22 | 19 | 15 | 8 |
| Under 205.1 rooms | 64 | 40 | 35 | 28 | 16 |
| Under 307.6 rooms | 75 | 49 | 41 | 32 | 17 |
| Under 410.2 rooms | 86 | 59 | 50 | 37 | 20 |
Reading the matrix down the columns, raising the day/night threshold from 1.0 to 3.0 only reduces the extremely thin nodes (under 20.5 rooms) from 7 to 3. The thinnest tier remains largely at stations with a thick daytime population, which means its reading as capacity for employment-driven demand is robust. By contrast, the tier under 205.1 rooms falls by more than half, from 64 to 28, and is sensitive to where the threshold is set. For first-pass site screening, a practical approach is to keep the extremely thin tier on the candidate list regardless of threshold, and to handle the middle tier together with the day/night ratio.
Do Pricing and Occupancy Support the Headroom? — Estimated Settled ADR and Estimated Occupancy
Thin supply alone does not signal an investment opportunity, because supply may be thin precisely because demand is weak. We therefore checked the estimated settled ADR and estimated occupancy for July 2026 in the cities and wards where the 20 extracted nodes are located.
Estimated occupancy for all 18 cities and wards fell within a 98.3–99.5% range. Inventory released on OTAs was almost fully absorbed as of July, leaving virtually no difference between areas. Because estimated occupancy for past months is inflated by inventory withdrawals, this indicator cannot be used to rank areas against each other. What it does confirm is that existing rooms are not going unsold in any of the extracted areas. We can establish that supply is not thin because demand is weak.
On pricing, levels differ clearly by area. Shibuya Ward at ¥22,000 (N=34 properties), Nishi Ward in Yokohama at ¥20,300 (N=17) and Meguro Ward at ¥16,000 (N=10) are at the top, with Kariya at ¥5,900 (N=8) and Nishi Ward in Hiroshima at ¥6,700 (N=5) at the bottom. Year over year, Nishi Ward in Yokohama is up 12.3%, Meguro Ward up 18.9% and Funabashi up 15.6%, so there are areas where thin supply and rising rates overlap. Conversely, Omiya Ward in Saitama is down 17.4% and Suita down 16.3% from a year earlier, so even among nodes with an equally “low unit metric,” some have pricing tailwinds and some do not. To prioritize site acquisition, a practical step is to layer this rate trend on top of the unit metric and worker density.
Geographic Spread of the 174 Destination-Type Nodes
We mapped the 174 nodes classified as destination-type, color-coded by unit metric level. Circle size shows daily passengers and color shows rooms per 10,000 passengers. The darker the blue, the lower the unit metric and the greater the headroom relative to rail scale.
The distribution shows that low-metric nodes tend to cluster along the ring of the Tokyo metropolitan area and its waterfront, and in the industrial cities of the Chukyo (Nagoya) region. By contrast, central stations in regional hub cities such as Sapporo, Sendai, Hiroshima, Fukuoka and Naha score high because their rail scale is mid-sized. Even as room stock becomes a topic in regional cities hosting a growing number of international conferences, it is worth remembering that on a metric using rail scale as the denominator, regional hubs actually sit on the thicker side.
Six Caveats for Interpretation
| Issue | How this article handles it |
|---|---|
| Passenger counts are not lodging demand | They only indicate the scale of rail use. Commuter-heavy stations naturally have low unit metrics, which cannot be read as room for openings as-is. This article separates destination-type from commuter-origin nodes by day/night ratio and extracts only destination-type nodes. |
| Definitional differences at transfer-only and Shinkansen-only stations | Station ridership is counted by operator, and at stations where the Shinkansen and conventional lines are run by different operators (Tokyo, Shinagawa, Omiya, etc.), Shinkansen passengers form a separate record. This article sums by station group after removing duplicate codes, but the treatment of passengers who only transfer to another operator’s line without exiting the gates varies by operator. Tables A and B note whether the Shinkansen stops at each node. |
| Missing employment data | Economic Census boundary data at the town/block level is missing for some areas and can return zero establishments. Because this is missing data rather than zero employment, the 17 nodes without coverage were excluded from functional classification and extraction (1,016 of 1,033 nodes could be classified). Coverage was verified node by node; for central Kyoto, coverage was confirmed including Shijo, Kyoto-Kawaramachi and Sanjo. |
| Population of room stock | Limited to properties with recently observed sales on OTAs; ryokan and simple lodging facilities not listed on OTAs, as well as company dormitories and corporate retreats, are not included. Properties without registered room counts are excluded from room totals. |
| The 1km radius cut | Set as a proxy for walking distance, it cuts off adjacent clusters. A 1.5km sensitivity check is always shown alongside, and nodes whose thinness disappears when the radius widens (Tsurumai, Chiba-Minato) are identified explicitly. |
| Node merging rule | Stations whose centers are within 500m were merged into one node. In central Tokyo this produces chained clusters such as Nihonbashi, Kanda and Ochanomizu, so the merged centroid may diverge from actual station locations. |
Summary — Add One More Column to Site Screening
Across 1,033 nodes nationwide, the median of rooms per 10,000 daily passengers is 20.4 rooms, with an interquartile range of 0.0 to 129.1 rooms — an extreme spread. That spread cannot be explained by city-size tier; cutting by station function (day/night ratio) reveals a 16.3x gap between destination-type nodes at 410.2 rooms and commuter-origin nodes at 25.2 rooms, and the gap holds in all four tiers. This article’s conclusion: if passenger counts are used in first-pass site screening, they should be read together with how much daytime population a station absorbs, not with city size.
On that basis, extracting nodes that are thin with both passengers and workers as denominators leaves 20, of which 18 stayed thin even when the radius was widened to 1.5km. Nodes such as Yokohama, Omiya, Takadanobaba, Shin-Kiba, Tachikawa, Odawara, Hachioji and Kariya retain structural headroom relative to the scale of rail use and daytime employment. Existing rooms were almost fully absorbed as of July on an OTA-listed-inventory basis, so supply is not thin because of weak demand. The next step is to overlay site availability and rate trends and decide where to start.
The unit metric in this article does not replace existing yardsticks such as station distance or area ADR. It works best combined with analyses of price-band white space and cumulative room stock within a catchment, as one more column added to a candidate site list.
⚠ About the estimates: Room counts in this article are the sum of registered rooms at properties confirmed as listed on OTAs at the time of the study and will change as listings are updated. Estimated settled ADR and estimated occupancy are both estimates and differ from each property’s actual settled prices and accounting figures. In particular, estimated occupancy for past months tends to be inflated because it includes inventory withdrawals, and it is not used to rank cities or wards against each other.
Related Reading
- Japan’s 50 Smart Interchanges: Median 1,130 Hotel Rooms Within 10km
- Station Premium Ends at an 8-Minute Walk: 8 Stations, 1,012 Hotels
- Naniwasuji & Haneda Access Lines 2031: Hotel Investment Timelines
References and Sources
■ Data sources
Passenger counts are from the MLIT Real Estate Information Library, Passengers by Station (FY2023). From the 7,628 stations with passenger counts among 9,075 station groups nationwide, we extracted 1,163 stations with 20,000+ daily passengers and merged stations whose centers are within 500m, giving 1,033 nodes. Room stock covers 24,518 properties and 1,408,537 rooms with recently observed OTA sales (those with location data); the unique set within 1km is 5,307 properties and 676,042 rooms. Worker counts are from the Economic Census for Business Activity, and resident population from the National Land Numerical Information future population estimates by 250m mesh (2025 estimate). Estimated settled ADR and estimated occupancy are our own estimates at the city/ward level as of July 2026.
■ Calculation assumptions
Rooms per 10,000 daily passengers = rooms within a 1km radius ÷ (daily passengers ÷ 10,000). Radius is straight-line distance from the node centroid, with 1km as the main metric and 1.5km as a sensitivity check. Day/night ratio = workers within 1km ÷ resident population of the same area; 1.0 or higher is destination-type and below 1.0 is commuter-origin. Extraction covers destination-type nodes below the median on both the passenger and worker axes, ranked in ascending order of the sum of relative values on both axes. Candidate node counts and totals in the sensitivity analysis are re-tabulations of actual values for the same 173 nodes at each threshold and do not assume any demand forecast or new development plan.
■ Limitations and caveats
Passenger counts measure the scale of rail use, not lodging demand itself, and a low unit metric alone does not imply room for openings. Treatment of passengers who only transfer without exiting the gates varies by operator, and counts are split at stations where the Shinkansen and conventional lines are run by different operators. Economic Census town/block boundaries are missing for some areas; the 17 nodes without coverage were excluded from functional classification and extraction (1,016 of 1,033 could be classified). Room stock excludes ryokan and simple lodging facilities not listed on OTAs, as well as company dormitories and corporate retreats. Estimated settled ADR and estimated occupancy are estimates and differ from actual settled prices and accounting figures. In particular, estimated occupancy for past months is inflated because it includes inventory withdrawals, and it is not used to rank cities or wards. ADR and OCC are city/ward-level values, not station-level values.
■ Market data
- MetroEngines Research & Consulting — room stock based on confirmed OTA listings (N=24,518 properties, 1,408,537 rooms), estimated settled ADR, estimated occupancy
■ Government statistics and public data
- MLIT Real Estate Information Library — Passengers by Station (National Land Numerical Information S12, FY2023)
- MIC and METI “Economic Census for Business Activity” (2021; boundaries from 2020 Population Census small areas)
- MLIT National Land Numerical Information “Future Population Estimates by 250m Mesh” (based on 2024 National Institute of Population and Social Security Research projections)
- Geospatial Information Authority of Japan — reverse geocoding (used to assign municipality codes)