

Ishikawa Prefecture’s hotel market absorbed two shocks pointing in opposite directions at almost the same moment: the Noto Peninsula Earthquake of January 2024 and the March 2024 extension of the Hokuriku Shinkansen to Tsuruga. Two and a half years on, this article takes a cross-section of 2026 using price, occupancy and supply data at the municipal level. Written for development teams choosing sites in Hokuriku, for lenders assessing feasibility, and for investors weighing the succession or turnaround of hot-spring ryokan, it quantifies which markets still have white space and at which price points.
Metric Definitions Used in This Article
- ADR (average daily rate / estimated settled ADR): an estimated transaction-level rate (tax-exclusive equivalent) derived by applying a property-type correction coefficient to the lowest publicly listed plan rate each property posts on OTAs (double occupancy, per-room rate, tax-inclusive). Cross-checked against property-level disclosures by listed hotel REITs (91 properties, most recent three months), the median error is approximately 7%. These are estimates and differ from each property’s actual transaction prices and accounting figures. Area-level ADR is the median of the properties covered (the level of a typical property in that area).
- Listed price (all-plan average): the average publicly sold price across all plans, from room-only to meal-inclusive (double occupancy, per-room rate, tax-inclusive). Because the basis differs from estimated settled ADR, the two levels should not be compared directly.
- OCC (occupancy rate): the share of rooms sold against total rooms in the area (an estimate based on OTA-listed inventory). It reflects how listed OTA inventory is being absorbed and differs from each property’s true overall occupancy.
- Data source: MetroEngines Research & Consulting
- — Listed prices rose +6.8% while estimated settled ADR rose only +2.1% (January–July 2026). Premium plans have been stacked on top, but the rates actually being captured have barely moved.
- — Estimated OCC is 86.0% prefecture-wide and 95.9% in Nanao (as of August 2026). Differences between property types are small, and the gap between peak and normal periods is not extreme.
- — The confirmed supply pipeline is a single project of 171 rooms. New openings in 2026 total 12 properties and 259 rooms (OTA-listing basis, a floor figure), so the scarcity of existing stock will persist for some time.
- — Only five properties in Kanazawa clear ¥15,000 in estimated settled ADR. Urban upper-midscale (¥15,000–¥25,000 × 60–150 rooms) remains a structural white space.
- — GOP yields for the three development archetypes are A 8.8% / B 6.2% / C 5.8%. Case B still holds 5.2% even if ADR falls 10% and OCC drops 5pt at the same time.
Summary — A Market Where Capacity Matters More Than Rate
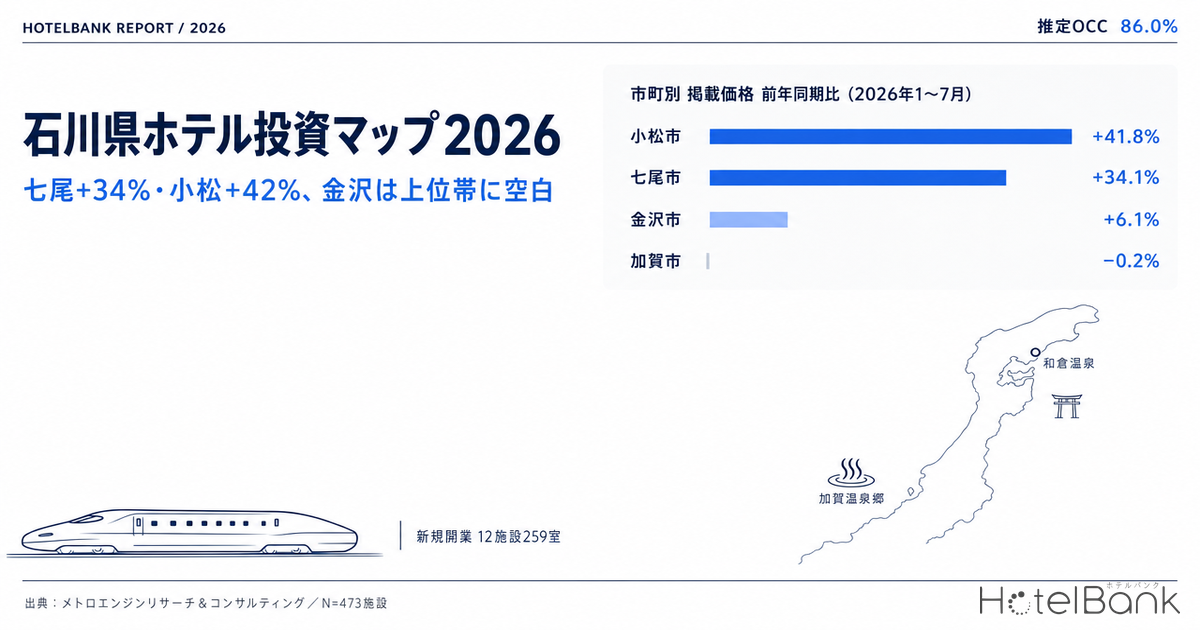
The conclusion first. Ishikawa in 2026 is not a market where rates are rising; it is a market where occupancy is stuck high and supply is thin. Listed prices across the prefecture rose 6.8% year on year in January–July 2026, but estimated settled ADR gained only 2.1%. The ceiling on plans has been lifted, yet the level actually being achieved has not moved much. Meanwhile, estimated OCC reached 86.0% in August (as of August 2026, estimated on an OTA-listed-inventory basis, N=376 properties), and new openings are limited to 12 properties and 259 rooms for the year (OTA-listing basis). The axis of the investment decision has shifted away from “how far can we push rate” toward “in areas where occupancy is pinned, what price band of rooms can we newly place?”
And the location of that white space differs sharply by municipality. Kanazawa has the largest property count in the prefecture but a thin upper price band. Kaga Onsen Village (Kaga City) holds the highest rate band in the prefecture yet has stopped growing. Nanao (Wakura Onsen) and Komatsu posted high-double-digit growth in listed prices, and the number of properties observed is itself increasing. We take each in turn below.
Prefecture-Wide Price Trend — The Gap Between Listed and Settled Rates
First, the seasonality of the prefecture as a whole. Ishikawa has two peaks, in August and November. August brings summer holidays and the Hokuriku beach season; November combines the opening of the Kano crab (snow crab) season with autumn foliage, a second peak characteristic of Hokuriku. That November peak works far more powerfully on the revenue structure of food-led ryokan and resorts than on business hotels built around year-round occupancy.
Placing the two charts side by side makes the difference visible. The 2026 line for listed prices (left) sits clearly above 2024 and 2025, whereas the 2026 line for estimated settled ADR (right) nearly overlaps 2025. Comparing January–July averages, listed prices rose from ¥23,300 to ¥24,900, or +6.8%, while estimated settled ADR moved from ¥10,300 to ¥10,500, or +2.1%.
How should the gap be read? Because estimated settled ADR is calculated from each property’s lowest-plan level, a state in which only listed prices are rising suggests that properties are stacking higher-rate plans on top while leaving the price floor unchanged. The natural reading is that this reflects progress in building out premium plans bundling meals and experiences, with the lift in underlying rate still ahead. Put the other way, headroom to raise the price floor remains across the market.
By Property Type — Structure Across Three Years
| Property type | Listed price 2024 | 2025 | 2026 | Est. settled ADR 2024 | 2025 | 2026 | N (2026) |
|---|---|---|---|---|---|---|---|
| Ryokan | ¥45,778 | ¥48,088 | ¥47,814 | ¥19,463 | ¥17,747 | ¥17,385 | 118 / 112 |
| Business hotel | ¥15,569 | ¥14,667 | ¥14,863 | ¥8,151 | ¥7,612 | ¥7,512 | 111 / 109 |
| City hotel | ¥25,664 | ¥24,678 | ¥24,846 | ¥13,117 | ¥11,594 | ¥11,999 | 10 / 10 |
| Resort hotel | ¥35,131 | ¥35,276 | ¥40,549 | ¥13,762 | ¥12,897 | ¥13,206 | 6 / 6 |
Lined up across three years by property type, rate levels themselves have not moved much within any type. Ryokan listed prices went ¥45,800 → ¥48,100 → ¥47,800; business hotels went ¥15,600 → ¥14,700 → ¥14,900 — both within their ranges. The +6.8% prefecture-wide gain in listed prices owes less to price increases within types than to a change in the composition of the observed set itself — above all, properties on the Noto side resuming operations and re-entering the aggregation, raising the weight of relatively high-rate ryokan and resort formats. Any reading of the growth rate must take this shift in the underlying population into account.
The Municipal Map — Four Distinct Investment Markets
Cut the prefecture into municipalities and four markets with different characters emerge. The table below places January–July 2026 average prices alongside the most recent August estimated OCC.
| City | Listed price Jan–Jul 2026 | YoY | Est. settled ADR | YoY | Est. OCC Aug 2026 | N (listed / settled) |
|---|---|---|---|---|---|---|
| Nanao (Wakura Onsen) | ¥26,141 | +34.1% | ¥9,320 | +9.1% | 95.9% | 42 / 17 |
| Komatsu (airport catchment) | ¥25,580 | +41.8% | ¥7,502 | +4.2% | 86.1% | 31 / 20 |
| Kanazawa | ¥22,136 | +6.1% | ¥9,545 | +2.3% | 88.4% | 252 / 117 |
| Kaga (Kaga Onsen Village) | ¥49,570 | -0.2% | ¥19,137 | -7.8% | 86.1% | 58 / 45 |
| Hakusan | ¥21,513 | -4.1% | ¥8,768 | +11.6% | 93.5% | 34 / 17 |
Recovery Nanao (Wakura Onsen)
Listed prices +34.1%, the largest gain in the prefecture. The number of properties observed also rose, from an average of 33 in January–July 2025 to 42 in 2026, and estimated OCC hit 95.9% in August, the highest in Ishikawa. Reopenings are progressing, but supply has yet to catch up with returning demand.
Expansion Komatsu (airport catchment)
Listed prices +41.8%. Backed by airport access and an industrial cluster, a 171-room business hotel with hot-spring facilities opened in July 2026. Properties observed rose from 25 to 31, so the market itself is growing. How rates diverged across Komatsu, Kanazawa, Fukui and Tsuruga after the Tsuruga extension is set out in Hokuriku Shinkansen Year 3: Fukui, Tsuruga, Komatsu & Kanazawa ADR Compared.
Depth Kanazawa
The largest base in the prefecture at 252 properties. Listed prices +6.1% and estimated settled ADR +2.3% — steady — with estimated OCC at 88.4% in August. The volume zone is thick, which leaves white space at the top of the price range (discussed below).
Highest rate Kaga (Kaga Onsen Village)
Listed prices of roughly ¥49,600 are the highest in the prefecture, 2.2 times Kanazawa’s. Year-on-year change, however, is essentially flat. With thick existing stock and stable supply, the main battleground here is succession and repositioning of existing assets rather than new development.
On Nanao’s growth rate, note that the number of properties observed rose from 38 to 42. This is not a simple price increase; it includes a change in the underlying population as reopened properties entered the aggregation. For the same reason, the property count behind estimated settled ADR rose from 11 to 17, so the +9.1% year-on-year figure should be read with a margin. Even so, listed price, settled rate and occupancy all pointing the same way indicates that supply and demand are tightening.
The distribution map shows mid-to-large stock of 80 rooms or more concentrated in three poles: central Kanazawa, Kaga Onsen Village (Katayamazu, Yamashiro, Yamanaka) and Wakura Onsen. Almost no mid-to-large properties remain at the tip of the Noto Peninsula (Wajima and Suzu), and even including Noto Town and Shika Town the picture is one of scattered points. Lodging capacity in the northern half of the peninsula remains substantially below its pre-earthquake level.
Site Assessment — Land Prices and the Demand Base Around Kanazawa Station
| Property type | Properties | Rooms | Est. OCC (Aug 2026) |
|---|---|---|---|
| All properties | 376 | 20,266 | 86.0% |
| Business hotel | 103 | 12,508 | 86.4% |
| Ryokan | 104 | 4,137 | 84.7% |
| City hotel | 10 | 1,748 | 85.7% |
| Resort hotel | 10 | 508 | 90.2% |
Estimated OCC for August 2026 was 86.0% across all properties, 86.4% for business hotels and 84.7% for ryokan — small differences between types. Inventory is being absorbed regardless of format at the summer peak, which indicates a broad demand base. For the prefecture as a whole, June and July stood at 79.7% and 80.2% respectively, so the gap between peak and normal periods is not extreme either. Occupancy is underpinned throughout the year, and that is a material input for investment decisions in a regional market.
On the revenue side, another characteristic is the relatively high value added by breakfast. Comparing room-only and breakfast-inclusive plans within the same property (paired analysis), the breakfast premium was +12.3% (about ¥2,400, N=49 properties) across Ishikawa, and +14.6% (about ¥2,800, N=32 properties) in Kanazawa alone. Breakfast built on Hokuriku ingredients functions as a revenue layer distinct from room rate.
Supply Pipeline — 12 to 27 New Openings a Year
New openings ran at 24 properties / 323 rooms in 2023, 17 / 274 in 2024, 27 / 513 in 2025 and 12 / 259 in 2026. The 2026 figure, however, is still being observed. Because OTA listings appear only a few months ahead of opening, openings in the second half of the year and beyond will accumulate in later listings. The current 12 properties should be read as a floor. On how long it takes newly opened properties to catch up to prevailing rate levels, our analysis of 182 Japanese openings found a median of roughly two months — a useful benchmark when building ramp-up into a business plan.
Scale per property is small. The 27 properties and 513 rooms of 2025 average 19 rooms, and small formats — rental villas, machiya townhouses and guesthouses — account for most of the count. Within that, 2025 nonetheless saw a run of sizeable openings: 101 rooms in Yamanaka Onsen, 101 rooms in Wakura Onsen, 81 rooms in front of Kanazawa Station and 69 in Katamachi, and 65 rooms in Komatsu. In July 2026 a 171-room select-service hotel with hot-spring facilities opened in Komatsu — among the largest single openings in the prefecture in recent years. That a major operator committed rooms in Komatsu, with its airport and industrial cluster, reads as a signal of how operators assess Hokuriku’s weekday demand.
The planned pipeline on a building-confirmation basis, by contrast, is thin. Only one lodging construction plan can be confirmed in Ishikawa (Komatsu, 171 rooms, completed July 2026). This is a building-confirmation basis as of the survey date, and counts and room numbers are expected to rise as further applications are filed; it should be referenced as the floor of the currently confirmed pipeline. Because confirmation applications are typically filed one to two years before opening, supply from 2028 onward has yet to appear in the numbers.
Even so, the fact that confirmed new supply sits at this level against 86% occupancy means that the scarcity of existing stock will persist for some time. Rising construction costs reinforce it. Based on the Ministry of Land, Infrastructure, Transport and Tourism’s Statistics on Building Construction Starts, 2024 hotel construction cost averaged ¥1.950 million per tsubo across all structures (reinforced concrete ¥1.736 million, steel ¥1.648 million), up 41% in two years from ¥1.38 million in 2022. In 2025, record levels continued at ¥2.405 million for steel and ¥2.026 million for reinforced concrete. The higher the hurdle for new build, the stronger the position of existing assets running at pinned occupancy.
Noto — Reconstruction Investment Subsidies as a Local Variable
The Noto area carries a variable absent from investment decisions in other prefectures. For recovery from the 2024 Noto Peninsula Earthquake and the Oku-Noto floods, Ishikawa Prefecture created the Noto Lodging Industry Reconstruction Investment Subsidy. It offers a 20% subsidy rate with a ¥500 million cap, covering nine municipalities: Nanao, Wajima, Suzu, Hakui, Shika, Hodatsushimizu, Nakanoto, Anamizu and Noto. A 20% subsidy on new construction, rebuilding or major renovation of lodging facilities effectively shortens the payback period.
On the supply side, a prefectural survey of lodging facilities in six Noto-area municipalities as of December 2025 found that only 55% of pre-earthquake properties were operating. The number of listed properties we observe in Nanao has likewise recovered, from an average of 33 in January–July 2025 to 42 in 2026, but a large gap remains. In Wakura Onsen, a long-established ryokan has announced plans to open a new roughly 50-room property in winter 2026, and other properties in the same group aim to resume operations during fiscal 2026. The pattern of demand returning first and supply catching up later is what shows through in Nanao’s estimated OCC of 95.9% for August 2026 (estimated on an OTA-listed-inventory basis). Of the 19 ryokan in Wakura Onsen, 11 had reopened as of our latest property-by-property count.
Positioning — White Space in Kanazawa’s Upper Price Band
Next we plot individual properties on two axes: room count and estimated settled ADR. The set covers the 89 properties with 40 or more rooms for which estimated settled ADR can be calculated.
The plot shows the market splitting into two clusters. The Kanazawa group (blue) has a median room count of 166.5 against a median estimated settled ADR of about ¥8,800 — wide horizontally and pinned to the bottom. The hot-spring group centered on Kaga and Wakura (navy) sits at a median of 110.5 rooms and about ¥17,600, roughly twice Kanazawa’s rate band.
What stands out is the empty space above Kanazawa. Within the 60–260 room range, only five properties clear ¥15,000 in estimated settled ADR, while 45 sit below ¥15,000. Across the prefecture as a whole, properties above ¥20,000 are concentrated in hot-spring ryokan, and very few urban properties reach the upper price band. Kanazawa, a genuine demand center, is structurally short of upper-band urban rooms — the clearest white space observed in this analysis.
Crowded The occupied zone
Estimated settled ADR ¥5,000–¥13,000 × 60–300 rooms
Select-service properties around Kanazawa Station and Korinbo cluster here. Occupancy is high, but the zone tips easily into rate competition and is hard to differentiate on entry.
White space 1 Urban upper-midscale
Estimated settled ADR ¥15,000–¥25,000 × 60–150 rooms
Five properties in Kanazawa qualify. With the new Golden Route taking hold among inbound travelers, the demand base is broadening while the number of properties in this band remains limited.
White space 2 Mid-scale rebuilds in Noto
Estimated settled ADR ¥15,000–¥30,000 × 40–100 rooms
Against Nanao’s estimated OCC of 95.9% as of August 2026 (same basis as above), stock of 80 rooms or more is limited. The reconstruction investment subsidy (20% rate, ¥500 million cap) lifts the effective yield.
What Guest Ratings Say About Product Strength
Whether the price gap can be filled depends on whether the market can build a product that earns high ratings. Aggregating guest reviews, Ishikawa’s “food” score has a property median of 4.41 (N=131 properties / 19,473 reviews, most recent 24 months) — a high level. Individually, small ryokan and cuisine-focused ryokan in Kanazawa and inns in Noto score in the 4.8 range for food, well above the prefecture average.
In cleanliness, relatively new urban hotels in Kanazawa occupy the top places. Hyatt Centric Kanazawa (ハイアット セントリック 金沢) scores 4.91 (N=183 reviews), Uan Kanazawa (雨庵 金沢) 4.88 (N=104), Kanazawa Sainoniwa Hotel (金沢 彩の庭ホテル) 4.86 (N=297) and Tokyu Stay Kanazawa (東急ステイ金沢) 4.78 (N=216) — each more than 0.6 above the area median. That urban product capable of earning high ratings in the upper price band works in Kanazawa is already demonstrated. White space 1 is empty not for lack of demand, but simply because the number of properties is small.
Development Scenarios — Comparing Three Archetypes
On the basis of the observations above, we model three investment archetypes plausible in Ishikawa. They are compared on GOP (Gross Operating Profit — operating-stage profit after departmental and administrative expenses, before rent, depreciation and interest) margin and on GOP yield, that profit divided by total investment. All are simplified estimates; an actual investment decision requires a detailed feasibility study.
| Item | A. Kanazawa, select-service (new build) | B. Kanazawa, upper-midscale (new build) | C. Noto, acquisition and renovation of an existing ryokan |
|---|---|---|---|
| Rooms | 140 | 80 | 60 |
| Area per room | 18 m² | 26 m² | Existing |
| Estimated settled ADR assumption | ¥10,500 | ¥18,000 | ¥20,000 |
| Occupancy assumption | 85% | 82% | 70% |
| GOP margin assumption | 55% | 45% | 15% |
| Construction cost (2025 actuals basis) | ¥2.05m per tsubo | ¥2.40m per tsubo | Renovation ¥6m per room |
| Construction cost (after inflation adjustment) | ¥2,655m | ¥2,908m | ¥288m (after subsidy) |
| Land / acquisition cost | ¥210m | ¥228m | ¥500m |
| Total investment | ¥2,865m | ¥3,135m | ¥788m |
| Annual revenue (rooms only) | ¥456m | ¥431m | ¥307m |
| GOP | ¥251m | ¥194m | ¥46m |
| GOP yield | 8.8% | 6.2% | 5.8% |
The implication is clear. Case A (select-service) leads on yield, but this is a zone where 45 properties already cluster, so it means entering a competitive environment on both occupancy and rate. Case B (upper-midscale) trails on yield but faces only five competitors. Its 6.2% depends entirely on whether an estimated settled ADR of ¥18,000 can actually be achieved — a level only five properties in Kanazawa reach today. Conversely, if it is achieved, competition is thin.
Case C (acquiring and renovating an existing ryokan) requires an order of magnitude less total investment, and the subsidy lifts the effective yield. That said, GOP margins in the ryokan format are structurally low (an industry benchmark of 5–15%), and staffing and food costs drive the result. Put another way, it is also the archetype with the most headroom for operational improvement.
Sensitivity Analysis (Case B)
| Scenario | Base case | ADR −10% | OCC −5pt | Both |
|---|---|---|---|---|
| Estimated settled ADR | ¥18,000 | ¥16,200 | ¥18,000 | ¥16,200 |
| Occupancy | 82% | 82% | 77% | 77% |
| Annual revenue | ¥431m | ¥388m | ¥405m | ¥364m |
| GOP | ¥194m | ¥175m | ¥182m | ¥164m |
| GOP yield | 6.2% | 5.6% | 5.8% | 5.2% |
Case B holds 5.2% even on the downside. That the yield stays above 5% in the stress case, where ADR and OCC fall together, reflects construction costs already being priced in at a high level — which means, conversely, that the upside comes down to how far land acquisition cost can be contained. With land prices in front of Kanazawa Station rising for a fourth consecutive year, choosing a site away from the immediate station area will determine the effective yield.
Risk Factors and the Order of Judgment
| Category | Description | Observation in this article |
|---|---|---|
| Demand | Concentration of dependence on inbound travel | Since the Hokuriku Shinkansen extension to Tsuruga (March 2024), the so-called new Golden Route has taken hold. Ishikawa recorded all-time highs in both visitor numbers and overnight stays in 2024. The concentration is a tailwind, but it is also the flip side of dependence on a single route |
| Supply | Rising construction costs | 2025 steel construction at ¥2.405m per tsubo. A brake on new entry, and a tailwind for existing stock |
| Land | Rising land prices in front of Kanazawa Station | A fourth consecutive year of increases, the highest level across the five Hokushinetsu prefectures. Competition for hotel sites is the main driver |
| Rate | Slow growth in settled rates | Estimated settled ADR for January–July 2026 was +2.1% year on year. Business plans that price in aggressive ADR growth carry downside risk |
| Disaster | Pace of recovery in Noto | As of December 2025, operating properties across the six Noto municipalities stood at 55% of pre-earthquake levels. The reconstruction investment subsidy (20% rate, ¥500 million cap) supports payback |
| Staffing | Securing operational staff | GOP margins in the ryokan format are structurally low at an industry benchmark of 5–15%. The operating setup drives the result |
In terms of the order of judgment, the starting point is not to assume rate growth. Ishikawa’s estimated settled ADR was +2.1% year on year in January–July 2026, and by property type it is essentially flat. Occupancy, meanwhile, reached 86.0% in August and 95.9% in Nanao, and confirmed new supply is limited. Feasibility is therefore better assessed not on ADR growth but on “is this a site that can run at high occupancy from year one?” and “how many competitors sit in that price band?”
Seen through that lens, the fact that only five properties in Kanazawa sit above ¥15,000 in estimated settled ADR, and the fact that Nanao’s estimated OCC of 95.9% as of August 2026 (same basis) is met with limited stock of 80 rooms or more, are both quantitatively confirmable white spaces. Kaga Onsen Village holds the highest rate level in the prefecture but has stopped growing, so the opportunity there leans toward succession and repositioning of existing assets rather than new development. Komatsu is in an expansion phase driven by its airport and industrial cluster, and the 171-room opening in July 2026 reads as a signal confirming that direction.
⚠ Note on ADR for future dates: the price metrics in this article are estimates based on sale prices published on OTAs as of the survey date, and they change as the check-in date approaches. Prices set high at present may fall through last-minute discounting. Monthly data from August 2026 onward are estimates on a listing-snapshot basis, not confirmed actuals. Year-on-year comparisons are made over January–July 2026 (historical basis), where the basis is consistent.
On methodology: price and occupancy data are aggregated within the scope MetroEngines Research tracks. MetroEngines Research follows approximately 168,000 properties in Japan, of which roughly 27,000 properties and about 1.26 million rooms with confirmed activity on OTAs form the analysis set. Ryokan, minshuku and simple lodgings not listed on OTAs are not included. New-opening data are on an OTA-listing basis, and because listings appear several months before opening, the most recent periods onward will rise as further listings appear. Construction plan data are on a building-confirmation basis; counts are expected to rise as further applications are filed, and the figure is the floor of the currently confirmed pipeline.
Related reading
- Wakura Onsen Noto Recovery Hotel Investment 2026: Hokuriku Polarization Deep Dive
- Hokuriku Shinkansen Year 3: Fukui, Tsuruga, Komatsu & Kanazawa ADR Compared
- Does New Hotel Supply Cut ADR? Only Below 13,000 Rooms, 47 Prefectures
References and Sources
■ Data sources
Listed price (all-plan average) and estimated settled ADR are monthly aggregations of publicly listed OTA prices (Ishikawa N=473 properties / 239 properties, January–July 2026 average). Estimated OCC is an estimate based on the absorption of OTA-listed inventory (August 2026, N=376 properties / 20,266 rooms). New openings are on an OTA-listing basis; construction plans are on a building-confirmation basis. Guest ratings are aggregated from reviews over the most recent 24 months (food: N=131 properties / 19,473 reviews). The breakfast premium is a paired comparison of room-only and breakfast-inclusive plans within the same property (N=49 properties; Kanazawa N=32 properties). All aggregated by MetroEngines Research & Consulting.
■ Estimate assumptions
The three development archetypes are: A = 140 rooms, 18 m² per room, estimated settled ADR ¥10,500, occupancy 85%, GOP margin 55%; B = 80 rooms, 26 m², ¥18,000, 82%, 45%; C = renovation of an existing 60-room property, ¥20,000, 70%, 15%. Annual revenue is calculated as “estimated settled ADR × rooms × occupancy × 365” and covers room revenue only, excluding ancillary and other departments. Construction cost is based on the Ministry of Land, Infrastructure, Transport and Tourism’s Statistics on Building Construction Starts, 2025 (steel ¥2.405m per tsubo, reinforced concrete ¥2.026m per tsubo), compounded to the mid-point of construction using Turner & Townsend’s construction cost forecast (2026 +5.3%, 2027 +5.0%, 2028 +4.5%), giving a factor of 1.155. GOP margins are set conservatively with reference to Invincible Investment Corporation’s actual 38.9% across 91 operated properties (fiscal period ended December 2024) and to typical benchmarks by property type. Renovation cost in Case C is after applying the Noto Lodging Industry Reconstruction Investment Subsidy (20% rate). The sensitivity analysis holds total investment and GOP margin fixed and varies ADR −10% and OCC −5pt individually and together, as a simplified estimate.
■ Limitations and caveats
Estimated settled ADR applies property-type correction coefficients to the lowest listed OTA plan level; cross-checked against property-level disclosures by listed hotel REITs (91 properties, most recent three months), the median error is approximately 7%. It differs from each property’s actual transaction prices and accounting figures. Estimated OCC is an estimate on an OTA-listed-inventory basis and differs from each property’s true overall occupancy. Year-on-year changes by municipality include variation in the number of properties observed (a change in the underlying population); the turnover from reopenings is particularly large on the Noto side. Construction plans are a floor figure on a building-confirmation basis, and supply from 2028 onward does not appear in the numbers. All estimates in this article are simplified; an actual investment decision requires a property-specific feasibility study.
■ Market data
- MetroEngines Research & Consulting — listed price and estimated settled ADR (Ishikawa N=473 properties / 239 properties, January–July 2026), estimated occupancy (August 2026, N=376 properties / 20,266 rooms), new-opening data (OTA-listing basis), paired analysis of the breakfast premium (N=49 properties)
- HotelBank Editorial Team research — aggregation of guest reviews (Ishikawa “food,” N=131 properties / 19,473 reviews, most recent 24 months)
■ Government statistics and public data
- Ministry of Land, Infrastructure, Transport and Tourism, “Statistics on Building Construction Starts” (construction cost per tsubo; lodging construction plans)
- Ministry of Internal Affairs and Communications / Ministry of Economy, Trade and Industry, “Economic Census — Basic Survey of Business Activity” (boundaries = 2020 Population Census small areas)
- Ishikawa Prefecture, “Status of Lodging Facilities” (recovery and reconstruction promotion)
- Ishikawa Prefecture, Department of Culture, Tourism and Sports, “Ishikawa Tourism in Statistics (Reiwa 6 / 2024)”
- Japan Tourism Agency, selection results for the Tourism Revitalization Support Program for Recovery from the Noto Peninsula Earthquake (2026)
- City of Kanazawa, “Sustainable Tourism Promotion Plan 2026”
■ Industry reports and corporate materials
- Invincible Investment Corporation — GOP results for operated hotels (fiscal period ended December 2024, 91 properties, 38.9%)
- JLL, “Japan Hotel Investment Market 2025” (GOP outlook and new supply rate)
- Bank of Japan Kanazawa Branch, “A Review of Inbound Tourism in the Hokuriku Region and Some Perspectives” (17 April 2026)
- Hyatt Japan K.K., “Press Materials, April 2026”
■ News coverage
- Kanko Keizai Shimbun, “Ishikawa Prefecture launches Noto lodging industry reconstruction investment subsidy: nine municipalities, 20% subsidy rate, up to ¥500 million”
- Nikkei, “Kagaya on the Noto Peninsula to resume operations in winter 2026 with a newly built ryokan”
- Nikkei, “Lodging facilities multiply along the Kanazawa–Tsuruga Shinkansen extension to maximize the opening effect”
- “Kanazawa hotel sites drive up official land prices; Ishikawa overall continues to rise” (2026 official land price coverage)
- NHK, “Lodging facility operations in the Noto region at 55% of pre-earthquake levels”
- Japan Railway Construction, Transport and Technology Agency, “Hokuriku Shinkansen (Kanazawa–Tsuruga)”
Source: Hyatt Japan K.K., “Press Materials, April 2026”