

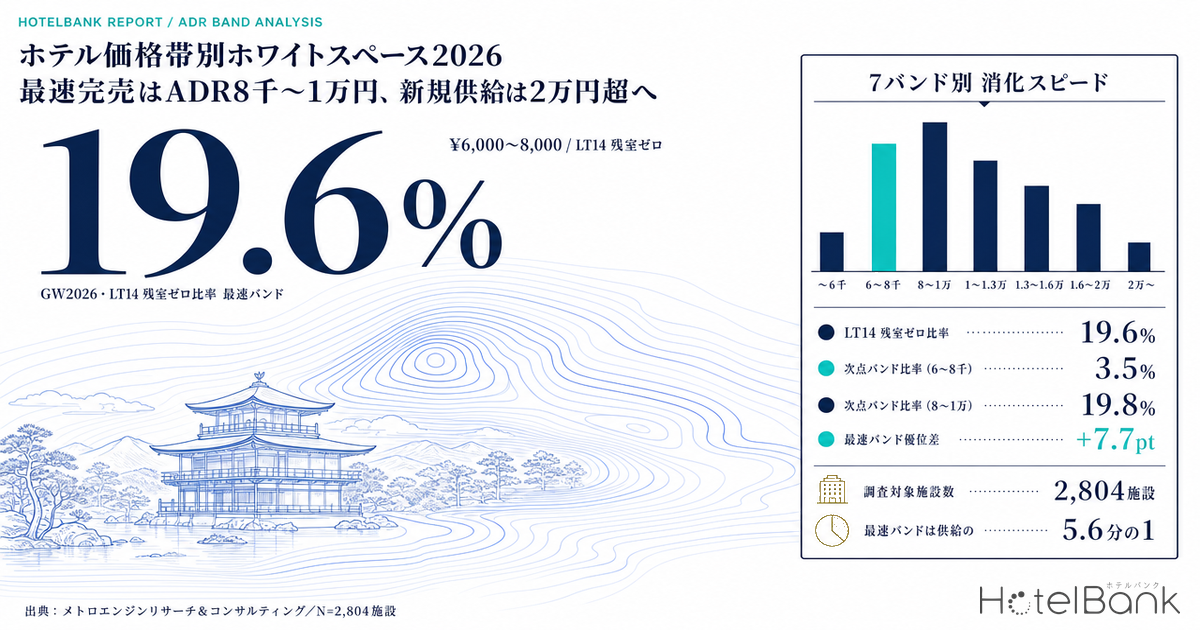
Slice Japan’s hotel market by price band rather than by prefecture, and the way demand arrives looks like a completely different picture. This article sorts business hotels and city hotels nationwide into seven price bands (ADR bands) using estimated settled ADR, then compares how fast room inventory is absorbed within each band on confirmed peak dates. The unit of analysis is neither the prefecture nor the municipality — it is the price band itself.
Every whitespace analysis HotelBank has published so far — Nishimikawa, the four cities of eastern Shizuoka, the Amami Islands — was built the same way: carve out an area geographically first, then look at the price tiers inside it. Geography was the subject, the price band the predicate. This article inverts that. We divide the whole country by price band first, and read geography afterwards as the content of each band. Prefecture-level tier structures are therefore not repeated here. The intended readers are chain development teams deciding which price band to enter, asset managers weighing the repositioning of existing properties, and investors building a pricing strategy for a new entry.
Metric Definitions Used in This Article
- ADR (average daily rate): an estimated settled rate (tax-excluded equivalent) derived by applying a segment-specific adjustment factor to the lowest published plan level each property lists on OTAs and similar channels (double occupancy, per-room rate, tax included). Cross-checked against property-level results disclosed by listed hotel REITs (91 properties, most recent 3 months), the median error is approximately 7%. These are estimates and differ from each property’s actual transacted rates and accounting figures. The “ADR bands” in this article are assigned using the median estimated settled ADR across confirmed months from September 2025 to August 2026 (6 or more valid months).
- OCC (occupancy rate): sold rooms as a share of total rooms in the area (an estimate based on OTA sales inventory). Used only for band-level and area-level aggregates, never for individual properties.
- LT (lead time): days remaining until the check-in date. LT0 = same day.
- Early sell-out LT: the lead time at which remaining rooms first reached zero (a larger value means an earlier sell-out). Days sold out observed: the cumulative number of days on which zero remaining rooms was confirmed during the observation period.
- Maximum inventory listing ratio: the maximum number of rooms listed simultaneously on OTAs during the observation period, as a share of that property’s total room count. Every extraction in this article is limited to properties at 30% or above.
- Data source: MetroEngines Research & Consulting
- — ¥6,000–10,000 is the band that fills fastest. On the main Golden Week snapshot (2026-05-03), the share of properties with zero remaining rooms at LT14 was 19.6% for ¥6,000–8,000 and 17.3% for ¥8,000–10,000 (N=2,804 properties).
- — Absorption breaks at ¥13,000. The same ratio across the three bands at ¥13,000 and above is 4.5% — roughly one-third of the 17.3% recorded by the sub-¥10,000 zone (2026-05-03, facility-count weighted).
- — The ranking is stable across all three snapshots; the size of the gap is not. Low-to-mid bands sit on top on 5/3, 5/4 and 8/13 alike, but the multiple between the two zones narrows from 3.87x to 1.95x.
- — 19.8% of newly supplied rooms sit above ¥20,000 (existing stock: 12.1%, +7.7pt). Based on 529 properties and 59,184 rooms opened between 2024 and 2026.
- — Demand, thin supply and rate upside sit in three different bands. The fastest to fill is ¥6,000–10,000; supply is thinnest at ¥13,000–16,000 (6.2% of new rooms vs 12.3% of existing); the push for rate is at ¥20,000 and above.
Conclusion — ¥6,000–10,000 fills fastest, while 19.8% of new rooms flow above ¥20,000
Start with the conclusion. Taking the peak day of Golden Week 2026 (May 3) as the snapshot and sorting 2,804 business and city hotels nationwide into seven bands by estimated settled ADR, the share of properties already at zero remaining rooms 14 days before check-in reaches 19.6% in the ¥6,000–8,000 band and 17.3% in the ¥8,000–10,000 band, then falls to 4.5% at ¥13,000–16,000 and 3.5% at ¥20,000 and above. Splitting the very same national market by price band alone produces a three- to five-fold spread in how peak demand arrives.
Supply, meanwhile, is pointing somewhere else. Across the 529 business and city hotels — 59,184 rooms — that opened between 2024 and 2026, the ¥20,000-and-above band accounts for 19.8% of new rooms. That band holds 12.1% of rooms in existing stock, so new rooms are skewed 7.7 points toward the higher-rate side. In the opposite direction, ¥13,000–16,000 falls to 6.2% of new rooms against 12.3% of existing stock — supply thins out by half. The band that fills earliest and the band where rooms are being added the fastest are, right now, not the same band.
Measuring absorption speed across seven ADR bands — the zero-room share at LT14
First, a word on how the metric is set. Measure peak-day supply and demand by “did it fill in the end,” and busy dates such as Golden Week or Obon push nearly every band up against the ceiling, erasing the differences. Indeed, aggregating our estimated occupancy (OTA-listed-inventory basis) nationwide on a room-count-weighted basis gives 97.2% for May 3 and 95.6% for May 4, with almost no gap between business hotels (97.3% / 95.6%) and city hotels (97.1% / 95.7%). What happens at the peak shows up not in whether rooms filled, but in when they filled.
The primary metric here is therefore “the share of properties at zero remaining rooms as of 14 days before check-in (LT14).” That metric separates properties that sold out two weeks early from those that scraped in at the last minute, even when both end up full by the arrival date. As secondary metrics we report the share of properties observed at zero remaining rooms at least once during the period (sell-out observation rate), the median lead time at which remaining rooms first hit zero (early sell-out LT), and the median cumulative number of days at zero remaining rooms (days sold out observed). Note that estimated occupancy and sell-out observation can diverge within the same market: a market can post high estimated occupancy while relatively few properties ever reach zero remaining rooms, because inventory is absorbed thinly across many properties rather than concentrated into early sell-outs.
All three snapshots trace the same shape. Across the two Golden Week days the ¥6,000–10,000 zone forms the peak; on Obon (August 13) the peak broadens one band further down, to below ¥6,000. What they share is a clear drop in absorption speed once you pass ¥13,000. It is not a gentle decline band by band — it breaks at the ¥10,000–13,000 boundary.
| ADR band | N (5/3) | Zero rooms LT14 5/3 | Zero rooms LT14 5/4 | Zero rooms LT14 8/13 | Median OCC at LT14 | Sell-out observation rate | Early sell-out LT median | Days sold out median | Rooms median |
|---|---|---|---|---|---|---|---|---|---|
| Under ¥6,000 | 334 | 12.1% | 5.0% | 17.2% | 93.8% | 20.4% | 19 | 14 | 45 |
| ¥6,000–8,000 | 765 | 19.6% | 8.8% | 11.5% | 93.5% | 42.9% | 18 | 10 | 78 |
| ¥8,000–10,000 | 478 | 17.3% | 9.6% | 11.0% | 88.8% | 52.5% | 13 | 7 | 109 |
| ¥10,000–13,000 | 489 | 9.9% | 4.4% | 6.9% | 83.9% | 46.0% | 2 | 2 | 119 |
| ¥13,000–16,000 | 317 | 4.5% | 2.4% | 6.8% | 81.2% | 45.1% | 0 | 1 | 130 |
| ¥16,000–20,000 | 154 | 6.1% | 3.9% | 5.1% | 83.2% | 38.3% | 4 | 2 | 127 |
| ¥20,000 and above | 267 | 3.5% | 1.7% | 6.8% | 85.3% | 29.2% | 1 | 2 | 120 |
The secondary metrics point the same way. The share of properties observed at zero remaining rooms at least once is highest in the ¥8,000–10,000 band at 52.5%, and only 29.2% at ¥20,000 and above. The median lead time at which rooms first hit zero is 19 days out below ¥6,000, 18 days out at ¥6,000–8,000 and 13 days out at ¥8,000–10,000, against 0–4 days out for all three bands at ¥13,000 and above. Low-to-mid bands close their inventory more than two weeks ahead; high bands are still moving rooms right up to arrival.
The curves make the gap even clearer. At 30 days out, median occupancy in every band sits within a 63–75% range — the starting points are essentially level. By 14 days out, however, ¥6,000–8,000 has climbed to 93.5% while ¥13,000–16,000 is still at 81.2%. The separation happens in the final 30 days, and above all in the two weeks from 30 days out to 14 days out. Over that stretch the low-to-mid bands push out nearly all of their remaining rooms, while the high bands are still holding inventory three days before arrival.
Price band first, geography second — within ¥6,000–10,000, Nagano is at 40.7% and Osaka at 1.0%
This is the core of the article’s design. Fix the band first, and geography emerges as the “content” of that band. The table below shows the leading prefectures making up each band.
| ADR band | N (5/3) | Top three prefectures (properties) |
|---|---|---|
| Under ¥6,000 | 334 | Kagoshima 27, Fukushima 22, Ibaraki 19 |
| ¥6,000–8,000 | 765 | Ibaraki 44, Aichi 40, Shizuoka 39 |
| ¥8,000–10,000 | 478 | Osaka 65, Aichi 40, Hokkaido 37 |
| ¥10,000–13,000 | 489 | Tokyo 104, Osaka 52, Aichi 37 |
| ¥13,000–16,000 | 317 | Tokyo 132, Osaka 31, Fukuoka 26 |
| ¥16,000–20,000 | 154 | Tokyo 59, Kyoto 20, Fukuoka 15 |
| ¥20,000 and above | 267 | Tokyo 121, Kyoto 41, Fukuoka 21 |
Price band predicts the character of geography with considerable accuracy. Below ¥6,000 and at ¥6,000–8,000 the mix is dominated by small and mid-sized properties in regional Japan — Kagoshima, Fukushima, Ibaraki, Shizuoka, Hokkaido (median room count 45–78) — while at ¥8,000–10,000 the lead role passes to urban business hotels in Osaka, Aichi and Hokkaido (median 109 rooms). Above ¥13,000 Tokyo’s weight rises sharply, and at ¥20,000 and above, Tokyo’s 121 properties and Kyoto’s 41 make up about 60% of the band. In other words, the observation that “demand in the high bands is sluggish” can be close to synonymous with the observation that “Golden Week demand in Tokyo and Kyoto is sluggish.” Price band and geography are not independent.
To separate that confounding, we ran the same aggregation for the country excluding Tokyo. Even so, the sell-out observation rate still peaks at 43.2% for ¥6,000–8,000 and 53.0% for ¥8,000–10,000, and falls to 28.1% at ¥20,000 and above. Median early sell-out LT likewise holds the same gradient as the national figure — 18 days out at ¥6,000–8,000, 14 days out at ¥8,000–10,000 and 3 days out at ¥20,000 and above. The pattern also holds inside a single market: in Aichi, the sell-out observation rate for ¥8,000–10,000 reached 72.5% (N=40), far above the same prefecture’s ¥6,000–8,000 band (37.5%, N=40). The shape of the band curve cannot be explained by Tokyo’s weight alone.
Within a single band, on the other hand, geography matters a great deal. Break the fastest zone (¥6,000–10,000) down by prefecture and the zero-room share at LT14 is led by Ehime at 72.7%, Yamanashi at 54.5%, Yamaguchi at 42.9%, Nagasaki at 41.7% and Fukuoka at 40.9%, followed by Nagano at 40.7%, Gifu at 30.4%, Fukushima at 28.1%, Tochigi at 27.8% and Shizuoka at 26.7% — prefectures containing leisure destinations and regional hub cities cluster at the top. At the very same price band, Osaka sits at 1.0% and Hyogo at 5.9%. The structure is two-layered: the price band sets how demand arrives, and geography sets how concentrated it is.
| Prefecture | Properties | Total rooms | Zero rooms at LT14 | Median OCC at LT14 |
|---|---|---|---|---|
| Ehime | 12 | 1,477 | 72.7% | 100.0% |
| Yamanashi | 13 | 1,041 | 54.5% | 100.0% |
| Yamaguchi | 14 | 1,659 | 42.9% | 97.8% |
| Nagasaki | 17 | 1,563 | 41.7% | 98.7% |
| Fukuoka | 22 | 3,575 | 40.9% | 98.0% |
| Nagano | 32 | 2,449 | 40.7% | 98.0% |
| Shiga | 13 | 916 | 40.0% | 97.3% |
| Hiroshima | 22 | 2,445 | 33.3% | 98.6% |
| Gifu | 27 | 2,824 | 30.4% | 97.4% |
| Kyoto | 24 | 3,397 | 30.4% | 87.5% |
| Fukushima | 41 | 3,902 | 28.1% | 97.7% |
| Tochigi | 39 | 3,581 | 27.8% | 93.8% |
This distribution is consistent with travel trends for Golden Week 2026. JTB estimated that total traveler numbers rose slightly, to 101.9% of the prior year, while average spend per person fell to ¥46,000 (97.9% year on year), with more travel staying within the traveler’s own region — shorter distances, shorter stays and greater use of private cars. In a year when short-haul, lower-spend demand thickens, the rooms that demand touches first are in the mid band and below, and the pressure shows up most strongly in regional prefectures close to leisure destinations. The observation and that explanation do not contradict each other.
Where supply is heading — 19.8% of new rooms above ¥20,000, ¥13,000–16,000 cut in half
With the demand-side gradient established, lay the direction of supply on top of it. Of the 713 business and city hotels that opened between 2024 and 2026, the 529 properties and 59,184 rooms for which we could fix an estimated settled ADR on a 12-month basis were sorted into the same seven bands and compared against the room share of existing stock (this article’s analysis universe of 4,650 properties and 532,682 rooms).
| ADR band | Existing properties | Existing rooms | Existing room share | New properties | New rooms | New room share | Difference |
|---|---|---|---|---|---|---|---|
| Under ¥6,000 | 624 | 38,727 | 7.3% | 67 | 4,173 | 7.1% | -0.2pt |
| ¥6,000–8,000 | 1356 | 130,528 | 24.5% | 159 | 15,782 | 26.7% | +2.2pt |
| ¥8,000–10,000 | 813 | 99,670 | 18.7% | 90 | 11,272 | 19.0% | +0.3pt |
| ¥10,000–13,000 | 728 | 96,084 | 18.0% | 72 | 9,729 | 16.4% | -1.6pt |
| ¥13,000–16,000 | 455 | 65,549 | 12.3% | 36 | 3,650 | 6.2% | -6.1pt |
| ¥16,000–20,000 | 257 | 37,772 | 7.1% | 27 | 2,868 | 4.8% | -2.3pt |
| ¥20,000 and above | 417 | 64,352 | 12.1% | 78 | 11,710 | 19.8% | +7.7pt |
Three things stand out. First, the ¥20,000-and-above band holds 19.8% of new rooms against 12.1% of existing rooms — 7.7 points thicker. On a property-count basis it is 14.7% new against 9.0% existing. Second, ¥13,000–16,000 falls to 6.2% of new rooms against 12.3% of existing, thinning to roughly half its weight in supply. Third, the fastest-filling ¥6,000–10,000 zone stands at 45.7% of new rooms against 43.2% of existing — essentially flat. Supply is not putting any particular weight behind the band where demand is absorbed fastest. How this added supply feeds back into rates varies with the size of the prefecture, a question we tested across all 47 prefectures in Does New Hotel Supply Cut ADR?
By year of opening, the share above ¥20,000 rises gradually on a property-count basis: 13.7% for 2024 openings, 15.2% for 2025 and 16.7% for 2026. That said, only 54 properties opening in 2026 have a determinable ADR, so this annual series alone cannot establish a trend. OTA listings appear only a few months before opening, which means observation for the most recent years is still incomplete and counts will rise as further listings appear.
Sensitivity of the conclusion — dispersion across three snapshots, and how far the ranking holds
The conclusions so far rest mainly on the primary Golden Week snapshot (May 3, 2026). Whether a different snapshot yields the same conclusion — and where certainty ends — is checked here using the dispersion across the three snapshots the article already observes. What follows is not a new estimate: it rearranges the existing per-snapshot figures into minimum, median and maximum values. No forecast of future dates is involved.
| ADR band | N (5/3) | Min (3 snapshots) | Median (3 snapshots) | Max (3 snapshots) | Range (max − min) | Rank 5/3 / 5/4 / 8/13 | Rank movement |
|---|---|---|---|---|---|---|---|
| Under ¥6,000 | 334 | 5.0% | 12.1% | 17.2% | 12.2pt | 3 / 3 / 1 | 2 |
| ¥6,000–8,000 | 765 | 8.8% | 11.5% | 19.6% | 10.8pt | 1 / 2 / 2 | 1 |
| ¥8,000–10,000 | 478 | 9.6% | 11.0% | 17.3% | 7.7pt | 2 / 1 / 3 | 2 |
| ¥10,000–13,000 | 489 | 4.4% | 6.9% | 9.9% | 5.5pt | 4 / 4 / 4 | 0 |
| ¥13,000–16,000 | 317 | 2.4% | 4.5% | 6.8% | 4.4pt | 6 / 6 / 6 | 0 |
| ¥16,000–20,000 | 154 | 3.9% | 5.1% | 6.1% | 2.2pt | 5 / 5 / 7 | 2 |
| ¥20,000 and above | 267 | 1.7% | 3.5% | 6.8% | 5.1pt | 7 / 7 / 5 | 2 |
Two things follow. First, the order barely moves. ¥10,000–13,000 is fourth in all three snapshots and ¥13,000–16,000 is sixth in all three, while the top three places are always held by the three bands below ¥10,000. Whichever snapshot you choose, the ordering — low-to-mid bands fill first, above ¥13,000 fills last — does not break down. Second, the single fastest band cannot be pinned down. On the maximum values ¥6,000–8,000 leads (19.6%), on the medians it is under ¥6,000 (12.1%), and on the minimums it is ¥8,000–10,000 (9.6%). The unit this article should settle on as its conclusion is not an individual band but the sub-¥10,000 zone.
| Zone | N (5/3) | 2026-05-03 | 2026-05-04 | 2026-08-13 |
|---|---|---|---|---|
| Under ¥10,000 (3 bands) | 1,577 | 17.3% | 8.2% | 12.6% |
| ¥13,000 and above (3 bands) | 738 | 4.5% | 2.5% | 6.4% |
| Multiple between zones | — | 3.87x | 3.35x | 1.95x |
| Gap between zones | — | 12.8pt | 5.8pt | 6.1pt |
At the zone level, the direction of the gap is consistent across all three snapshots, while the size of the gap changes substantially by snapshot. On the first day of Golden Week (May 3), the sub-¥10,000 zone closes out two weeks ahead at 3.87 times the rate of the ¥13,000-and-above zone; by Obon (August 13) that narrows to 1.95 times. On the Obon snapshot the ¥20,000-and-above band climbs from seventh to fifth (6.8%), landing almost level with ¥13,000–16,000 (6.8%) and ¥10,000–13,000 (6.9%). The step down at ¥13,000 is therefore sharpest at Golden Week and considerably duller at Obon. That the strength of the contrast depends on the character of the demand period is a premise worth holding onto when translating a band strategy into year-round decisions.
One more point: the band assignment itself carries a range. The ADR figures here are estimates, and against property-level disclosure by listed hotel REITs (91 properties, most recent 3 months) the median error is about 7%. Properties near a band boundary may therefore in fact belong to the adjacent band. That effect is relatively larger for the narrower bands (¥8,000–10,000 and ¥10,000–13,000). ¥16,000–20,000, meanwhile, is smaller than the other bands at N=154, and although its three-snapshot range of 2.2pt is the narrowest, its rank moves between fifth and seventh. Figures for that band need to be read with a margin.
Reading the entry opportunity band by band
¥6,000–10,000 — where demand jams up first
The highest share of any band closing out two weeks before the peak date, with the longest median early sell-out LT at 13–18 days out. New rooms hold roughly the same share as existing stock, so supply is not thickening to match the speed of demand. In regional prefectures near leisure destinations — Nagano, Gifu, Fukushima, Tochigi, Shizuoka — the zero-room share at LT14 for this band reaches 27–41%. For an example of the same price-band structure cut at prefecture level, see Miyazaki & Saga Hotel Investment Whitespace.
¥10,000–13,000 — the break point in absorption
A zero-room share at LT14 of 9.9% places it as the hinge between the bands above and below. The mix is urban — Tokyo 104 properties, Osaka 52 — and the properties are larger, with a median of 119 rooms. It is a band with high design freedom, where results turn on which neighbouring band’s characteristics you choose to take on.
¥13,000–16,000 — where supply thins out
A new-room share of 6.2% is half the 12.3% held in existing stock. Peak absorption is not fast, but because almost no new rooms are stacking up in this band, competition grows most slowly here over a multi-year horizon. This is where the room for repositioning existing properties lies.
¥20,000 and above — going after rate upside
19.8% of new rooms are concentrated here, making this the segment where the industry is pushing hardest on rate. Peak-date inventory keeps moving until the last minute, so absorption clusters into the final three days. Locations are narrow — Tokyo 121 properties, Kyoto 41 — leaving room to expand outside those two markets.
Translated into investment language, it comes to this. Demand jams up earliest at ¥6,000–10,000; supply thins out most at ¥13,000–16,000; the push for rate upside is at ¥20,000 and above. That these three sit in three separate bands is this article’s central finding. “Enter the band where demand is fast,” “enter the band where competition is not growing” and “enter the band that captures rate” are not the same decision in Japan’s 2026 market. If development teams decide first which of the three they are aiming at, then choose geography as the content of that band, the reordering should surface candidate sites that an area-first process would not.
Note that these observations are based on three confirmed peak-date snapshots and do not support judgements about future dates such as “it fills early, so we can raise rates.” The purpose is to show relative differences in absorption speed between bands; pricing strategy for any individual property should be considered under the conditions of its own catchment.
Methodology and sources
The scope is business hotels and city hotels nationwide. The snapshots are three confirmed dates: May 3 and May 4, 2026 (Golden Week) and August 13, 2026 (Obon). No future dates are used.
The universe is the 14,891 properties we track — 13,292 business hotels and 1,599 city hotels. Of these, inventory observation data was available for 6,764 properties on the May 3 snapshot, 7,044 on May 4 and 7,870 on August 13. We then applied an extraction condition of a maximum inventory listing ratio of 30% or above (the largest number of rooms simultaneously listed on OTAs during the observation period being at least 30% of total rooms), leaving 2,841 properties for May 3, 3,374 for May 4 and 3,749 for August 13. The condition is applied because at properties that run a deliberately narrow OTA allocation, movements in remaining rooms do not represent the property’s overall supply and demand. A small listing allocation can reflect several things — a channel strategy centred on direct sales through the official site, call centres or travel agencies; an operation that releases inventory in small increments as check-in approaches; or a small contractual OTA allotment — and public information cannot distinguish between them.
Each property’s ADR band was assigned by the median estimated settled ADR across confirmed months from September 2025 to August 2026 (6 or more valid months). Final sample sizes by band on the May 3 snapshot were: under ¥6,000, 334 properties; ¥6,000–8,000, 765; ¥8,000–10,000, 478; ¥10,000–13,000, 489; ¥13,000–16,000, 317; ¥16,000–20,000, 154; and ¥20,000 and above, 267 (2,804 in total — those among the 2,841 properties meeting the extraction condition for which an ADR could be determined). The May 4 snapshot totals 3,335 properties and the August 13 snapshot 3,665. The ¥16,000–20,000 band is small relative to the others at N=154 on the May 3 snapshot, and its figures need to be read with a margin. Prefectural aggregates were limited to prefectures with at least 10 properties in the relevant band.
New supply covers the 713 business and city hotels opened between 2024 and 2026 whose OTA listings we confirmed, of which 529 properties and 59,184 rooms had a determinable estimated settled ADR. Because OTA listings appear only a few months before opening, observation for the most recent years is still in progress and counts will grow over time. The comparison base on the existing-stock side is this article’s analysis universe: 4,650 properties and 532,682 rooms that met the extraction condition on at least one of the three snapshots and had a determinable ADR.
Occupancy figures are our own estimates (OTA-listed-inventory basis), derived from how inventory sold on OTAs is absorbed. They differ from a property’s actual overall occupancy. Occupancy is not calculated for individual properties; every occupancy figure in this article is a band-level or area-level aggregate.
Related Reading
References and Sources
■ Data sources
MetroEngines Research & Consulting: estimated settled ADR (median across confirmed months from September 2025 to August 2026, 6 or more valid months), room inventory movements by lead time, estimated occupancy (OTA-listed-inventory basis), and new-opening data (OTA-listing-confirmed basis). The universe is the 14,891 properties we track — 13,292 business hotels and 1,599 city hotels. National Golden Week occupancy (97.2% on May 3, 95.6% on May 4) was re-aggregated on a room-count-weighted basis across all 47 prefectures, confirming 97.3% / 95.6% for business hotels and 97.1% / 95.7% for city hotels.
■ Calculation assumptions
Only three confirmed dates are used as snapshots (May 3, May 4 and August 13, 2026); no future dates are included. The extraction condition is a maximum inventory listing ratio of 30% or above. The primary metric is the share of properties at zero remaining rooms as of 14 days before check-in, reported alongside the secondary metrics of sell-out observation rate, median early sell-out LT and median days sold out. Zone values are weighted averages by the number of properties in each band (May 3 snapshot). Sensitivity is expressed as the minimum, median and maximum across the three snapshots; it is not a prediction interval derived from a probability distribution.
■ Limitations and caveats
Estimated settled ADR carries a median error of about 7% when checked against property-level disclosure by listed hotel REITs (91 properties, most recent 3 months), so properties near a band boundary may belong to the adjacent band. The ¥16,000–20,000 band is small at N=154 on the May 3 snapshot, and its figures need to be read with a margin. Occupancy is an estimate on an OTA-listed-inventory basis and differs from a property’s actual overall occupancy, so it is used only for band-level and area-level aggregates. This article shows relative differences in absorption speed between price bands; it does not support pricing judgements for individual properties or conclusions about room to raise rates on future dates.
■ Market data
- MetroEngines Research & Consulting — estimated settled ADR, room inventory movements by lead time, estimated occupancy (OTA-listed-inventory basis), new-opening data (OTA-listing-confirmed basis)
■ Industry reports and press