

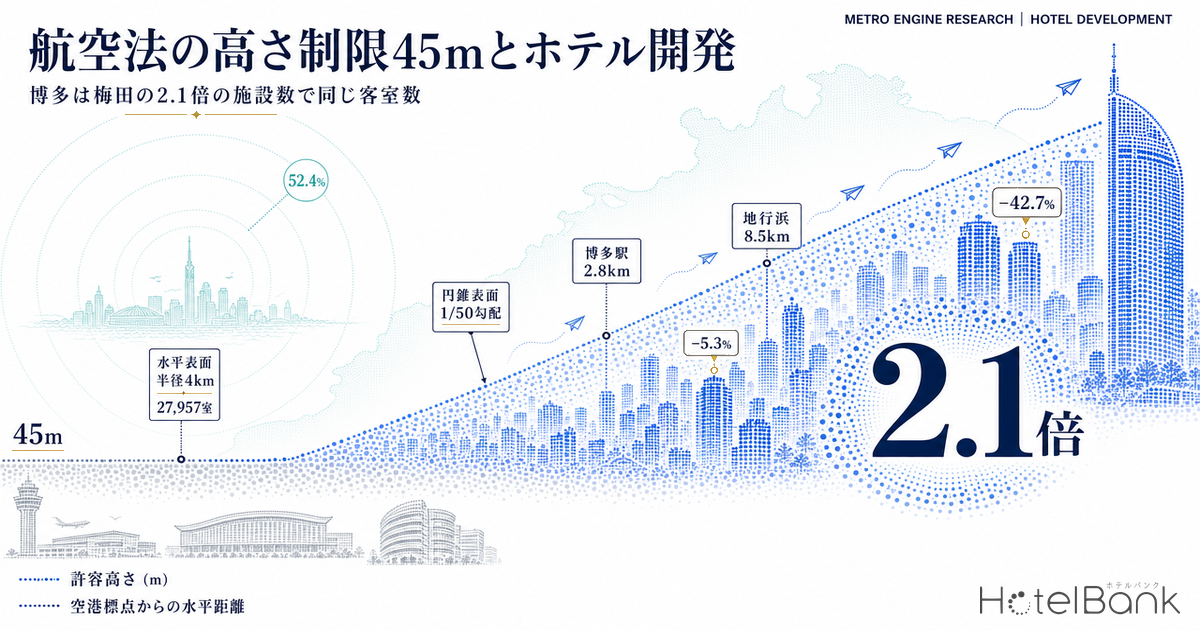
When hotel developers think about height regulation, the first thing that comes to mind is usually the municipal height control district set for the sake of townscape. Around airports, however, there is another kind of ceiling — drawn under an entirely different body of law, by a different agency, for a different purpose. These are the obstacle limitation surfaces under Articles 49 and 56 of Japan’s Civil Aeronautics Act. Set by the Civil Aviation Bureau of the Ministry of Land, Infrastructure, Transport and Tourism (MLIT) for the safety of aircraft, these surfaces hold everything within a 4,000m radius of the airport reference point down to 45m above that point, and rise beyond it at a gradient of only 1 in 50. Zoning districts and floor area ratios (FAR) have meaning only underneath this surface.
This article quantifies how the obstacle limitation surfaces govern developable hotel volume in airport-adjacent areas, using five airports as case studies: Fukuoka, Naha, Haneda, Narita and Itami. Combining the property data and estimated settled ADR tracked by MetroEngines Research with the REIT ownership master and Published Land Prices, we work backwards to a structural finding: relaxing FAR alone lowers land cost per room by just 5.3%.
How this differs from our earlier piece — here the height cannot be moved
Our earlier article, “Kyoto’s 20m Height Cap Adds 25% to Land Cost Per Hotel Room”, dealt with height control districts under the City Planning Act — heights set by municipalities for townscape reasons, which can move if the city planning amendment procedure is followed, and which have in fact been relaxed in various places through district plans and redevelopment promotion districts. The obstacle limitation surfaces under the Civil Aeronautics Act that we examine here have a different legal source and a different authority. They are set by the national government (the Minister of Land, Infrastructure, Transport and Tourism and the Civil Aviation Bureau), their purpose is the safe takeoff and landing of aircraft, and as a rule they cannot be moved to accommodate local land use. That said, they are not entirely immovable: for the horizontal surface, the conical surface and the outer horizontal surface, a building may be permitted to protrude above the surface upon application and approval by the Director-General of the Civil Aviation Bureau, where it is found not to particularly impair the safety of aircraft operations given the terrain and existing structures (the approach surface and transitional surface are excluded). In National Strategic Special Zones, moreover, a mechanism has existed since November 2014 for obtaining this approval comprehensively on an area basis rather than property by property. Where the line falls between what can and cannot be moved is what separates investment decisions in airport-adjacent locations.
Metric Definitions Used in This Article
- ADR (Average Daily Rate): An estimated settled rate (tax-exclusive equivalent) calculated by applying a segment-specific adjustment coefficient to the lowest advertised plan level each property publishes on OTAs and similar channels (double occupancy, per-room rate, tax-inclusive). Cross-checking against property-level results disclosed by listed hotel REITs (91 properties, most recent three months) gives a median error of approximately 7%. These are estimates and differ from each property’s actual transacted prices and accounting figures. Area-level ADR is the median across the properties covered (the level of a typical property in that area). Where advertised prices are referenced, they are per-room rates at double occupancy (tax-inclusive).
- OCC (Occupancy): The share of rooms sold against total rooms in the area (an estimate based on OTA sales inventory). Used only as a macro indicator at the prefectural level.
- Permitted height under the obstacle limitation surfaces: An approximate value derived, according to horizontal distance from the airport reference point, from the horizontal surface (within a 4,000m radius of the reference point, 45m above it) and the conical surface (beyond 4,000m, rising outward at a 1-in-50 gradient). Reference point locations, reference point elevations and ground elevations are approximate values based on published materials; actual determinations must always be obtained from the relevant Civil Aviation Bureau or airport operator’s height enquiry system.
- Data sources: MetroEngines Research & Consulting (properties, room counts, estimated settled ADR, estimated occupancy), MLIT (obstacle limitation surfaces, Published Land Prices), REIT ownership master (as of 24 August 2026)
A ceiling drawn by the national government — how it differs from a height control district
Article 49 of the Civil Aeronautics Act prohibits the installation of structures rising above the approach surface, the transitional surface and the horizontal surface. Article 56 adds the extended approach surface, the conical surface and the outer horizontal surface. In hotel development practice, the two that bite first are the horizontal surface and the conical surface.
The horizontal surface is the part of the horizontal plane containing the point 45m vertically above the airport reference point that lies inside a circle of 4,000m radius drawn around that point. In other words, everything within 4km of the airport sits beneath a single flat ceiling at reference point elevation plus 45m. The conical surface connects to its outer edge and rises outward at a gradient of 1 in 50, with its projection extending to a circle of 16,500m radius around the reference point. A 1-in-50 gradient means the ceiling rises 20m for every 1km further from the airport.
| Point of comparison | Height control district / absolute height limit (City Planning Act) | Obstacle limitation surfaces (Civil Aeronautics Act) |
|---|---|---|
| Legal source | City Planning Act, Building Standards Act | Civil Aeronautics Act, Articles 49 and 56 |
| Who sets it | Municipalities and prefectures (city planning decision) | The national government (Minister of Land, Infrastructure, Transport and Tourism / Civil Aviation Bureau) |
| Purpose | Preserving townscape, residential amenity and sunlight access | Ensuring the safety of aircraft takeoff and landing |
| How the height is determined | A figure specified district by district (e.g. 20m, 31m) | Determined geometrically by distance from the airport reference point |
| Scope for relaxation | Can move through city planning amendments, district plans, special blocks and similar | In principle immovable. Exceptions exist for the horizontal, conical and outer horizontal surfaces by approval of the Director-General of the Civil Aviation Bureau (approach and transitional surfaces excluded) |
| Area-wide relaxation | Redevelopment promotion districts, special urban renaissance districts and similar | Area-based special approval under National Strategic Special Zones (from November 2014) |
| Relationship to zoning | Consistent within the same city planning framework | Overrides regardless of zoning district or FAR |
Source: Compiled by MetroEngines Research & Consulting from the Civil Aeronautics Act and the City Planning Act
In practice the last row matters most. The obstacle limitation surfaces come down from outside the city planning system. Even on a prime commercial site with 800% FAR, a location 3km from the airport has a ceiling of roughly 50m above ground. Build a project plan by looking only at the zoning and FAR maps, and it will fall apart just before the building confirmation application.
Distance determines height — redrawing the cross-section
Because the surfaces are defined geometrically, the permitted height at any point can be approximated once the coordinates and elevation of the airport reference point are known. Drawing the cross-section according to the definitions of the horizontal and conical surfaces produces the shape shown below: completely flat at 45m out to 4km, then rising at 1 in 50 to reach 295m above the reference point at 16.5km.
Source: Compiled by MetroEngines Research & Consulting from the obstacle limitation surface definitions in Articles 49 and 56 of the Civil Aeronautics Act (approximate values)
The table below maps the major lodging clusters onto that cross-section, with approximate above-ground heights converted from reference point elevation and ground elevation.
| Location | Airport | Distance from reference point | Applicable surface | Permitted height (elevation) | Approx. height above ground | Floors at 3.4m each |
|---|---|---|---|---|---|---|
| Itami, airport front | Osaka International Airport | 0.9km | Horizontal surface | approx. 60m | approx. 48m | 14 |
| Hakata Station area | Fukuoka Airport | 2.8km | Horizontal surface | approx. 54m | approx. 49m | 14 |
| Haneda, Tenkubashi | Tokyo International Airport | 3.0km | Horizontal surface | approx. 51m | approx. 48m | 14 |
| Canal City area | Fukuoka Airport | 3.7km | Horizontal surface | approx. 54m | approx. 50m | 14 |
| Naha, Kencho-mae | Naha Airport | 3.8km | Horizontal surface | approx. 49m | approx. 43m | 12 |
| Naha, Kokusai-dori | Naha Airport | 4.6km | Conical surface | approx. 61m | approx. 51m | 14 |
| Tenjin (City Hall area) | Fukuoka Airport | 4.8km | Conical surface | approx. 71m | approx. 66m | 19 |
| Naha, Omoromachi | Naha Airport | 5.9km | Conical surface | approx. 88m | approx. 63m | 18 |
| Narita Station front | Narita International Airport | 6.3km | Conical surface | approx. 133m | approx. 93m | 27 |
| Oimachi (Shinagawa, Tokyo) | Tokyo International Airport | 7.3km | Conical surface | approx. 117m | approx. 112m | 32 |
| Jigyohama (Chuo Ward, Fukuoka) | Fukuoka Airport | 8.5km | Conical surface | approx. 144m | approx. 141m | 41 |
Source: Compiled by MetroEngines Research & Consulting from the obstacle limitation surface definitions of the Civil Aeronautics Act and published reference point and ground elevations (approximate values; actual determinations are made by the relevant Civil Aviation Bureau or airport operator’s enquiry system)
Does this approximation match the figures used in practice?
In Fukuoka City’s redevelopment practice, the Civil Aeronautics Act height limit around Hakata Station is treated as approximately 50m (with station buildings and similar relaxed to 60m through individual approvals), and the Tenjin City Hall area as 67m at present (rising to 76m through area-based special approval under the National Strategic Special Zone). For the same points, the approximation above returns approximately 49m for the Hakata Station area and approximately 66m for Tenjin — closely matching the published figures.
Furthermore, the approximate permitted height at the site of Hilton Fukuoka Sea Hawk (ヒルトン福岡シーホーク), the largest hotel in Fukuoka City by room count (Jigyohama, 1,053 rooms, 36 floors above ground, 143m), is approximately 141m. Fukuoka’s largest hotel stands at a point where the obstacle limitation surface has risen almost to its maximum, and it uses up almost all of that ceiling.
Kyushu’s largest lodging cluster sits entirely inside Fukuoka Airport’s horizontal surface
The impact the surfaces have on land use varies by orders of magnitude depending on where the airport sits relative to the built-up area. For an offshore or coastal airport, the 4km-radius horizontal surface passes mostly over water; for an inland airport surrounded by the city, the city centre itself falls under the ceiling. Using the property data tracked by MetroEngines Research, we aggregated room stock by distance band from the reference point for each of the five airports.
Source: MetroEngines Research & Consulting (property location and room count master, as of August 2026)
| Airport | 0–4km Horizontal surface | 4–8km Conical, inner | 8–16.5km Conical, outer | Room share within horizontal surface | Rooms per property within horizontal surface |
|---|---|---|---|---|---|
| Fukuoka Airport | 481 properties / 27,957 rooms | 357 properties / 20,826 rooms | 111 properties / 4,494 rooms | 52.4% | 58 rooms |
| Naha Airport | 194 properties / 11,792 rooms | 382 properties / 18,425 rooms | 211 properties / 2,940 rooms | 35.6% | 61 rooms |
| Narita International Airport | 23 properties / 6,609 rooms | 58 properties / 4,099 rooms | 53 properties / 729 rooms | 57.8% | 287 rooms |
| Tokyo International Airport (Haneda) | 39 properties / 6,601 rooms | 209 properties / 17,364 rooms | 1,458 properties / 158,977 rooms | 3.6% | 169 rooms |
| Osaka International Airport (Itami) | 32 properties / 1,773 rooms | 96 properties / 8,114 rooms | 1,699 properties / 135,610 rooms | 1.2% | 55 rooms |
Source: MetroEngines Research & Consulting (properties with registered room counts only, N=5,004 properties)
Fukuoka Airport stands out. 481 properties with 27,957 rooms fall inside the 4km-radius horizontal surface, accounting for 52.4% of the room stock within the 16.5km ring. That ring contains Hakata Station, Nakasu and Canal City in their entirety, and Tenjin sits only just outside at 4.8km, still very low on the conical surface. Kyushu’s largest lodging cluster is, in effect, contained under a single ceiling.
Haneda and Itami are the opposite case. Because Haneda sits on reclaimed land in Tokyo Bay, only 3.6% of its room share falls within the horizontal surface. For Itami the figure is 1.2%, with most of Osaka’s room stock distributed beyond 8km, where the conical surface has risen well clear. Even among “airport-adjacent locations,” the weight of the constraint on developable volume differs entirely.
Narita is a third type. Its room share within the horizontal surface, at 57.8%, is higher than Fukuoka’s, yet rooms per property are 287 — the largest of the five airports. Narita’s reference point elevation is roughly 43m, and the difference against the surrounding lowland translates directly into headroom, so even within the 4km ring, low-lying sites can accommodate buildings approaching 70m above ground. It is an example of an airport-hotel-focused market that supports large-format properties even beneath the surfaces.
Fukuoka Airport: obstacle limitation surfaces and room distribution
The map below overlays the outer edge of the horizontal surface (4,000m radius) and an 8,000m circle, centred on Fukuoka Airport’s reference point. Circle size indicates room count. The hotel clusters of Hakata Station, Nakasu and Canal City sit densely inside the horizontal surface, Tenjin lies just outside the circle, and the city’s largest property at 1,053 rooms is visibly out beyond 8km at Jigyohama.
Source: MetroEngines Research & Consulting (properties of 220 rooms or more shown, N=56 properties), CartoDB (map tiles)
Hakata supplies the same room count as Umeda across 2.1x as many properties
A low ceiling shows up not in the total volume of room stock but in how that stock is stacked. For eight major CBDs across Japan, we aggregated the room stock within a 1.2km radius of each centre.
Source: MetroEngines Research & Consulting (1.2km radius from each CBD centre, properties with registered room counts)
| CBD (1.2km radius) | Properties | Total rooms | Rooms per property | Avg. rooms, properties of 50+ rooms | Largest property | Properties over 400 rooms |
|---|---|---|---|---|---|---|
| Hakata Station (Fukuoka) | 331 | 24,875 | 75 rooms | 187 rooms | 595 rooms | 6 |
| Osaka Station / Umeda | 158 | 24,843 | 157 rooms | 250 rooms | 1,704 rooms | 15 |
| Tenjin (Fukuoka) | 274 | 19,911 | 73 rooms | 154 rooms | 423 rooms | 1 |
| Naha, Kencho-mae | 348 | 19,046 | 55 rooms | 147 rooms | 366 rooms | 0 |
| Nagoya Station | 152 | 17,978 | 118 rooms | 180 rooms | 804 rooms | 3 |
| Sapporo Station | 94 | 14,673 | 156 rooms | 206 rooms | 605 rooms | 6 |
| Sendai Station | 102 | 13,933 | 137 rooms | 170 rooms | 610 rooms | 1 |
| Hiroshima Station | 126 | 11,721 | 93 rooms | 181 rooms | 727 rooms | 2 |
Source: MetroEngines Research & Consulting (N=1,585 properties, properties with registered room counts only)
The Hakata Station ring and the Umeda ring hold almost exactly the same number of rooms (24,875 versus 24,843, a difference of 0.1%). Yet the property counts are 331 against 158 — a factor of 2.10, and rooms per property are 75 against 157, or 47.8% of Umeda’s figure. Measured by largest property it is 595 rooms against 1,704, or 35% of Umeda’s scale. Hakata spreads the same quantity of rooms across more than twice as many buildings.
The Naha Kencho-mae ring is more distinctive still, supplying 19,046 rooms across 348 properties. That is 55 rooms per property, a largest property of just 366 rooms, and the only one of the eight major CBDs with zero properties above 400 rooms. Its supply structure is completely different from Umeda, which holds several large properties of 1,704, 1,030 and 961 rooms within the same 1.2km ring.
Not all of this gap can be attributed to the Civil Aeronautics Act
Differences in rooms per property involve several factors: the mix of small-format operations such as budget lodging houses and guesthouses, topography, the degree of land parcel fragmentation, and the history of urban formation. Fukuoka and Naha are indeed both markets with a high number of registered small lodging facilities. Even restricting the comparison to properties of 50 rooms or more, however, the gap remains — 187 rooms in Hakata and 147 in Naha against 250 in Umeda and 206 in Sapporo — and on the scale of the largest property, which represents the ceiling, Hakata’s 595, Tenjin’s 423 and Naha’s 366 rooms sit near the bottom of the major CBDs. An asymmetry in which total volume ranks high while only the per-building ceiling is low is more consistent with the presence of a height ceiling than with site conditions.
More direct corroboration comes from where Fukuoka City’s largest hotel by room count sits. Hilton Fukuoka Sea Hawk (ヒルトン福岡シーホーク; 1,053 rooms, 36 floors above ground, 143m) is located neither at Hakata Station nor at Tenjin but at Jigyohama, 8.5km from the airport reference point. As shown above, the approximate permitted height at that point is around 141m. In Fukuoka, a 1,000-room-class hotel is physically viable only far enough from the city centre for the obstacle limitation surface to have risen sufficiently.
Relaxing FAR alone does not add floor area — working back to land cost per room
This is where the investment case turns. In airport-adjacent locations, two ceilings apply simultaneously: the height limit and the designated FAR. Whichever is the tighter determines the site area required, so relaxing only one barely improves feasibility. We work this through for a hypothetical 200-room midscale hotel.
Assumptions
200 guest rooms; 42㎡ of guest-floor area per room (28㎡ guest room plus 14㎡ allocated share of corridors, stairs, lifts and shafts); 3.4m floor-to-floor height; two low-rise floors allocated to lobby, kitchen and back office; typical-floor plate at 65% of site area (allowing for building coverage ratio, road setback lines, setbacks and external works). Land unit price is the average for commercial land in Hakata Ward, Fukuoka City, at ¥2,197,041/㎡ (2026 Published Land Prices, +9.07% year on year). This compares land acquisition cost only, excluding construction and building costs, and does not reflect the higher structural and MEP costs associated with building taller. It is a simplified calculation; actual investment decisions require a detailed feasibility study.
| Scenario | Height limit | Designated FAR | Total floors | Site required, height-bound | Site required, FAR-bound | Actual site required | Binding constraint | Land cost per room | vs. base |
|---|---|---|---|---|---|---|---|---|---|
| 1. Current (equivalent to Hakata Station area) | 45m | 800% | 13 | 1,175㎡ | 1,241㎡ | 1,241㎡ | FAR | ¥13.63M | base |
| 2. FAR relaxed only | 45m | 1,300% | 13 | 1,175㎡ | 764㎡ | 1,175㎡ | Height | ¥12.91M | −5.3% |
| 3. Height relaxed only (67m) | 67m | 800% | 19 | 760㎡ | 1,174㎡ | 1,174㎡ | FAR | ¥12.89M | −5.4% |
| 4. Height relaxed only (76m) | 76m | 800% | 22 | 646㎡ | 1,155㎡ | 1,155㎡ | FAR | ¥12.69M | −6.9% |
| 5. Height and FAR relaxed together | 76m | 1,300% | 22 | 646㎡ | 711㎡ | 711㎡ | FAR | ¥7.81M | −42.7% |
| 6. Height raised further to 115m | 115m | 1,300% | 33 | 417㎡ | 688㎡ | 688㎡ | FAR | ¥7.56M | −44.6% |
Source: MetroEngines Research & Consulting calculations based on MLIT Published Land Prices (2026)
Source: MetroEngines Research & Consulting calculations based on MLIT Published Land Prices (2026)
The result is unambiguous. Raising FAR from 800% to 1,300% lowers land cost per room by only 5.3% as long as the 45m ceiling remains. Conversely, relaxing height to 76m while FAR stays at 800% delivers just 6.9%. Relaxing one side alone leaves the project pinned down by the other constraint, short of feasibility.
Only in scenario 5, where both are relaxed together, does land cost per room fall from ¥13.63M to ¥7.81M — a drop of 42.7%. For 200 rooms that is a difference of approximately ¥1.16 billion in land acquisition cost. And pushing height further to 115m in scenario 6 improves the reduction only to 44.6%, so the effect largely plateaus. Height is a variable that carries meaning paired with FAR; on its own it does not move feasibility.
Fukuoka City’s Tenjin Big Bang, which combined the city’s own FAR relaxation scheme with area-based special approval of Civil Aeronautics Act height limits under the National Strategic Special Zone (67m to 76m around City Hall, 76–100m east of Meiji-dori, and approximately 115m west of Meiji-dori and on the former Daimyo Elementary School site), can be read as a direct answer to this structure. With only one of the two, redevelopment of existing buildings does not pencil, and the stock does not renew.
Read the other way round, for an owner considering acquisition, expansion or reconstruction in an airport-adjacent location, the order of assessment follows. First confirm the permitted height under the obstacle limitation surfaces; then set it against the designated FAR and identify which one binds first. If height binds first, no amount of FAR bonus schemes (special urban renaissance districts, comprehensive design systems and the like) will add floor area. If FAR binds first, obtaining approval from the Director-General of the Civil Aviation Bureau will not change feasibility.
Demand is strong despite the constraint — rates and occupancy in Fukuoka and Okinawa
A physical ceiling on the supply side does not mean demand is weak. If anything the reverse: Fukuoka and Okinawa, where the obstacle limitation surfaces bite hardest, have maintained high occupancy and rates into 2026.
Source: MetroEngines Research & Consulting (Hakata Ward, Fukuoka City, N=138–149 properties per month)
Estimated settled ADR in Hakata Ward was ¥13,141 in July 2026 (N=148 properties), +4.8% against ¥12,534 in the same month a year earlier. In the first half of 2026, January through May all came in above the prior-year month, with April at ¥15,418, up 24.2% year on year. June and July settled back to near prior-year levels, but the advertised position at the time of survey implies a renewed upswing from autumn, with levels of ¥17,614 in October and ¥18,297 in November observed.
| Area | Estimated settled ADR July 2026 | Same month prior year | Year on year | Sample |
|---|---|---|---|---|
| Hakata Ward, Fukuoka City | ¥13,141 | ¥12,534 | +4.8% | N=148 |
| Naha City | ¥10,111 | ¥9,848 | +2.7% | N=141 |
| Ota Ward, Tokyo (Haneda side) | ¥10,642 | ¥11,049 | −3.7% | N=58 |
| Narita City, Chiba | ¥7,354 | ¥7,928 | −7.2% | N=29 |
Source: MetroEngines Research & Consulting (estimated settled ADR, July 2026 final)
Estimated occupancy shows the same pattern. In July 2026, estimated OCC was 91.1% in Fukuoka Prefecture (603 properties, 54,406 rooms) and 91.0% in Okinawa Prefecture (1,083 properties, 51,693 rooms) — close to Tokyo’s 93.1%. Fukuoka held the 90% range throughout the period, at 91.3% in May and 90.5% in June.
| Prefecture | May 2026 | June 2026 | July 2026 | Properties (July) | Total rooms (July) |
|---|---|---|---|---|---|
| Fukuoka | 91.3% | 90.5% | 91.1% | 603 | 54,406 rooms |
| Okinawa | 86.3% | 87.3% | 91.0% | 1,083 | 51,693 rooms |
| Tokyo | 94.7% | 92.8% | 93.1% | 1,354 | 182,896 rooms |
Source: MetroEngines Research & Consulting (estimated occupancy based on OTA sales inventory)
Demand is strong and rates are rising, yet the supply side alone cannot physically build upward. That is the structure of airport-adjacent locations. Viewed as scarcity of existing stock it is a tailwind; viewed from the perspective of new entry or expansion, it means that producing the same number of rooms requires securing a larger footprint of prime central land.
How the investment market prices this structure
From the listed hotel REIT ownership master (as of 24 August 2026, 302 domestic properties), we calculated the median acquisition price per room for properties where both acquisition price and room count are disclosed.
| Area | REIT-held properties | Acquisition price per room (median) |
|---|---|---|
| Sapporo | 11 | ¥29.41M |
| Kyoto | 4 | ¥28.80M |
| Osaka | 14 | ¥28.07M |
| Fukuoka | 11 | ¥24.37M |
| Nagoya | 4 | ¥21.34M |
| Narita | 3 | ¥19.71M |
| Hiroshima | 3 | ¥18.06M |
Source: Compiled by MetroEngines Research & Consulting from the REIT ownership master (as of 24 August 2026, N=301 properties, domestic only)
Among recent transactions, Japan Hotel & Residential Investment Corporation (日本ホテル&レジデンシャル投資法人) acquired a 109-room hotel in front of Hakata Station for ¥3.93 billion in December 2025, equating to approximately ¥36.06M per room. That is well above Fukuoka City’s median of ¥24.37M, indicating how highly investors rate a prime location inside the obstacle limitation surface such as the Hakata Station frontage. Scarcity created by a low ceiling may be working to push up valuations of existing stock.
These figures should not, however, be read as a direct comparison of market prices, since acquisition timing, brand, building vintage and acquisition structure differ property by property. They are one piece of corroboration that well-located properties inside the obstacle limitation surface are being actively valued as investment targets.
Regulation that can move and regulation that cannot — the order of assessment
As a due diligence sequence, the following four steps should be settled early for airport-adjacent locations.
| Step | What to check | What it means in practice |
|---|---|---|
| 1 | Whether the site lies inside the obstacle limitation surfaces, and which surface applies | Sites falling under the approach or transitional surface are outside the scope of the exception provisions. For the horizontal, conical and outer horizontal surfaces there is room for approval. A first-pass determination can be obtained from the height enquiry systems published by each Civil Aviation Bureau and airport operator |
| 2 | Which binds first: the permitted height under the surfaces, or the designated FAR | If height binds first, FAR bonus schemes are ineffective; if FAR binds first, obtaining approval from the Director-General of the Civil Aviation Bureau will not add floor area. In our calculations, relaxing one side alone moves land cost per room by only 5–7% |
| 3 | Whether the site falls within an area covered by area-based special approval under a National Strategic Special Zone or similar | Individual approvals are examined property by property, but in areas with area-based special approval the baseline height has already been raised. Fukuoka City’s Tenjin and Hakata districts are the leading example |
| 4 | Whether the existing building already exceeds the obstacle limitation surface (legally nonconforming status) | The current floor area may not be reproducible on reconstruction. Acquisitions premised on expansion or reconstruction need to be underwritten on the assumption that the achievable room count falls below the present figure |
Source: Compiled by MetroEngines Research & Consulting from the Civil Aeronautics Act and published materials of the MLIT Civil Aviation Bureau
Organised by type, airport-adjacent locations fall into the following three categories.
| Type | Examples | Characteristics | Possible strategic direction |
|---|---|---|---|
| City-centre overlap | Fukuoka Airport Naha Airport | The horizontal surface covers the entire downtown lodging cluster. Room share of 35–52%. The ceiling on per-building scale is structurally low | Portfolio operation bundling several small to mid-sized properties; acquisitions that price in the scarcity of existing stock; concentration on areas covered by area-based special approval |
| Airport-focused | Narita International Airport | A high reference point elevation, with the difference against surrounding lowland providing headroom. Large formats are viable even within the horizontal surface, at 287 rooms per property | Large properties focused on connecting and early-departure demand. Note, however, that estimated settled ADR in July 2026 was down 7.2% year on year, so the scope for rate growth needs careful assessment |
| Offshore / suburban | Tokyo International Airport (Haneda) Osaka International Airport (Itami) | Room share within the horizontal surface is 1.2–3.6%. Downtown room stock sits where the conical surface has risen well clear and is effectively unconstrained | Leverage the advantage of airport access while treating height limits as ordinary city planning regulation |
Source: MetroEngines Research & Consulting
There is one further implication for owners of existing properties. Beneath the obstacle limitation surfaces, later large-format entrants are unlikely to appear nearby. Even though 52.4% of the room stock is concentrated inside Fukuoka Airport’s horizontal surface, only six properties exceed 400 rooms within the 1.2km Hakata Station ring. This barrier to entry is not the kind that city planning relaxation can dissolve. If the structure persists in a market where demand is growing, the relative value of existing mid-sized stock is likely to hold up.
Conclusion
The obstacle limitation surfaces of the Civil Aeronautics Act are a height ceiling that descends from a completely different system than city planning. They hold everything within a 4,000m radius of the airport reference point to 45m above that point, rising from there at only 1 in 50. That geometry places 481 properties and 27,957 rooms — including Hakata Station, Nakasu and Canal City — under a single ceiling in Fukuoka, and produces a Naha Kencho-mae 1.2km ring with not one property above 400 rooms.
The Hakata Station ring supplies 24,875 rooms, almost identical to Umeda’s, yet across 2.10 times as many properties and at 47.8% of the rooms per property. Fukuoka’s largest hotel at 1,053 rooms sits 8.5km away at Jigyohama, where the surface has risen to approximately 141m. And working back from land cost per room shows the structure clearly: relaxing either height or FAR alone moves feasibility by only 5–7%, and only relaxing both together delivers the 42.7% reduction.
Airport-access locations hold a clear advantage on the demand side. Estimated occupancy in both Fukuoka and Okinawa was in the 91% range in July 2026, and estimated settled ADR in Hakata Ward was up 4.8% year on year. In translating that advantage into a business plan, the first thing to check is neither the zoning map nor the FAR map, but where the ceiling the national government has drawn over that land actually sits.
A note on forward-dated ADR: Estimated settled ADR referenced in this article for August 2026 onward is an estimate based on selling prices published on OTAs and similar channels at the time of survey, and will move as the check-in date approaches. Please note that levels currently set high may fall through last-minute price adjustments.
A note on the obstacle limitation surface figures: All permitted heights in this article are approximate. Actual determinations involve the precise location and elevation of the reference point, the ground elevation of the site, the presence of approach and transitional surfaces, and the application of extended approach and outer horizontal surfaces. For any specific project, always confirm with the height limit enquiry system or service desk of the relevant Civil Aviation Bureau or airport operator.
Related reading
- Kyoto’s 20m Height Cap Adds 25% to Land Cost Per Hotel Room
- Hotel Development Capacity 2026: Zoning, FAR & Land Price in 5 Markets
- Japan FAR Bonus: 138 Districts, 10.96M sqm, Under 10% Becomes Rooms
- Fukuoka Hotel Supply 2026-2028: ~1,000 Rooms/Year in Hakata & Tenjin
- Naniwasuji & Haneda Access Lines 2031: Hotel Investment Timelines
- Leasehold Hotel Development: 1.38x Land Price Reach Across 9 Markets
References and Sources
■ Market data
- MetroEngines Research & Consulting — property location and room count master, estimated settled ADR, estimated occupancy (OTA sales inventory basis)
- REIT ownership master (as of 24 August 2026, 302 domestic properties) — acquisition date, acquisition price, room count
■ Laws and government materials
- MLIT Osaka Regional Civil Aviation Bureau, “Restrictions on the Installation of Buildings around Airports (Obstacle Limitation Surfaces)”
- MLIT Tokyo Regional Civil Aviation Bureau, “Restrictions on the Installation of Buildings around Airports (Obstacle Limitation Surfaces)”
- MLIT Osaka Regional Civil Aviation Bureau, “Height Restrictions around Fukuoka Airport”
- Okinawa Prefecture, “Airport Regulations and the Extent of the Obstacle Limitation Surfaces”
- Narita International Airport Corporation, “Height Restrictions around the Airport”
- Kansai Airports, “Osaka International Airport Obstacle Limitation Surfaces Outline Map”
- Fukuoka Airport height limit enquiry system
- Fukuoka City, “Tenjin Big Bang is steadily progressing”
- Japan Civil Engineering Consultants Association, Kyushu Branch, “Height Restrictions in Central Fukuoka and the Compact City”
- MLIT Published Land Prices (2026 / Reiwa 8) — Hakata Ward, Fukuoka City, commercial land average ¥2,197,041/㎡ (+9.07% year on year); Naha City, Kumoji 3-1-1, ¥2,260,000/㎡ (+6.60%)
■ Property and development information