

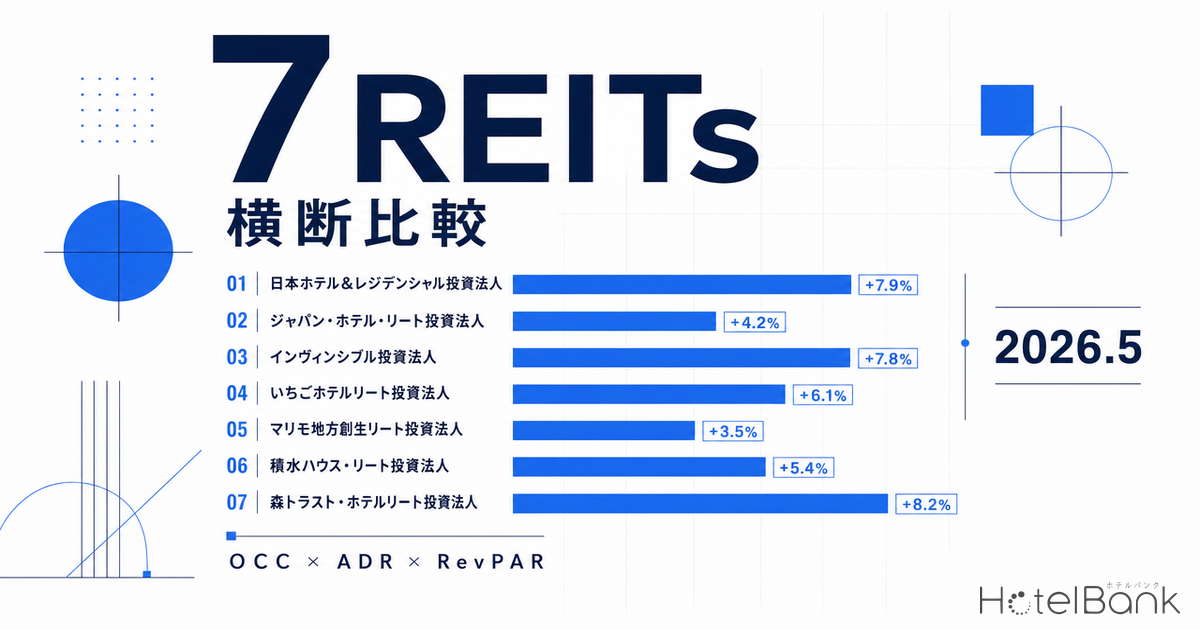
In late June 2026, the May 2026 monthly operating results for Japan’s hotel-focused J-REITs were all released. This article lays out the latest monthly figures for the seven major listed hotel REITs side by side to read their portfolio operating performance just ahead of the summer peak season. About eight months after the close of the Osaka Expo, the market sits in a transitional phase where signs of a bottoming-out in the Kansai market coexist with continued ADR growth in Tokyo and regional cities. Using only publicly disclosed figures, we compare the operating characteristics each company is showing.
Metric Definitions Used in This Article
- OCC (Occupancy Rate): Guest-room occupancy. The actual figure each REIT discloses in its monthly operating results.
- ADR (Average Daily Rate): Average selling price per room sold (transaction basis, tax and service charge included). Quoted directly from each REIT’s monthly disclosure PDF.
- RevPAR: Revenue per available room (OCC × ADR). As disclosed by each company.
- Year-on-Year (YoY): The official YoY figure disclosed by each REIT is used where available. Where the value is our own aggregate, this is noted in the text or tables.
- Data Source: Monthly operating-results disclosures (PDF / Excel) posted on each REIT’s official IR site.
- — Mori Trust Hotel REIT (OCC 88.1%, ADR ¥42,800) runs away at the top on the high-end segment alone — an aggregate of three variable-rent properties centered on Shangri-La Tokyo.
- — The high-growth group with RevPAR YoY of +5% or more is Japan Hotel REIT, Invincible, and Nippon Hotel & Residential, reflecting broad-based strength across city and urban portfolios.
- — Ichigo Hotel REIT remains in the low-single-digit negative YoY band due to its Kansai weighting and the post-Expo pullback, though the deterioration from the Kansai reaction has been narrowing over the past 12 months.
- — All seven companies posted OCC of 74% or higher, so operating efficiency as of May 2026 is solid and the baseline is in place heading into the summer peak (July–August).
- — Kasumigaseki Hotel REIT (401A), newly listed, posted RevPAR of ¥22,300 on an 11-property weighted average — a smooth ramp-up as a regional-city and tourist-destination-focused vehicle.
Overview of the Latest Monthly Data for the 7 Major Hotel REITs
There are seven listed hotel REITs. Their sponsors, portfolio sizes, and property categories differ significantly, but all disclose operating results monthly, making them a closely watched real-time indicator of the hotel market. As of late June 2026, four companies — Japan Hotel REIT (8985), Ichigo Hotel REIT (3463), Nippon Hotel & Residential (3472), and Invincible Investment (8963) — have disclosed their May 2026 monthly data, while three companies — Hoshino Resorts REIT (3287), Mori Trust REIT (8961), and Kasumigaseki Hotel REIT (401A) — have disclosed through April 2026.
| REIT | Month | OCC | ADR | RevPAR | RevPAR YoY |
Disclosure Scope |
|---|---|---|---|---|---|---|
| Japan Hotel REIT | 2026/05 | 84.0% | ¥21,400 | ¥18,000 | +7.9% | 29 hotels under variable rent |
| Ichigo Hotel REIT | 2026/05 | 84.3% | ¥11,100 | ¥9,400 | -3.6% | Full portfolio, 25 properties |
| Nippon Hotel & Residential | 2026/05 | 87.4% | ¥29,500 | ¥24,500 | +7.8%* | Weighted avg. of 20 properties (our aggregate) |
| Invincible Investment | 2026/05 | 85.5% | ¥15,300 | ¥13,100 | +4.7% | 101 domestic hotels |
| Hoshino Resorts REIT | 2026/04 | 79.3% | ¥21,600 | ¥17,100 | -1.7% | Whole portfolio (reference) |
| Mori Trust REIT | 2026/04 | 88.1% | ¥42,800 | ¥36,800 | +3.3%* | 3 variable-rent properties (our aggregate) |
| Kasumigaseki Hotel REIT | 2026/04 | 74.6% | ¥29,700 | ¥22,300 | — | Weighted avg. of 11 properties (our aggregate) |
* YoY figures marked with an asterisk are our own weighted-average estimates, calculated as reference values where the REIT’s official YoY was not disclosed. Kasumigaseki Hotel REIT was listed in August 2025 and therefore has no prior-year data. Prices are shown rounded.
Source: Compiled by the HotelBank Editorial Team from each company’s REIT monthly operating data
In terms of absolute RevPAR level, Mori Trust REIT (¥36,800) stands out. This reflects a scope of just three variable-rent properties specialized in the high-price band, including Shangri-La Tokyo. It is followed by Nippon Hotel & Residential (¥24,500), Kasumigaseki Hotel REIT (¥22,300), Japan Hotel REIT (¥18,000), Hoshino Resorts REIT (¥17,100), Invincible (¥13,100), and Ichigo Hotel REIT (¥9,400). Because the portfolios differ in property category, location, and operating style, a simple comparison of absolute RevPAR levels is not meaningful. This article focuses on each company’s YoY trend and on the structural shifts that can be read from the monthly trajectory.
Source: Compiled by the HotelBank Editorial Team from each company’s REIT monthly operating data
Three Structural Groups by RevPAR YoY
Lining up the RevPAR YoY figures for the four companies that have disclosed May 2026 monthly data (Japan Hotel REIT, Ichigo Hotel REIT, Nippon Hotel & Residential, and Invincible) and the three that have disclosed through April (Hoshino Resorts REIT, Mori Trust REIT, and Kasumigaseki Hotel REIT), a clear split into three groups emerges.
The first group is REITs growing strongly, with RevPAR up 5% or more YoY. Japan Hotel REIT at +7.9% and Nippon Hotel & Residential at +7.8% (our weighted average) both show near-double-digit growth in city and high-end portfolios. The second group is modest positive growth. Invincible Investment at +4.7% and Mori Trust REIT (as of April) at +3.3% are maintaining a steady cruising speed. The third group is in negative territory. Ichigo Hotel REIT at -3.6% and Hoshino Resorts REIT (as of April) at -1.7% are running below prior-year levels.
Ichigo Hotel REIT’s negative RevPAR YoY reflects the high proportion of Kansai-area properties among its 25-property portfolio, as well as the impact of variable-rent adjustments tied to fuel-supply constraints at its two Okayama/Kurashiki properties (The OneFive Okayama and The OneFive Garden Kurashiki), as referenced in the company’s earnings-revision disclosure. Hoshino Resorts REIT, being centered on hot-spring inns and resorts, shows a seasonality in which operating load concentrates during the April leisure off-peak and the first half of Golden Week.
Source: Compiled by the HotelBank Editorial Team from each company’s REIT monthly operating data (Kasumigaseki Hotel REIT excluded, as it was listed in August 2025)
The Unwinding of the Kansai Pullback Seen in 12-Month RevPAR YoY
What single-month figures alone cannot reveal is the current market structure, now eight months on from the close of the Osaka-Kansai Expo (October 13, 2025). Since just before the Expo opened in June 2025, Ichigo Hotel REIT and Hoshino Resorts REIT have shown large swings against prior-year levels owing to their high Kansai property weightings, and tracking the monthly trajectory reveals an interesting pattern.
Ichigo Hotel REIT’s RevPAR YoY swung as follows: +13.0% in October 2025 (last-spurt demand in the Expo’s closing month), +0.7% in December, -7.1% in January 2026, -9.0% in February, +1.0% in March, -8.3% in April, and -3.6% in May. Japan Hotel REIT, by contrast, posted +20.8% in October 2025, +8.5% in November, and +5.0% in December, then settled into a steady cruising range of +5% to +9% into 2026. Although the two companies’ scopes differ, the contrast is clear across the past 12 months: Ichigo Hotel REIT, whose Kansai weighting more readily transmits the pullback, versus Japan Hotel REIT, whose large weighting toward Tokyo and metropolitan high-end properties gives it a firm market baseline.
What deserves attention is that Ichigo Hotel REIT’s negative RevPAR YoY has narrowed from -9.0% in February and -8.3% in April to -3.6% in May. This may be a sign that the Expo pullback is bottoming out, approaching a convergence of the reaction phase as the summer Obon peak (August) draws near. The upward revision the company announced on May 15, 2026 (an 18% increase in its ordinary-profit forecast and a ¥550 increase in distribution) also corroborates the Kansai market’s recovery trajectory.
Source: Compiled by the HotelBank Editorial Team from each company’s REIT monthly operating data
Operating Efficiency by Category — the Edge of City and High-End
Plotting occupancy (OCC) against average rate (ADR) on a scatter chart — a common way to gauge hotel REIT operating efficiency — reveals how each category is positioned. On a positioning map with OCC on the horizontal axis and ADR on the vertical axis, the closer to the lower-left, the more a portfolio sits in the volume zone; the closer to the upper-right, the more high-end it is.
In the upper-right high-end zone, Mori Trust REIT (OCC 88.1%, ADR ¥42,800) sits alone. As an aggregate of three variable-rent properties centered on Shangri-La Tokyo, its absolute level is exceptionally high. Nippon Hotel & Residential (OCC 87.4%, ADR ¥29,500) and Kasumigaseki Hotel REIT (OCC 74.6%, ADR ¥29,700) occupy the mid-ADR band. Japan Hotel REIT (OCC 84.0% as of May 2026, ADR ¥21,400) and Hoshino Resorts REIT (OCC 79.3% as of May 2026, ADR ¥21,600) overlap in the mid band. Invincible (OCC 85.5% as of May 2026, ADR ¥15,300) and Ichigo Hotel REIT (OCC 84.3% as of May 2026, ADR ¥11,100) sit in the lower-left volume zone.
Looking at OCC, all seven companies secured 74% or higher — a favorable level for May, ahead of the summer peak. The high occupancy of Nippon Hotel & Residential (87.4%), Mori Trust REIT (88.1%, as of April), and Invincible (85.5%) stands out. This reflects the resilience of inbound arrivals since the start of 2026 and the continued strength of city-hotel demand in Tokyo and the metropolitan area.
Source: Compiled by the HotelBank Editorial Team from each company’s REIT monthly operating data
Three Points to Watch on the Eve of the Summer Peak
From each REIT’s disclosed data through May 2026, we distill three points worth watching at this juncture, ahead of the summer peak (July–August).
First, the effect of Japan Hotel REIT’s ¥64.3 billion acquisition of Hilton Fukuoka Sea Hawk is being steadily reflected in results. The acquisition of this property was announced in 2025, and its full contribution after joining the portfolio will be reflected in the full-year results for the 26th fiscal period (ending December 2025). The company’s May 2026 figures — RevPAR ¥18,000, OCC 84.0%, YoY +7.9% — are an aggregate over the scope of 29 hotels under variable rent, including the Sea Hawk acquisition, capturing steady Fukuoka-market demand and the property’s standing as a high-end resort.
Second, the stability of Invincible Investment’s operating capability. The company holds the largest portfolio, with 101 domestic hotels, yet maintained a steady cruising pace in May 2026 with RevPAR ¥13,100 and YoY +4.7%. Fortress-affiliated operating expertise and the standardized operations run by MyStays Hotel Management are reflected in operating efficiency backed by economies of scale. An OCC level of 85.5% is more than adequate for May, ahead of the summer peak.
Third, the solid operating capability of Kasumigaseki Hotel REIT. Having listed only in August 2025, it cannot yet compute YoY figures, but its 11-property weighted average of OCC 74.6%, ADR ¥29,700, and RevPAR ¥22,300 (as of April 2026, our aggregate) is a solid level for a regional-city and tourist-destination-focused vehicle. Sponsored by Kasumigaseki Capital as a newer-build hotel-focused REIT, it began operations on a schedule that, at the time of listing, projected asset scale of ¥49.2 billion and net income of ¥673 million over an irregular first fiscal period of 173 days.
The Market Baseline on the Eve of the Summer Peak, as Shown by May 2026 Monthly Data
Laying the May 2026 monthly data for the seven major hotel REITs side by side brings the market baseline on the eve of the summer peak into view. By RevPAR YoY, Japan Hotel REIT (+7.9%), Nippon Hotel & Residential (+7.8%), and Invincible (+4.7%) lead the uptrend, while Ichigo Hotel REIT, at -3.6%, is showing signs of a narrowing decline.
By category, city and high-end REITs hold an edge in RevPAR growth, while volume-zone business-hotel REITs continue solid growth in the 4% range. OCC is aligned at 74% or higher across all companies — a sound run-up ahead of the summer peak. Eight months on from the close of the Expo, the Kansai pullback phase is gradually converging, and the focus for the summer 2026 Obon demand season will be whether the Kansai market’s full-fledged recovery trajectory can be confirmed in the data.
The summer-peak monthly data that will roll in from July onward will be a test of each REIT’s operating capability. Whether the strong cruise of city and high-end accelerates further, or whether the volume zone centered on Kansai stages a full recovery from the pullback — the autumn monthly data, after the summer Obon, will be worth watching.
About the data in this article: We quote the latest figures from the monthly operating-results disclosures published by each REIT; four REITs have disclosed through May 2026 and three through April. Of the RevPAR YoY figures, those marked with an asterisk are our own weighted-average aggregates, while unmarked figures are each REIT’s official published values. Kasumigaseki Hotel REIT was listed in August 2025 and therefore has no prior-year data. Prices and metrics are the published values as of the time of writing (late June 2026) and may be revised in the future.
References & Sources
■ Data Sources
The monthly data for the seven major hotel REITs in this article were compiled from the published values in each REIT’s official IR monthly operating-results disclosure PDFs (for May 2026, published in late June) as the primary source. RevPAR, OCC, and ADR follow each company’s disclosed operating-consignment / variable-rent scope (excluding fixed-rent properties). YoY calculations use the prior-year month (May 2025) as the comparison, adopted only where a comparison at the same scope is possible.
■ Estimation Assumptions
We standardized figures on the RevPAR = OCC × ADR identity and displayed them to match each company’s disclosed decimal precision. The category grouping (city / high-end / tourist-destination-focused) is the editorial team’s judgment based on each REIT’s disclosed operating policy and principal property composition. For Kasumigaseki Hotel REIT (401A), YoY was not computed for the May 2026 figures given its recent IPO, and only weighted-average levels are presented.
■ Limitations & Caveats
The disclosure scope of each REIT (variable rent / fixed rent / whole-portfolio weighted average) is not uniform, so caution is required in simply comparing absolute levels. RevPAR YoY trends are useful for comparing direction, but include the effects of portfolio turnover, new acquisitions, and disposals. This article is a snapshot as of May 2026; developments after the summer peak will be updated in a separate article.
■ REIT Official Monthly Operating-Results Disclosures
- Japan Hotel REIT Investment Corporation (8985) Official IR
- Ichigo Hotel REIT Investment Corporation (3463) May 2026 Monthly Operating Results (PDF)
- Nippon Hotel & Residential Investment Corporation (3472) Official IR
- Invincible Investment Corporation (8963) May 2026 Monthly PDF
- Hoshino Resorts REIT Investment Corporation (3287) IR Library
- Mori Trust REIT Investment Corporation (8961) Official IR
- Kasumigaseki Hotel REIT Investment Corporation (401A) Official IR
■ Industry Information & News
- JAPAN-REIT.COM “JHR Acquires Hilton Fukuoka Sea Hawk, Discloses Earnings Forecast”
- Nikkei Real Estate Market Information “Japan Hotel REIT Acquires Hilton Fukuoka Sea Hawk for ¥64.3 Billion”
- Kabutan News “Ichigo Hotel REIT Raises Ordinary-Profit Forecast 18%, Adds ¥550 to Distribution” (May 2026)
- The Nikkei “Kasumigaseki Hotel REIT Lists; Opening Price ¥103,800”
■ Government Statistics