

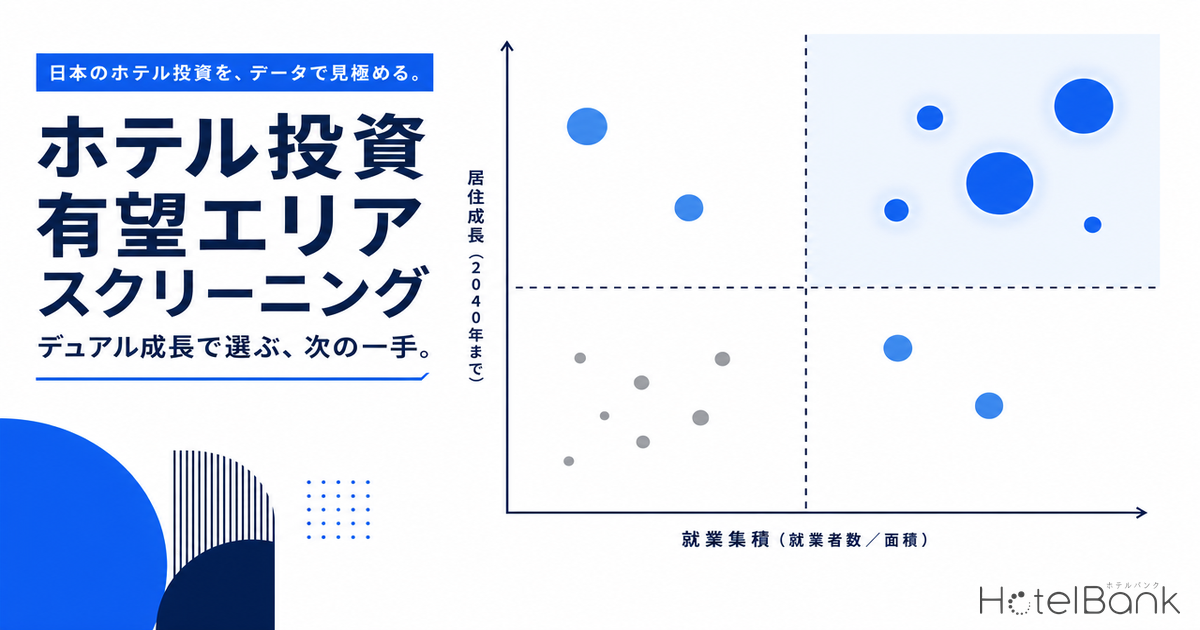
When acquiring hotel land, we typically ask: “Is there demand now?” But it takes 3–5 years from land acquisition to opening, and the holding period stretches beyond 10 years. The question we should really be asking is: “Will demand still be growing in 10 or 15 years?” This article answers that question by combining two growth engines: future residential population growth (2040 projection) and current employment concentration (the depth of the trade area). Across 30 major stations and redevelopment candidate sites nationwide, we mechanically extract “dual-growth nodes” that simultaneously satisfy residential growth (positive 2040 population change) and employment concentration (100,000+ workers within a 1km radius), then overlay them with new hotel supply to rank the underserved areas.
Metric Definitions Used in This Article
- Residential Growth Rate: Change rate from 2025 to 2040 projected population, aggregated in a 1.5km radius using 250m mesh data. Source: MLIT National Land Numerical Information (250m-mesh future population projection, R6 NPMSP estimate). This is residential population (census-based), not stay or transient population.
- Employment Concentration: Number of business establishment workers within a 1km radius. Source: MIC / METI Economic Census – Activity Survey (2021); boundaries from Census 2020 small areas.
- Office Ratio: Share of office-sector workers among total employment. A proxy for the depth of business demand (weekday corporate stays).
- Dual-Growth Node: A location that simultaneously satisfies residential growth rate >0% AND employment of 100,000+ workers.
- Data Sources: In addition to the official statistics above, new supply data is from MetroEngines Research & Consulting (OTA-listing confirmed basis) and MLIT “Building Construction Statistics Survey.”
- — Of 30 major sites nationwide, 18 simultaneously meet 2040 residential growth (positive population change) and employment concentration (100,000+ workers within 1km) and qualify as “dual-growth nodes” (N=30 sites).
- — The core of the dual-growth quadrant is central Tokyo redevelopment districts. The highest residential growth rate is Hamamatsucho at +20.9%, and the largest employment cluster is Tokyo Station / Yaesu with 556,000 workers (1km radius).
- — Nagoya Meieki (-4.7%), Shin-Osaka (-6.6%) and Hiroshima Kamiyacho (-0.4%) carry 100,000+ workers but their residential populations shrink — making them three “single-engine” sites. Long-term holding upside is limited.
- — Construction plans for 100+ room hotels total 50 projects with ~11,800 rooms nationwide (N=50). 2026 new openings concentrate in tourism destinations (Hokkaido 64, Kyoto 53, Okinawa 51), while central-city dual-growth nodes show thin supply — a bipolar pattern.
- — The prime profit opportunity lies in Quadrant A (dual-growth × thin supply) — districts where early positioning pays off before acquisition competition intensifies.
Why Measure Locations by “Dual Growth”
Hotel investment location evaluation has traditionally leaned on “current demand strength” — occupancy, ADR, tourist arrivals. But these are spot indicators; they do not guarantee sustainability across the holding period. Urban hotels in particular rely on both weekday business demand (employment concentration) and the local living base that supports weekend and long-stay demand (residential population). If either side withers, both the ADR ceiling that dynamic pricing can capture and the resilience that fills vacant rooms are lost.
This article therefore combines two growth axes on different time horizons. Employment concentration represents “the depth of today’s trade area”, and residential growth rate (2040) represents “the headroom of the future town”. Mapping on these two axes clearly separates merely busy towns from those that will mature street by street. Supply tends to concentrate in the former, but underserved profit opportunities may sleep in the latter.
Dual-Growth Map — Employment Concentration × 2040 Residential Growth Rate
The cross-lines mark the thresholds (100,000 workers / 0% residential growth). The upper-right blue quadrant gathers 18 sites, the majority in central Tokyo. Hamamatsucho (residents +20.9% / 285k workers), Toranomon (+14.9% / 338k), and Otemachi (+14.5% / 476k) stand out for combining high employment depth with strong residential growth. By contrast, Nagoya Meieki (-4.7%), Shin-Osaka (-6.6%), and Hiroshima Kamiyacho (-0.4%) sit in the “single-engine” quadrant: 100k+ workers, but residents shrinking.
Development Site Screening Table — Top 12 Dual-Growth Nodes
The 18 sites passing both conditions are ranked by a composite score weighting residential growth and employment concentration 50:50. The top of the table also shows high office ratios, where weekday business demand and future neighborhood growth overlap. The same dual-growth framework extended to all of Japan at the 250m-mesh level identifies 17 prime sites in our Nationwide Dual-Growth Mesh Screening 2040.
| Rank | Site | Prefecture | Residential Growth (2040) | Workers (1km radius) | Establishments | Office Ratio | Residents 2025→2040 |
|---|---|---|---|---|---|---|---|
| 1 | Tokyo Station / Yaesu | Tokyo | +14.1% | 556,119 | 12,685 | 47.4% | 36,130→38,504 |
| 2 | Otemachi | Tokyo | +14.5% | 476,030 | 11,946 | 48.6% | 34,959→37,672 |
| 3 | Hamamatsucho | Tokyo | +20.9% | 285,093 | 7,997 | 44.0% | 71,628→81,087 |
| 4 | Toranomon | Tokyo | +14.9% | 338,104 | 11,706 | 42.6% | 43,572→47,421 |
| 5 | Umeda | Osaka | +10.1% | 334,187 | 15,795 | 26.5% | 88,831→91,777 |
| 6 | Roppongi | Tokyo | +16.1% | 135,827 | 6,774 | 45.5% | 95,040→106,755 |
| 7 | Shinagawa Konan | Tokyo | +13.6% | 157,861 | 3,545 | 32.6% | 106,443→119,285 |
| 8 | Shinagawa | Tokyo | +13.2% | 145,380 | 3,140 | 33.8% | 111,414→124,533 |
| 9 | Shinjuku | Tokyo | +1.8% | 319,191 | 12,279 | 32.5% | 98,430→98,862 |
| 10 | Shibuya | Tokyo | +4.6% | 239,796 | 12,399 | 39.4% | 83,565→87,596 |
| 11 | Yokohama Minatomirai | Kanagawa | +7.7% | 157,102 | 4,391 | 36.1% | 72,204→75,189 |
| 12 | Ikebukuro | Tokyo | +6.7% | 169,412 | 9,535 | 28.2% | 154,711→161,739 |
Single-Engine Sites — 3 Locations With Strong Jobs but Shrinking Residents
Among the sites filtered out by the screening, the following three have ample employment concentration (100k+ workers) but residential population that turns negative toward 2040. Current business demand is strong and weekday occupancy at business hotels is resilient, but they lack the second engine of future neighborhood growth. For long-hold acquisitions, the limited upside source compared with residentially growing locations must be priced in.
| Site | Prefecture | Residential Growth (2040) | Workers | Establishments |
|---|---|---|---|---|
| Nagoya Meieki | Aichi | -4.7% | 176,439 | 7,669 |
| Shin-Osaka | Osaka | -6.6% | 103,694 | 6,897 |
| Hiroshima Kamiyacho | Hiroshima | -0.4% | 102,397 | 8,359 |
Overlay With New Supply — Where Are the Underserved Dual-Growth Nodes?
Dual growth speaks only to the demand side. The investment sweet spot lies in locations that “grow but where supply is still thin.” We therefore overlay the construction pipeline (MLIT “Building Construction Statistics Survey,” 100+ rooms) with new opening actuals (MetroEngines Research, OTA-listing confirmed basis).
Construction plans for 100+ room hotels total 50 projects and ~11,800 rooms nationwide. By scheduled completion year: 16 in 2025, 18 in 2026, 9 in 2027, 6 in 2028, and 1 in 2029 — thinner the further out you look. But this does not mean supply runs dry. Building applications are usually filed 1–2 years before opening, so later years simply reflect “plans not yet filed” missing from the count. Read it as the current floor of the confirmed pipeline.
Tokyo dominates with 14 projects, and its locations overlap closely with the dual-growth quadrant. Specifically Chiyoda Uchisaiwaicho (adjacent to Toranomon), Otemachi / Yaesu, Shibuya Dogenzaka, and Toshima Ikebukuro — all districts equipped with both residential growth and employment concentration engines. Conversely, demand and supply are moving in tandem there, and competition is intensifying.
The notable point is the supply-demand mismatch. By prefecture, 2026 new openings concentrate in tourism destinations (resort and vacation-rental dominated) — Hokkaido 64, Kyoto 53, Okinawa 51, Shizuoka 47. Central Tokyo’s business-oriented dual-growth core, while large in absolute count, sees big projects emerge on long redevelopment timelines. The pattern is bipolar: “small-scale supply floods tourism destinations, while large but sporadic blocks land on central-city dual-growth nodes.” For land acquisition, the strategy that emerges is to avoid the overheated tourism competition and target districts within the dual-growth quadrant where the pipeline is still thin.
Deep Dive 1 — Hamamatsucho / Shibaura: The Nation’s Top Residential-Growth District
Hamamatsucho, the top-ranked screening site, posts +20.9% residential growth — the highest among the 30 nodes in this study. The backdrop is a chain of large-scale redevelopments. The main-tower rebuild of the World Trade Center Building has been reported to host “Raffles Tokyo” in its upper floors, and the adjacent Shibaura area is delivering the twin “BLUE FRONT SHIBAURA” towers spanning ~550,000 m² of total floor area. Housing supply (World Tower Residence, etc.) drives residential growth, layered on top of business depth: 285,000 workers and a 44.0% office ratio.
Some Minato-ku waterfront sites saw published 2025 land prices rise +14.5% year-over-year, a headwind in the form of higher acquisition costs. But this is also evidence that a trade area capable of supporting high-ADR hotels is maturing — and it signals the locational potential to host luxury formats like Raffles, where every room exceeds 60 m².
Deep Dive 2 — Shinagawa / Konan: The Center of Gravity Shifts South With the Maglev
Shinagawa (+13.2%) and Shinagawa Konan (+13.6%) also rank near the top of the dual-growth quadrant. The Chuo Shinkansen Maglev launching from Shinagawa in 2027 or later, the “Takanawa Gateway City” opening in spring 2025, and central Tokyo’s largest-class redevelopment spanning ~1.6km north-south around Shinagawa’s west and north exits underpin the dual demand growth. Takanawa Gateway City has been reported to host “JW Marriott Hotel Tokyo,” concentrating a mix of business, retail, MICE, and lodging functions.
The Konan area also carries a large absolute residential population (106,000 in 2025 → 119,000 in 2040 within a 1.5km radius) along with 158,000 workers — a deep business demand base. Nikkei has described it as “Tokyo’s center of gravity moving south” — a geographic expression of dual growth, with residents and jobs expanding southward at the same time. The Maglev opening will raise total business-travel volume and reinforce weekday business-stay resilience over the long term.
Implications for Land Acquisition — Three Strategic Quadrants
We organize the screening results into three strategic categories from an acquisition perspective. Note that whether the same plot pencils out as a hotel or a condo affects acquisition cost; see also our Land-Use Rivalry Reverse-Engineering and ADR-Feasible Land-Price Map.
Quadrant A Dual-Growth × Thin Supply
The prime profit opportunity. Districts where both residents and jobs are rising but the pipeline is not yet dense. Within the central-city dual-growth quadrant, underserved slots remain in the gaps between large redevelopments and in peripheral edges. Early positioning pays off before acquisition competition intensifies.
Quadrant B Dual-Growth × Thick Supply
Differentiation is the prerequisite. Districts like Hamamatsucho, Otemachi, and Shinagawa where demand and supply move in tandem. Concepts that do not overlap with existing supply — luxury, long-stay, MICE-linked — are needed. Price in higher land values too.
Quadrant C Single-Engine (Strong Jobs × Shrinking Residents)
Spot-demand focus, short- to mid-hold. Locations like Meieki, Shin-Osaka, and Hiroshima — thick business demand but residential populations shrink ahead. Weekday occupancy is resilient but long-term upside sources are limited. Either model a shorter hold period or judge by the certainty of business demand.
Construction Costs and Supply Restraint — A Tailwind for Dual-Growth Nodes
Soaring construction costs cut both ways for dual-growth nodes. According to MLIT’s Construction Starts Statistics, hotel construction costs have risen sharply in recent years, raising the bar for new entrants. While this is a headwind for acquisition and development costs, it is also an upside factor that suppresses overall supply and eases the competitive environment for existing and early-acquired properties. JLL’s market analysis also notes that Japan’s new-supply rate is well below the Asia-Pacific average — and operators who lock in slots early at dual-growth locations are best positioned to enjoy the supply-restraint dividend.
Caveats for this screening: The residential growth rate is a census-based residential-population projection and does not directly indicate hotel demand. Actual lodging demand depends on stay populations (business travel, tourism, MICE, etc.). Workers and establishments are as of the 2021 Economic Census, and the residential projection is based on the R6 NPMSP estimate. This table is a relative comparison from machine extraction across 30 major sites nationwide; detailed feasibility studies are required for individual property investment decisions.
Conclusion
Measuring locations by “Will demand still be dually rising in 10 years?” — rather than “Is there demand now?” — repaints the national map. Our screening classifies 18 of 30 major sites as dual-growth nodes combining residential growth and employment concentration, with the core occupied by central Tokyo redevelopment districts like Hamamatsucho, Otemachi, Toranomon, and Shinagawa. These advance large-scale redevelopment and housing supply in parallel, overlaying business demand depth with future neighborhood growth.
At the same time, supply gathers where demand is growing. The prime profit opportunity sits in Quadrant A — “dual-growth but still thin supply.” The current bipolar pattern, with new supply skewed toward tourism destinations, paradoxically signals the room for early positioning in central-city dual-growth nodes. On the land-acquisition and REIT-procurement frontline, placing future residential and employment dual-axis screening — like that in this article — ahead of acquisition decisions opens up room to capture upside across the full holding period, not just today’s occupancy.
Related Articles
- Nationwide Dual-Growth Mesh Screening 2040 — 17 Prime Development Sites Where Both Residents and Jobs Are Rising
- Hotel or Condo? Land-Use Rivalry Reverse-Engineering and ADR-Feasible Land-Price Map
- Soaring Construction Costs Will Shrink Hotel New Supply in 2027–2029 — Implications for Investment Strategy (EN translation pending)
- Nagoya On the Eve of the Maglev: Development Pipeline 2026–2033 — How Andaz Nagoya × the Meieki Five-Company Redevelopment × the Mitsubishi Estate 200m in Sakae Will Move the ¥32,628 / ¥34,115 ADR Tiers in Naka-ku and Nakamura-ku
- Supertall Luxury Hotel Development Around Tokyo Station and the Tri-Pole of Central Tokyo (Tokyo Station / Shinagawa / Nagoya)
References & Sources
■ Data Sources
Residential growth rates are aggregated within a 1.5km radius using MLIT National Land Numerical Information “250m-mesh future population projection (R6 NPMSP estimate)” (2025→2040 change rate). Employment concentration uses business establishment workers from MIC & METI Economic Census – Activity Survey (2021), aggregated within a 1km radius. New supply comes from MLIT “Building Construction Statistics Survey” (construction pipeline, 100+ rooms, N=50) and MetroEngines Research & Consulting (OTA-listing confirmed basis, N=758 properties).
■ Calculation Assumptions
“Dual-growth nodes” are defined as locations simultaneously meeting residential growth rate >0% AND 100,000+ workers within a 1km radius. The composite score normalizes residential growth rate and employment concentration on a 50:50 basis for ranking. A machine-extracted relative comparison drawn from a universe of 30 major stations and redevelopment candidate sites nationwide.
■ Limitations & Caveats
The residential growth rate is a census-based residential-population projection; it does not directly indicate lodging demand (the stay population from business travel, tourism, MICE, etc.). Workers and establishments are as of 2021; residential projections are based on the R6 NPMSP estimate. The construction pipeline is on an application-confirmed basis, so later scheduled-completion years are thinner with unfiled plans — read it as the current confirmed floor. Detailed feasibility studies are required for individual property investment decisions.
■ Market & Screening Data
- MetroEngines Research & Consulting — New opening data (OTA-listing confirmed basis, N=758 properties), dual-growth screening aggregations
■ Government Statistics & Public Data
- MLIT National Land Numerical Information (250m-mesh future population projection, R6 NPMSP estimate)
- MIC & METI Economic Census – Activity Survey (2021)
- MLIT “Building Construction Statistics Survey” (construction pipeline, 100+ rooms)
■ Redevelopment & Market Reports
- LIFULL HOME’S PRESS “Redevelopment Around Hamamatsucho Station”
- Kenbiya “The Shibaura Project: BLUE FRONT SHIBAURA”
- INVALANCE “Why Land Prices Rose 14.5% — Hamamatsucho & Shibaura, Today and Tomorrow”
- LIFULL HOME’S PRESS “Large-Scale Redevelopment Advances Around Shinagawa Station for the Maglev Opening”
- Sumikauru “Takanawa Gateway Redevelopment and the Future of the Shinagawa Area”
- Hankyu Hanshin Properties “Grand Green Osaka Phase-1 Town Opening”
- Nikkei “Tokyo’s Center of Gravity Moves South — The Wave of Shinagawa-Area Redevelopment”