

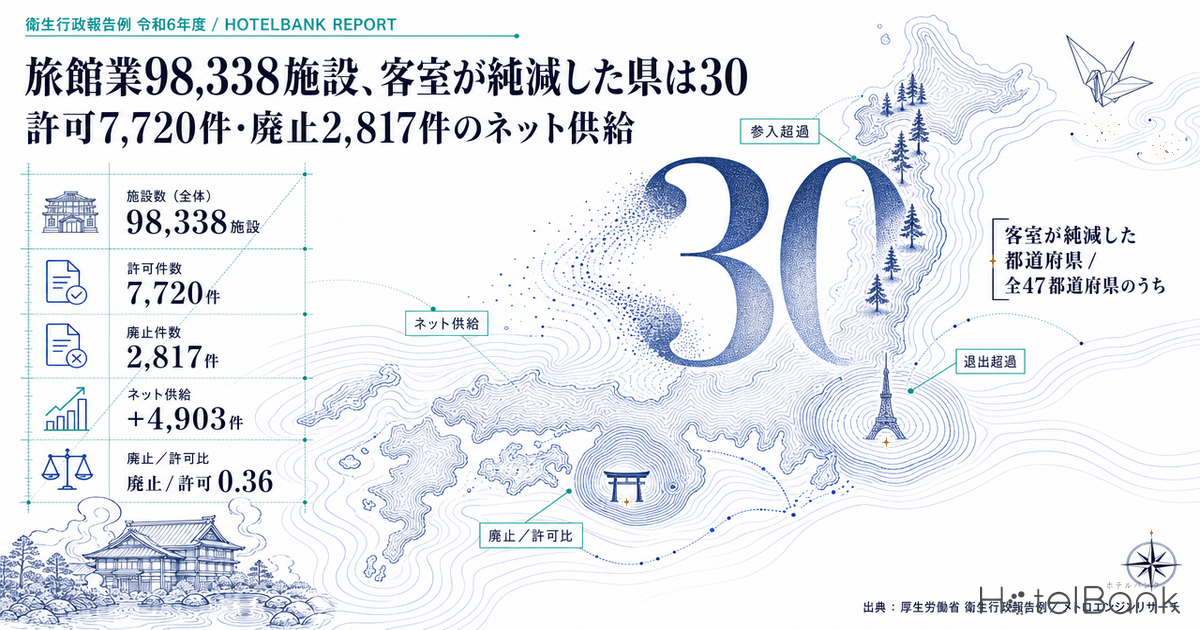
Almost every conversation about hotel supply in Japan is an exercise in addition. How many properties open this year, how many rooms are added, which markets take the pressure. But the total number of rooms in a market is not set by openings alone. In the same year, facilities leave the market through closure, conversion to another use, or an abandoned succession. It is net supply — what was added minus what left — that determines how scarce existing stock becomes.
The Ministry of Health, Labour and Welfare’s Report on Public Health Administration and Services is the only complete-count statistic in Japan that lets you do the subtraction. At the end of FY2024 (fiscal year ended 31 March 2025) there were 98,338 licensed lodging facilities. During the year, 7,720 new operating permits were granted and 2,817 businesses were withdrawn. Net: +4,903. That is 0.36 closures for every permit granted — five years earlier the ratio was 0.96. This article counts the exit side prefecture by prefecture, at the same resolution as the entry side, and translates it into investment terms.
Metric definitions used in this article
- Lodging facility and room counts: figures on a Hotel Business Act licence basis, from the Ministry of Health, Labour and Welfare’s Report on Public Health Administration and Services, as of each fiscal year end (31 March). “Total lodging business” is the sum of three categories — Hotel & Ryokan operations, simple lodging operations and boarding-house operations. Room counts are published for Hotel & Ryokan operations only.
- Permits granted and business withdrawals: within-year flows in the same statistic. They are published as a single figure for the lodging business as a whole, combining all three categories; no category breakdown is published. Category-level changes here are computed from year-on-year differences in fiscal-year-end stock.
- Net supply: permits granted − business withdrawals. This is our own term, not a published statistic.
- ADR (average daily rate): an estimated transacted rate (tax-exclusive equivalent), derived by applying category-specific adjustment factors to the lowest published plan level each facility offers on OTAs and other channels (double occupancy, per-room, tax-inclusive). Against property-level actuals disclosed by listed hotel REITs (91 facilities, trailing three months), the median error is about 7%. These are estimates and differ from any individual property’s actual transacted rates or accounting figures. Area-level ADR is the median of the covered facilities (the level of a typical facility in that area).
- Data sources: Ministry of Health, Labour and Welfare, Report on Public Health Administration and Services / MetroEngine Research & Consulting
- — Net +4,903 (7,720 permits − 2,817 withdrawals). The withdrawals-to-permits ratio fell from 0.96 in FY2020 to 0.36. The reversal owes more to a 45% drop in withdrawals than to permit growth.
- — Facilities grew +3.7% while rooms grew +0.3%. Rooms per facility fell from 34.8 to 33.7. What is increasing is properties, not rooms.
- — On a room basis, 30 prefectures declined (−11,229 rooms) and the gains concentrate in 17 prefectures (+16,467 rooms). Reading case counts alone understates supply pressure.
- — Against 98,338 licensed facilities, 27,162 facilities can be confirmed as listed on OTAs (27.6% by facility, 71.1% by room). Most of the gap is small properties.
- — The correlation between the withdrawals-to-permits ratio and YoY ADR is −0.24 (N=24). The numbers do not support the idea that rates rise where supply has shrunk.
Our earlier work counted only the entry side — where this article sits
Every supply article HotelBank has published so far measures the entry side. Hotel Supply Pressure Ranking 2026-2027 sizes new supply against existing stock; our 15-year supply-curve work on 20 major markets tracked how room stock accumulated. Lodging supply changes rank depending on the denominator argued about how to choose that denominator — but it, too, was a story about how many rooms exist right now.
We have covered the shrinking side before, but on a different population. Our work on ryokan bankruptcies tied to zero-zero (interest-free, unsecured) COVID loans took a financial event — insolvency — as its subject. Of the 2,817 permit withdrawals recorded here, only a minority end in bankruptcy. Most are voluntary retirements, abandoned successions, conversion to housing or care facilities, or a switch of business category. The populations are different, and this article deals with the full picture of exits that bankruptcy statistics cannot capture.
One more point worth stating up front. This article does not frame closure as failure. Succession, conversion and consolidation are how a market renews itself, and for investors they are a source of acquisition opportunity and scarcity. What follows is counting, not judgement.
7,720 permits, 2,817 withdrawals: a balance that flipped in five years
Start with the national flow. In FY2020, 5,365 permits were granted against 5,130 withdrawals — a net of just +235. Entries and exits were almost exactly balanced. Withdrawals then fell for five consecutive years, while permits bottomed out in FY2022 and turned up. FY2024 closed at 7,720 permits and 2,817 withdrawals, a net of +4,903. In five years the balance has completely reversed.
The point to read carefully is that this reversal is driven less by permits rising than by withdrawals falling. Permits went from 5,365 to 7,720, a factor of 1.44. Withdrawals went from 5,130 to 2,817 — down 45%. The wave of exits concentrated in the COVID years has worked through, and demand has recovered enough for the operators who remained to keep trading. The flip side: the pace of exits can rise again. Investors would do well to treat the drop in withdrawals as cyclical rather than structural.
| Fiscal year | Permits | Withdrawals | Net | Withdrawals/permits | Total lodging business (year-end) |
|---|---|---|---|---|---|
| FY2020 | 5,365 | 5,130 | +235 | 0.96 | 89,159 |
| FY2021 | 4,391 | 3,898 | +493 | 0.89 | 89,715 |
| FY2022 | 4,739 | 3,751 | +988 | 0.79 | 90,705 |
| FY2023 | 6,514 | 3,528 | +2,986 | 0.54 | 93,475 |
| FY2024 | 7,720 | 2,817 | +4,903 | 0.36 | 98,338 |
Facilities +3.7%, rooms +0.3% — what is growing is properties, not rooms
This is the core of the article. At the end of FY2024 the Hotel & Ryokan category counted 52,946 facilities, up 1,908 (+3.7%) year on year. Rooms, however, came to 1,782,232 — up just 5,238, or +0.3%. Rooms per facility fell from 34.8 to 33.7.
The gap is a product of regulation. The revised Hotel Business Act, in force from 15 June 2018, merged the separate “hotel operations” (minimum 10 rooms) and “ryokan operations” (minimum 5 rooms) categories into a single “Hotel & Ryokan” category and abolished the minimum room-count requirement altogether. A single-room property can now hold a Hotel & Ryokan licence. Whole-house machiya rentals, small villas, condo-style lodging — small-scale inventory that would previously have been licensed as simple lodging, or sat outside the framework entirely, now appears in the statistics as “Hotel & Ryokan”.
The long view makes the structure clear. Facility counts in the Hotel & Ryokan category peaked at 85,265 in FY1980 and fell for decades, bottoming at 49,024 in FY2017. Room counts, meanwhile, kept rising: FY2024’s 1,782,232 rooms is the highest on record, 1.56 times the 1,142,137 rooms of FY1980. Facilities fell by nearly a third while rooms grew by half — that was the forty-year story of scaling up.
That scaling-up stopped two years ago. Rooms per facility peaked at 35.2 in FY2022, then fell to 34.8 in FY2023 and 33.7 in FY2024 — two consecutive declines. The average size of inventory entering the market is shrinking. For development investors, judging a market as oversupplied on facility counts alone will mislead. The count has to be redone in rooms.
Permits and withdrawals by prefecture — above and below the 45-degree line
Now break the flow down by prefecture. Permits on the horizontal axis, withdrawals on the vertical, with a 45-degree line (permits = withdrawals, net zero). Below the line is net entry; above it, net exit.
Nine prefectures sit above the 45-degree line, with withdrawals exceeding permits: Fukushima (45 permits / 101 withdrawals), Iwate (19 / 49), Tokushima (36 / 56), Aomori (49 / 66), Toyama (21 / 26), Yamagata (21 / 24), Mie (77 / 83), Wakayama (136 / 144) and Nara (52 / 53). They cluster in the Tohoku region and on the Kii Peninsula.
At the opposite extreme sits Tokyo: 1,589 permits against 113 withdrawals, a net of +1,476. Tokyo alone accounts for 30.1% of the national net gain of +4,903. Next come Okinawa (524 / 57, net +467), Hokkaido (525 / 209, +316), Shizuoka (321 / 102, +219) and Yamanashi (257 / 41, +216).
Recount in rooms and 30 prefectures are negative — the national gain sits in 17
Change the unit from cases to rooms and the landscape changes. Comparing Hotel & Ryokan room counts against the prior year, 17 prefectures gained (+16,467 rooms in total) and 30 lost (−11,229 rooms). The net +5,238 rooms nationwide is therefore not broad-based growth but concentration into 17 markets.
The list of gainers does not match the one built on case counts. The largest room gain is Osaka at +5,463, on an increase of only 70 facilities — 78 rooms per added facility, the signature of large hotel development. Tokyo is next at +4,189 rooms, but on 1,436 added facilities: 2.9 rooms per facility. Both are “markets with heavy entry”, yet the shape of the inventory arriving is completely different. Where in the 23 wards that Tokyo supply is stacking up is measured ward by ward, against existing stock, in Tokyo 23 Wards Supply Pressure 2026.
Okinawa follows the Tokyo pattern: +460 facilities for +1,295 rooms, or 2.8 rooms each. Miyazaki is the mirror image — one additional facility and +1,296 rooms, a single large project making the number. Compare markets on case-count rankings alone and that distinction disappears.
On the losing side, Chiba stands out. Facilities fell by only 6, yet rooms fell by 2,421. The exit of large properties strips room stock quickly. Kumamoto (−27 facilities, −1,971 rooms) and Oita (−9, −1,654) show the same shape. In markets where a single withdrawal removes several hundred rooms, case-based net supply looks far too benign.
Nagano is the opposite case: +78 facilities but −391 rooms. Small properties entered while mid-sized ones exited, so the count rose and the room total fell. For an owner of existing stock, the number of competitors has grown while their capacity has shrunk.
Net supply by prefecture (FY2024)
| Prefecture | Permits | Withdrawals | Net (cases) | Δ Hotel & Ryokan facilities | Δ Simple lodging facilities | Δ Rooms | Rooms (year-end) | Total lodging business |
|---|---|---|---|---|---|---|---|---|
| Tokyo | 1,589 | 113 | +1,476 | +1,436 | +39 | +4,189 | 212,888 | 7,122 |
| Okinawa | 524 | 57 | +467 | +460 | +5 | +1,295 | 67,747 | 7,612 |
| Hokkaido | 525 | 209 | +316 | +29 | +285 | +645 | 122,333 | 6,357 |
| Shizuoka | 321 | 102 | +219 | -3 | +223 | +25 | 68,174 | 4,556 |
| Yamanashi | 257 | 41 | +216 | -3 | +215 | -15 | 27,243 | 3,412 |
| Nagano | 452 | 244 | +208 | +78 | +130 | -391 | 63,280 | 7,022 |
| Kyoto | 291 | 101 | +190 | -9 | +195 | -188 | 50,075 | 4,657 |
| Chiba | 251 | 79 | +172 | -6 | +178 | -2,421 | 59,041 | 2,767 |
| Tochigi | 193 | 37 | +156 | +12 | +144 | -132 | 36,556 | 2,317 |
| Fukuoka | 200 | 47 | +153 | +116 | +37 | +438 | 64,550 | 1,716 |
| Kagoshima | 213 | 61 | +152 | +5 | +147 | -733 | 27,134 | 2,480 |
| Kagawa | 160 | 15 | +145 | +4 | +141 | +249 | 13,926 | 1,144 |
| Kanagawa | 201 | 65 | +136 | +11 | +125 | -68 | 58,662 | 2,428 |
| Gifu | 133 | 29 | +104 | -3 | +107 | +241 | 26,692 | 1,913 |
| Osaka | 155 | 60 | +95 | +70 | +26 | +5,463 | 128,519 | 2,425 |
| Okayama | 96 | 12 | +84 | +45 | +39 | +588 | 22,170 | 1,145 |
| Kumamoto | 145 | 64 | +81 | -27 | +91 | -1,971 | 26,969 | 1,816 |
| Hiroshima | 120 | 41 | +79 | +22 | +57 | +511 | 33,151 | 1,482 |
| Hyogo | 151 | 83 | +68 | -19 | +90 | -45 | 46,733 | 2,421 |
| Nagasaki | 110 | 46 | +64 | -34 | +98 | +670 | 22,815 | 2,065 |
| Gunma | 107 | 50 | +57 | -4 | +63 | -1 | 29,680 | 2,047 |
| Shimane | 72 | 17 | +55 | +2 | +53 | -32 | 10,921 | 890 |
| Shiga | 94 | 44 | +50 | -8 | +59 | +76 | 15,319 | 1,018 |
| Ishikawa | 85 | 38 | +47 | -12 | +57 | -291 | 29,201 | 1,535 |
| Niigata | 108 | 66 | +42 | +9 | +32 | -169 | 43,524 | 2,215 |
| Miyazaki | 58 | 17 | +41 | +1 | +39 | +1,296 | 16,971 | 938 |
| Ibaraki | 60 | 30 | +30 | +2 | +27 | +350 | 28,727 | 1,165 |
| Aichi | 75 | 51 | +24 | +12 | +11 | -140 | 68,339 | 1,380 |
| Ehime | 56 | 35 | +21 | -6 | +27 | +200 | 17,664 | 950 |
| Saitama | 44 | 24 | +20 | +9 | +12 | +86 | 26,762 | 846 |
| Fukui | 78 | 58 | +20 | -15 | +36 | -142 | 15,746 | 1,421 |
| Yamaguchi | 56 | 40 | +16 | -23 | +39 | -320 | 17,499 | 797 |
| Kochi | 47 | 31 | +16 | -5 | +21 | -139 | 10,017 | 830 |
| Akita | 30 | 22 | +8 | -6 | +17 | -64 | 15,302 | 817 |
| Tottori | 29 | 21 | +8 | -2 | +9 | -36 | 9,682 | 772 |
| Saga | 23 | 16 | +7 | -2 | +9 | -53 | 9,389 | 524 |
| Oita | 100 | 96 | +4 | -9 | +20 | -1,654 | 23,590 | 1,993 |
| Miyagi | 55 | 53 | +2 | -22 | +26 | -396 | 33,423 | 1,016 |
| Nara | 52 | 53 | -1 | +1 | -2 | -7 | 10,426 | 789 |
| Yamagata | 21 | 24 | -3 | -10 | +9 | -241 | 18,918 | 1,007 |
| Toyama | 21 | 26 | -5 | -9 | +4 | +145 | 15,216 | 586 |
| Mie | 77 | 83 | -6 | -17 | +11 | -568 | 30,013 | 1,564 |
| Wakayama | 136 | 144 | -8 | -60 | +51 | -206 | 16,665 | 1,458 |
| Aomori | 49 | 66 | -17 | -1 | -14 | -15 | 19,137 | 1,055 |
| Tokushima | 36 | 56 | -20 | -31 | +11 | -259 | 9,438 | 721 |
| Iwate | 19 | 49 | -30 | -30 | +0 | -304 | 20,836 | 1,012 |
| Fukushima | 45 | 101 | -56 | -40 | -7 | -228 | 41,169 | 2,135 |
98,338 licensed facilities, 27,162 confirmed on sale — reading the definitional gap itself
Now cross-check against our own data. Of the domestic facilities MetroEngine Research tracked as of 2026, 27,162 facilities / 1,267,377 rooms can be confirmed as trading on OTAs. The licence-based statistic, meanwhile, counts 98,338 lodging facilities, with 1,782,232 rooms in the Hotel & Ryokan category.
The two use different populations. Neither is the “correct” one. The gap itself is the analytical material.
| Dimension | Licence basis | OTA-listing basis |
|---|---|---|
| Source | Report on Public Health Administration and Services | MetroEngine Research |
| As of | End of March 2025 | 2026 |
| Facilities | 98,338 | 27,162 |
| Rooms | 1,782,232 | 1,267,377 |
| Share by facility | 100% | 27.6% |
| Share by room | 100% | 71.1% |
Barely 30% overlap on a facility basis, yet roughly 70% overlaps on a room basis. In other words, facilities that appear in the statistics but are not sold in the market are overwhelmingly small. There are several plausible reasons: properties that hold a licence but do not sell year-round, seasonal-only operations, corporate and union retreats that never sell to the public, boarding-house operations that by their nature never appear on an OTA, and small ryokan that sell only by phone and direct booking. No single explanation covers them all.
The implication for investment practice is clear. Measure an area’s competing room supply using only “inventory listed on OTAs” and you miss close to 30% of it in room terms. Count competitors from the licence statistics alone and you count inventory that never actually reaches the market. Only with both in hand can you bracket the upper and lower bounds of the competitive set.
One caveat on our own data: 1,252 new openings have been confirmed for 2026, but that count is taken at the point OTA listings appear, and listings generally go live only a few months before opening. Recent months will rise as listings are reflected. By category, vacation rentals lead with 596; by prefecture, Hokkaido 120, Okinawa 82, Shizuoka 76, Tokyo 75, Kyoto 67 and Nagano 55. Small, dispersed inventory has become the mainstream of new supply — the same direction as the falling rooms-per-facility figure in the licence statistics.
Are rates weaker where closures run high? The correlation is thin
In prefectures with net exits, existing stock becomes scarcer and rates should be pushed up — that is at least a plausible mechanism. We checked whether it actually happens. For 24 prefectures we compared estimated transacted ADR over the trailing 12 months (August 2025 – July 2026) against the same period a year earlier, and set it beside the FY2024 withdrawals-to-permits ratio.
The correlation coefficient is −0.24 (N=24). The sign points in the direction of “the more withdrawals, the weaker the ADR growth”, but the magnitude is small and the explanatory power is close to nil. Averaged in groups, the net-exit group (withdrawals/permits ≥ 1.0, 9 prefectures) grew +5.0% and the net-entry group (ratio ≤ 0.40, 12 prefectures) +6.1% — a difference of just 1.1 points.
In other words, the claim that rates rise where supply has shrunk is not visible in the numbers. If anything, ADR growth is stronger where entry is concentrated: Okinawa (+14.5%, ratio 0.11), Fukuoka (+10.9%, 0.23), Hokkaido (+9.8%, 0.40). The more natural reading of the sequence is that supply gathers in markets where demand is growing, and rates rise at the same time.
Even at the high end of the withdrawals-to-permits ratio there are prefectures posting strong growth: Miyagi (0.96) +9.2%, Yamagata (1.14) +8.2%, Aomori (1.35) +7.4%. A high volume of closures does not translate into weak pricing. The conclusion of this section is that the correlation is weak and no causal reading should be taken from it. Supply movements and ADR are most likely both being pulled by a third variable — demand.
| Prefecture | Permits | Withdrawals | Withdrawals/permits | ADR, year-ago period | ADR, trailing 12 months | YoY | Facilities covered (median) |
|---|---|---|---|---|---|---|---|
| Iwate | 19 | 49 | 2.58 | ¥6,961 | ¥7,204 | +3.5% | 253 |
| Fukushima | 45 | 101 | 2.24 | ¥7,320 | ¥7,513 | +2.6% | 444 |
| Tokushima | 36 | 56 | 1.56 | ¥6,049 | ¥6,456 | +6.7% | 141 |
| Aomori | 49 | 66 | 1.35 | ¥7,296 | ¥7,838 | +7.4% | 184 |
| Toyama | 21 | 26 | 1.24 | ¥7,378 | ¥7,569 | +2.6% | 161 |
| Yamagata | 21 | 24 | 1.14 | ¥8,952 | ¥9,687 | +8.2% | 294 |
| Mie | 77 | 83 | 1.08 | ¥11,346 | ¥11,712 | +3.2% | 372 |
| Wakayama | 136 | 144 | 1.06 | ¥9,190 | ¥9,720 | +5.8% | 223 |
| Nara | 52 | 53 | 1.02 | ¥12,641 | ¥13,277 | +5.0% | 136 |
| Miyagi | 55 | 53 | 0.96 | ¥8,467 | ¥9,249 | +9.2% | 294 |
| Oita | 100 | 96 | 0.96 | ¥14,332 | ¥14,909 | +4.0% | 457 |
| Nagano | 452 | 244 | 0.54 | ¥11,087 | ¥12,082 | +9.0% | 836 |
| Hokkaido | 525 | 209 | 0.40 | ¥9,235 | ¥10,137 | +9.8% | 918 |
| Osaka | 155 | 60 | 0.39 | ¥10,718 | ¥10,724 | +0.1% | 646 |
| Kyoto | 291 | 101 | 0.35 | ¥15,869 | ¥16,570 | +4.4% | 585 |
| Shizuoka | 321 | 102 | 0.32 | ¥12,878 | ¥13,558 | +5.3% | 851 |
| Chiba | 251 | 79 | 0.32 | ¥9,634 | ¥10,186 | +5.7% | 422 |
| Kagoshima | 213 | 61 | 0.29 | ¥6,655 | ¥6,848 | +2.9% | 314 |
| Fukuoka | 200 | 47 | 0.23 | ¥10,622 | ¥11,781 | +10.9% | 460 |
| Tochigi | 193 | 37 | 0.19 | ¥10,780 | ¥10,594 | -1.7% | 401 |
| Yamanashi | 257 | 41 | 0.16 | ¥11,067 | ¥11,774 | +6.4% | 297 |
| Okinawa | 524 | 57 | 0.11 | ¥10,301 | ¥11,793 | +14.5% | 495 |
| Kagawa | 160 | 15 | 0.09 | ¥7,539 | ¥8,140 | +8.0% | 155 |
| Tokyo | 1,589 | 113 | 0.07 | ¥13,651 | ¥14,631 | +7.2% | 1144 |
Translating this into acquisition and development criteria
Now put these numbers into the language of decisions. Net supply is not a reading of “market temperature” — it indicates which way the relative value of existing stock is moving.
1. The 30 prefectures that lost rooms — markets where scarcity accumulates
Markets where a handful of large exits strip out room stock: Chiba −2,421 rooms, Kumamoto −1,971, Oita −1,654. For an owner or acquirer of existing assets, competition is thinning from the supply side. It is essential to read this together with occupancy and rate, to confirm demand is not contracting at the same time.
2. Net entry, but small-format — look at the shape of the competition
Tokyo added 1,436 facilities for +4,189 rooms; Okinawa added 460 for +1,295. In both, the added inventory averages around three rooms per facility. It will not necessarily compete head-on with mid- to large-scale hotels; rather, a separate layer of inventory serving group and extended-stay demand is thickening. These are markets where the competitive set should be redefined by room-count band, not by number of competitors.
3. The Osaka pattern — supply pressure that shows up in rooms
Osaka added 70 facilities and 5,463 rooms — 78 rooms per facility, the continuation of conventional mid- to large-scale hotel development. In markets of this shape, new supply targets the same demand segment as existing stock, so the conventional method of measuring room-based supply pressure against existing stock still works.
As a practical order of checks: (1) the sign of the room-based change in the target area, (2) how many facilities produced that change (rooms per case), and (3) the size of the gap between the licence base and the OTA-listed base. Those three lift the resolution of the supply picture by a step. Looking only at case counts, or only at new openings, misses all of it.
One more thing. The 2,817 withdrawals recorded in FY2024 is a low level — 45% below the 5,130 of FY2020. The structural drivers have not gone away: succession deadlines, ageing buildings, ageing owner-operators. As the cases in Japan Hotel Closures 2026 show, exits happen for property-specific reasons, and the pressure from succession cost versus earning power continues. Net supply being positive today does not guarantee it stays positive.
Sensitivity of net supply — do permits or withdrawals drive it?
The measured figure in this article is net +4,903, but that rests on a single assumption: withdrawals at 2,817, the lowest exit level in five years. We mechanically substituted alternative inputs — using only actual figures published in this article — to show what happens if exits revert cyclically. This is a sensitivity analysis with stated assumptions, not a forecast.
| Scenario | Permits | Withdrawals | Net supply | Withdrawals/permits | Assumption |
|---|---|---|---|---|---|
| Pessimistic | 6,514 | 5,130 | +1,384 | 0.79 | Permits fall back to the FY2023 level and withdrawals return to the COVID-era (FY2020) level |
| Base | 7,720 | 2,817 | +4,903 | 0.36 | FY2024 actuals held flat (= the measured figure in this article) |
| Optimistic | 8,926 | 2,817 | +6,109 | 0.32 | Permits grow by the most recent increment (+1,206/year) and withdrawals stay at the FY2024 level |
| Withdrawals \ permits | 6,500 | 7,000 | 7,720 | 8,400 | 8,900 |
|---|---|---|---|---|---|
| 2,817 | +3,683 | +4,183 | +4,903 | +5,583 | +6,083 |
| 3,500 | +3,000 | +3,500 | +4,220 | +4,900 | +5,400 |
| 4,000 | +2,500 | +3,000 | +3,720 | +4,400 | +4,900 |
| 4,600 | +1,900 | +2,400 | +3,120 | +3,800 | +4,300 |
| 5,130 | +1,370 | +1,870 | +2,590 | +3,270 | +3,770 |
Methodology and sources
The primary data for this article is the FY2024 (fiscal 2024) annual report of the Ministry of Health, Labour and Welfare’s Report on Public Health Administration and Services — Table 8 (“Facilities and rooms in Hotel & Ryokan operations; facilities, permits, withdrawals and dispositions in simple lodging and boarding-house operations, by prefecture / designated city / core city”) and Appendix Table 1 (“Number of theatres, lodging businesses, public baths, barber and beauty salons and laundries, by year”). We retrieved the original tables (CSV) published on e-Stat and aggregated them by prefecture. Year-on-year comparison uses the same tables for FY2022 and FY2023, and the statistical database for FY2020 and FY2021 (table IDs 0004027008 and 0004048183).
On splicing the time series: the revision of the Hotel Business Act in force from 15 June 2018 merged the “hotel operations” and “ryokan operations” categories into “Hotel & Ryokan operations”. For FY2017 and earlier, therefore, “Hotel & Ryokan operations” is spliced as the sum of the two former categories, following the notes in the source tables. The same revision abolished the minimum room-count requirements (10 rooms for hotel operations, 5 for ryokan operations), which must be taken into account when reading the facility-count trend.
In the source tables, permits and withdrawals are published as totals for the lodging business as a whole — Hotel & Ryokan, simple lodging and boarding-house operations combined — with no breakdown by category. The category-level changes shown in this article are derived values, computed from year-on-year differences in the fiscal-year-end stock. The source tables also note that in FY2010, parts of Miyagi and Fukushima were excluded from the tabulation because of the Great East Japan Earthquake; that year should not be compared at face value.
Estimated transacted ADR is compiled by MetroEngine Research & Consulting. Only months with confirmed actuals are used; estimated figures for future months are excluded. Months in which the number of covered facilities falls below 60% of the series median are dropped as thin samples.
⚠ A note on fiscal-year labelling: all facility counts, room counts, permits and withdrawals in this article are FY2024 (fiscal 2024) figures. The fiscal-year-end reference date is 31 March 2025, and permits and withdrawals cover the flow from April 2024 to March 2025. FY2025 figures were not yet published at the time of writing.
Related reading
- Hotel Supply Pressure Ranking 2026-2027: Ozu Kumamoto Tops at 30.8%
- Lodging Supply Denominator: 44,901 Simple Lodgings Move Kyoto 21st→5th
- Japan Hotel Closures 2026: 3 Hotels, 316 Rooms Closed, 1,149 Delayed
- Tokyo 23 Wards Supply Pressure 2026: Arakawa 16.0%, Minato Just 4.5%
- 226k Hotel Rooms in 32 Regional Cities: 42.7% Built Before 1996
References and sources
■ Government statistics (primary sources)
- e-Stat: statistical table index for the FY2024 Report on Public Health Administration and Services annual report (MHLW) — source tables (CSV) for Table 8 and Appendix Table 1
- MHLW: Report on Public Health Administration and Services survey page
- House of Representatives: Act Partially Amending the Hotel Business Act (Act No. 84 of 2017)
- e-Gov Law Search: Hotel Business Act (Act No. 138 of 1948)
- Tokyo Metropolitan Government Bureau of Public Health: Overview of the amended Hotel Business Act (28 March 2018) — category merger and abolition of the minimum room-count standard
■ Data sources
Original tables of the Ministry of Health, Labour and Welfare’s Report on Public Health Administration and Services, annual reports FY2020–FY2024 (Table 8 and Appendix Table 1), re-aggregated by prefecture. Estimated transacted ADR is compiled by MetroEngine Research & Consulting using only months with confirmed actuals (24 prefectures, N=24; trailing 12 months = August 2025 – July 2026).
■ Calculation assumptions
Net supply = permits granted − business withdrawals (a term used in this article, not a published statistic). Category-level changes are derived from year-on-year differences in fiscal-year-end stock. The three scenarios and the sensitivity table take only figures published in this article as inputs: pessimistic = 6,514 permits (FY2023) and 5,130 withdrawals (FY2020); base = FY2024 actuals held flat; optimistic = permits plus the most recent annual increment of +1,206, with withdrawals held at the FY2024 level.
■ Limitations and caveats
Permits and withdrawals are published only as the total across the three lodging categories, with no category breakdown. Room counts are published for Hotel & Ryokan operations only. The revision of the Hotel Business Act in force from 15 June 2018 merged the business categories and abolished the minimum room-count standard, so FY2017 and earlier require splicing. In FY2010, parts of Miyagi and Fukushima were excluded from the tabulation because of the Great East Japan Earthquake. The three scenarios and the sensitivity table are mechanical substitutions of assumptions, not forecasts. The correlation between the withdrawals-to-permits ratio and ADR is weak at −0.24 and does not indicate causation.
■ Market data
- MetroEngine Research & Consulting — estimated transacted ADR (24 prefectures, confirmed-actual months); facility and room counts on an OTA-listing-confirmed basis (2026: 27,162 facilities / 1,267,377 rooms); category and prefecture breakdown of the 1,252 openings confirmed for 2026