

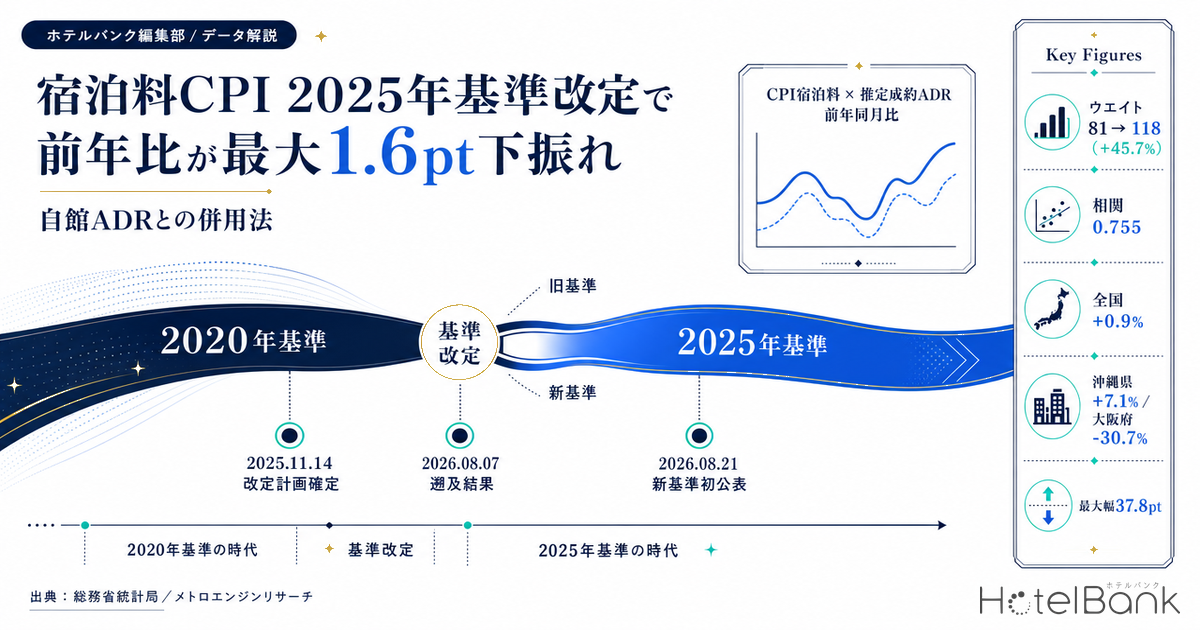
With the release of the “2025-base Consumer Price Index, Japan, July 2026” published by the Ministry of Internal Affairs and Communications on 21 August 2026, the base year of Japan’s Consumer Price Index (CPI) shifted from 2020 to 2025. Rebasing happens once every five years, but this round is not something the lodging industry can treat as someone else’s problem: of the four items the Statistics Bureau itself singled out as “main items whose contribution differs between the old and new bases,” one is lodging. The June 2026 YoY change for lodging was 3.1% on the old (2020) base and 1.5% on the new (2025) base — a 1.6-point gap for the same month and the same item.
This article first confirms what the rebasing actually changed, using the Statistics Bureau’s own primary documents, and then sets the official lodging CPI side by side with the estimated settled ADR we compile, to clarify what each one is measuring. The goal is not to decide which is correct, but to make it possible to judge which one to cite for which purpose.
Metric Definitions Used in This Article
- ADR (average daily rate) = an estimated settled rate (tax-excluded equivalent) calculated by applying a category-specific adjustment coefficient to each property’s lowest published plan level on booking sites (double occupancy, per-room rate, tax-included). Cross-checked against per-property results disclosed by listed hotel REITs, the median error is 6.6% (verified categories: business / city / resort / ryokan / capsule). These are estimates and differ from each property’s actual transaction prices or accounting figures. Area-level ADR is the median of the properties covered (the level of a typical property in that area).
- Year-on-year (YoY) = comparison of the month in question with the same month a year earlier. The estimated settled ADR in this article uses only comparisons between verified-history months (settled months); forward months on a listing-snapshot basis are excluded.
- Listed price, where referenced, is the per-room rate at double occupancy (tax-included, average of all plans).
- Data sources: MetroEngines Research (internal data) / Statistics Bureau of Japan, “Consumer Price Index” (official statistics)
- — 1.6 points — the June 2026 YoY change for lodging was 3.1% on the 2020 base but 1.5% on the 2025 base. That dwarfs the 0.1-point downward revision to the all-items index.
- — Weight 81 → 118 (+45.7%) — the weight for lodging, which had been fixed by pandemic-era household spending (the 2019-2020 average), reverted to a 2025 Family Income and Expenditure Survey basis.
- — Rates of change are not recalculated — the Statistics Bureau links the index levels but keeps the published rate of change from each base as-is. Old and new agree through December 2025; the divergence starts in January 2026.
- — Correlation 0.755, gap up to 11 points — lodging CPI and estimated settled ADR move in the same direction, but they differ in properties covered, plans covered, when the price is captured, and outlier handling — and even the sign of the level gap flips.
- — A 37.8-point spread hides inside the national +0.9% — July 2026 estimated settled ADR YoY ranges from Okinawa +7.1% to Osaka -30.7%. A single national figure will not match what any one trade area feels.
From the July 2026 release, the 2025 base — checking the revision against primary sources
Japan’s CPI has been rebased every five years since 1955. The statistical standard “Statistical Standard Concerning the Base Period of Indices” (MIC Notification No. 112 of 2010), established under the Statistics Act, requires the base period of an index to be updated every five years to a year ending in 0 or 5. The current revision plan was finalised on 14 November 2025, the retroactive results were released on 7 August 2026, and the first monthly release on the new base came on 21 August 2026 (covering July 2026).
The item basket now stands at 589 items, after 19 additions, 11 deletions, and the merger of two items into one — a net increase of seven from the 582 items under the old base. Weights are built from the Family Income and Expenditure Survey’s 2025 average monthly expenditure per household by item. This is where it matters for the lodging industry: the 2020-base weights had been set under a special measure that used two years of expenditure, 2019 and 2020, to account for the impact of COVID-19. In other words, household spending from a period when travel demand had evaporated governed the weight of lodging for five years.
| Item | 2020 base | 2025 base |
|---|---|---|
| Base period of the index | 2020 = 100 | 2025 = 100 |
| Number of items | 582 items | 589 items (19 added, 11 dropped, 2 merged into 1) |
| Reference year for weights | Two-year average of 2019 and 2020 (special measure reflecting the pandemic) | 2025 (Family Income and Expenditure Survey, two-or-more-person households) |
| Weight of lodging | 81 (per 10,000) | 118 (per 10,000) / +45.7% |
| Items using a model formula | 74 items | 78 items (2 removed, 6 added) |
| Seasonal adjustment software | X-12-ARIMA | X-13ARIMA-SEATS |
| Item name changes | — | 43 items (e.g. “sebiro-fuku” renamed “men’s suits”) |
| Linking old and new indices | A linked index is produced for time-series comparison. However, rates of change — month-on-month, year-on-year, annual — are not recalculated from the linked index; the values published under each base are used as-is | |
Source: Statistics Bureau of Japan, “Explanation of the 2025-base Consumer Price Index” (July 2026); compiled by the HotelBank Editorial Team
The last row of the table is the premise that runs through this entire article. The Statistics Bureau links the old and new indices, but states explicitly that rates of change are not recomputed from the linked index. That means the “YoY published on the 2020 base” and the “YoY published on the 2025 base” both stand as official published figures for the same month. The number changing depending on which one you cite is not an error — it is the design working as intended.
Lodging is one of four items named as having a materially different contribution
On 7 August 2026 the Statistics Bureau released “Retroactive Results of the 2025 Base Revision of the Consumer Price Index,” disclosing for itself how results shift between the old and new bases. For the all-items index, the June 2026 YoY was 1.7% on the 2020 base and 1.6% on the 2025 base — a downward revision of only 0.1 point. Set against past rebasings, where the 2010-base and 2020-base revisions moved some months by 0.7 point, the impact on the headline index this time is on the small side.
At the item level, though, the story changes. The same document names four items as “main items whose contribution differs between the old and new bases”: kerosene, lodging, chocolate, and mobile phone charges. For lodging, the June 2026 YoY was 3.1% on the 2020 base versus 1.5% on the 2025 base. Against the 0.1-point downward revision to the headline, lodging moved by 1.6 points — a difference of an entirely different order.
Source: Statistics Bureau of Japan, “Consumer Price Index” (e-Stat, 2020 base / 2025 base); compiled by the HotelBank Editorial Team
As the chart shows, YoY changes through December 2025 match exactly between the old and new bases — the Bureau’s rule that past rates of change are not recalculated. The gap opens from January 2026: -0.5 in January, -0.9 in April, -1.2 in May, -1.6 points in June, with the new base printing progressively lower month by month.
| 2026 | 2025 base | 2020 base | Difference (pt) | Ref.: all items (2025 base) |
|---|---|---|---|---|
| January | 5.5 | 6.0 | -0.5 | 1.5 |
| February | 5.7 | 6.0 | -0.3 | 1.3 |
| March | 4.5 | 5.0 | -0.5 | 1.5 |
| April | 3.7 | 4.6 | -0.9 | 1.4 |
| May | 3.6 | 4.8 | -1.2 | 1.5 |
| June | 1.5 | 3.1 | -1.6 | 1.6 |
| July | 0.9 | not published | — | 1.9 |
Source: Statistics Bureau of Japan, “Consumer Price Index” (e-Stat) / “Retroactive Results of the 2025 Base Revision of the Consumer Price Index” (7 August 2026); compiled by the HotelBank Editorial Team. The June 2026 lodging figures match those stated in the retroactive-results document. Monthly publication on the 2020 base ended with the June 2026 release, so July is shown on the new base only.
Why did an item-level figure move this much? In an appendix to the same document, the Bureau presents a framework decomposing the contribution gap between the old and new bases into four parts: a weight effect, a reset effect, a model-formula effect, and an item-revision effect. For the all-items index, the -0.03-point contribution gap breaks down into a weight effect of +0.10, a reset effect of -0.15, a model-formula effect of 0.00, and an item-revision effect of +0.02.
The third term, the “model-formula effect,” is stated to include the impact on YoY changes arising from updates to national item-level price indices that follow the updating of municipality-level weights. The national lodging index is built up by taking price indices for each surveyed municipality and weighting them together with municipality-level weights. If rebasing updates those municipality weights, the YoY of the item itself can change. In lodging’s case, even though the weight rose from 81 to 118 (a weight effect that works to enlarge the contribution), the contribution shrank from 0.03 to 0.02. The decline in YoY more than offset the higher weight.
What this means in practice: if you are using first-half-2026 lodging YoY figures in internal materials or external explanations, the numbers need updating. A deck that said “lodging rose 4.8% year on year (May 2026)” now reads 3.6% on the current published basis. Neither is wrong, since both are published values — but a citation that does not state the base year will conflict with whatever the other side looks up.
Index levels can be “linked,” but must not be spliced across bases
Changing the base changes how the index level itself reads. The July 2026 lodging index is 101.4 on the 2025 base (2025 = 100). It looks nothing like the old base’s frame of reference (2020 = 100, running in the 160s), yet both point at the same prices in the same month. The Bureau does provide a linked index but, to repeat, does not recompute rates of change. So when building “a single line chart of the index running from 2021 to 2026,” you must always state which base the series comes from. We have previously examined how far lodging outpaced other expenditure categories on the old base (2020 = 100) in our analysis of 2026 price pass-through; the index levels used there are subject to re-reading under this revision.
Below is the 2025-base lodging index (2025 = 100) plotted from January 2021, including retroactive values. It is a single-base series with no old-base figures mixed in.
Source: Statistics Bureau of Japan, “Consumer Price Index (2025 base)” (e-Stat); compiled by the HotelBank Editorial Team. Figures through June 2026 are retroactive values produced by the rebasing; July 2026 is the first monthly release on the new base.
The trough in autumn 2022 coincides with the period when discounts under the nationwide travel demand stimulus programme were being reflected in prices. The index fell to 55.6 in November 2022, about 1.9 times below the recent peak of 108.3 in August 2025. That change in level over just under four years is itself the backdrop to lodging’s weight being raised from 81 to 118. The presence of lodging in household budgets clearly recovered across the rebasing.
Lodging CPI and your own ADR are not measuring the same thing
Everything above is internal to the official statistics. The next question is what happens when you place those figures next to your own results. The short answer: these are not competing estimates of one quantity but separate metrics that differ in coverage, timing, and price definition alike. Appendix 3 of the Statistics Bureau’s “Explanation of the 2025-base Consumer Price Index” documents in detail how the lodging index is constructed.
| Dimension | CPI lodging (Statistics Bureau of Japan) | Estimated settled ADR (MetroEngines Research) |
|---|---|---|
| Purpose | Measuring price change for goods and services purchased by households | Estimating the prevailing rate level on the property side |
| Properties covered | Roughly 400 representative lodging properties selected by prefecture (chosen on the basis of guest counts by travel destination and capacity from the Japan Tourism Agency’s Overnight Travel Statistics Survey) | Properties with confirmed activity on booking sites. This article covers 7,131-8,109 properties per month across 12 major prefectures |
| Plans covered | Limited to “Japanese-style room, one night with two meals” for ryokan and “Western-style room, one night with breakfast” for hotels | Each property’s lowest plan level (room-only plans included), with a category-specific adjustment coefficient applied |
| When the price is captured | As a rule, the price collected at the beginning of the month two months before the stay date | A settled level estimated from the trajectory of listed prices by stay date (settled months use a verified-history basis) |
| Outlier handling | Prices are log-transformed and, by booking site, stay date, and property, those beyond three standard deviations from the mean are excluded. Both extreme high settings and extreme sale prices drop out | No exclusions. Discounts and premium settings alike feed straight into the level |
| Missing values | Imputed by regression using booking site, stay date, and property as dummy variables | Only observed properties are aggregated, with the sample size stated alongside |
| Aggregation method | A chain method multiplying the previous month’s index by the ratio of geometric mean prices for the current and previous month. Aggregated to a national figure with municipality-level weights | Property-level values represented by the area median |
| Price unit | The selling price of a plan, including indirect taxes such as consumption tax collected as part of the purchase | Estimated settled rate per room (double occupancy), tax-excluded equivalent |
| Distribution channel | Selling prices via booking sites | Booking-site listings only. Group, corporate-contract, negotiated, and direct bookings are excluded |
Source: Statistics Bureau of Japan, “Explanation of the 2025-base Consumer Price Index,” Appendix 3 and Part III-1 / MetroEngines Research; compiled by the HotelBank Editorial Team
Two points deserve particular attention. The first is the restriction on plans covered: CPI lodging looks only at two-meal plans for ryokan and breakfast-inclusive plans for hotels. Urban business demand with a high room-only share, and properties that sell breakfast separately, do not enter the index directly. Depending on how the meal premium moves within a single property, a room-only rate and a breakfast-inclusive rate will trace separate paths.
The second is when the price is captured. The Bureau’s documentation states that “as a rule, the price collected at the beginning of the month two months before the stay date is used.” For a room occupied on 18 July, the material for the index is the price listed on booking sites as of 1 May. For any property running dynamic pricing, that is nothing other than a setting from roughly two to three months earlier. Subsequent increases as inventory sells down, and last-minute demand adjustments, do not enter that month’s index.
How far does the two-months-ahead price sit from the final level?
We checked how much that “beginning of the month two months prior” timing actually matters, using our own listed-price data. For four stay dates in Tokyo, Table 4 sets the average listed price on the day corresponding to the CPI collection timing (the beginning of the month two months before the stay date) against the average listed price immediately before the stay date. All figures are per-room rates at double occupancy (tax-included, average of all plans), making this a like-for-like comparison on the same listed-price basis the CPI uses.
| Stay date | Collection-equivalent day | Listed price that day | Listed price just before | Change |
|---|---|---|---|---|
| Sat 13 June 2026 | 1 April (73 days prior) | ¥32,100 | ¥33,600 | +4.9% |
| Wed 24 June 2026 | 1 April (84 days prior) | ¥22,700 | ¥22,400 | -1.7% |
| Wed 8 July 2026 | 30 April (69 days prior) | ¥23,100 | ¥22,000 | -4.8% |
| Sat 18 July 2026 | 30 April (79 days prior) | ¥33,500 | ¥35,800 | +7.0% |
Source: MetroEngines Research; compiled by the HotelBank Editorial Team. Tokyo, all property categories; 1,169-1,285 properties observed at each point. Listed prices are per-room rates at double occupancy (tax-included, average of all plans). The collection-equivalent day is the observation date corresponding to the Statistics Bureau’s “beginning of the month two months before the stay date.” N = 4 dates, illustrative only; not representative of all dates.
With only four dates this is a limited sample, but the directions split cleanly: Saturdays at +4.9% and +7.0%, Wednesdays at -1.7% and -4.8%. On strong-demand weekends the level steps up towards the stay date; on weekdays it eases. A price fixed at the beginning of the month two months prior structurally fails to capture that back half of the movement. When the market as a whole tightens, the index can print below the prevailing level; when it loosens, it can print above it. On top of that, because the CPI drops prices beyond three standard deviations of the log price as outliers, steep last-minute discounts and standout peak-day rates are also unlikely to make it into the index.
This is consistent with what we have covered separately in the distribution of price-revision lead times, and with our work on discounting behaviour in the final two weeks before arrival. The window in which pricing work actually happens and the window in which official statistics take their snapshot simply do not overlap.
CPI and estimated settled ADR point the same way, but the levels do not match
With those definitional differences in view, here are the two series side by side. The chart below overlays lodging CPI YoY (2025 base) with the YoY of the estimated settled ADR we compile (median across 12 major prefectures, settled months only) from January 2024 through July 2026. Because forward months sit on a listing-snapshot basis that lifts only the current-year side, YoY here is restricted to settled-month against settled-month comparisons.
Source: Statistics Bureau of Japan, “Consumer Price Index (2025 base)” (e-Stat) / MetroEngines Research; compiled by the HotelBank Editorial Team. Estimated settled ADR is the median YoY across 12 prefectures: Tokyo, Osaka, Kyoto, Hokkaido, Okinawa, Fukuoka, Aichi, Kanagawa, Chiba, Hyogo, Nagano and Shizuoka. Property counts run 7,131-8,109 per month (12-prefecture total; July 2026 N = 8,049).
Across 31 months the correlation coefficient is 0.755 — directionally well aligned. Lodging as a price statistic and the prevailing rate on the property side both trace the same broad arc: a sharp run-up in the first half of 2024, a gradual deceleration, a re-acceleration in late 2025, then a stall in mid-2026.
The levels, however, diverge persistently, and the sign of the divergence flips partway through. Throughout 2024 the CPI ran higher, with an 11.0-point gap in June. That reversed in the second half of 2025, and by November the estimated settled ADR sat 8.0 points above the CPI. From June 2026 the CPI is on top again: July 2026 shows CPI +0.9% against estimated settled ADR -3.1%, a 4.0-point gap.
Given that the two measure different things, this reversal should be read as a natural outcome rather than a contradiction. The identifiable drivers line up as follows. First, the CPI is a national figure aggregating roughly 400 representative properties with municipality-level weights, while our figure is a median across 12 major prefectures — the geographic composition differs. Second, the CPI is limited to two-meal and breakfast-inclusive plans, whereas our estimated settled ADR starts from the lowest plan level including room-only. Third, because the CPI draws on prices from two months earlier, it responds late at market turning points. Fourth, the CPI removes outliers, which smooths out large price movements.
A single national number absorbs the spread between prefectures
The other thing easily missed is regional variation. Lodging CPI for July 2026 was +0.9% YoY nationally, but the estimated settled ADR YoY for the same month ranges from Okinawa at +7.1% to Osaka at -30.7% — a spread of 37.8 points.
Source: MetroEngines Research; compiled by the HotelBank Editorial Team. Estimated settled ADR YoY for July 2026. Property count N = 8,049 (12-prefecture total). The dashed line is lodging CPI YoY for the same month (2025 base, national), +0.9%.
Osaka’s steep decline reflects comparison against the elevated levels during the 2025 World Expo period. Estimated settled ADR for July 2025 was ¥12,600 there, versus ¥8,800 in July 2026. Okinawa, by contrast, moved from ¥12,800 to ¥13,700 and Hokkaido from ¥12,000 to ¥12,200, holding their levels. The national CPI’s +0.9% is what emerges once that spread is weighted together with municipality-level weights — and it is only to be expected that it does not match the felt experience of any individual trade area.
For a finer breakdown of YoY by prefecture and property category, see H1 2026 ADR YoY across 47 prefectures and four hotel categories. Behind the same national average, splitting by category reveals 31 prefectures where the signs diverge.
Choosing the right statistic for the right conversation
There are at least three settings in which a property has to explain a rate increase or a pricing revision externally: applying for municipal subsidies and grants, presenting the business to a bank, and explaining pay rises to staff. Each calls for a different kind of number.
| Setting | Primary statistic | What to state alongside |
|---|---|---|
| Municipal subsidy / grant applications | CPI (all items and lodging). Official statistics, independently verifiable. Always state the base year and the publication month | The gap between the national figure and your own trade area; that the CPI rests on roughly 400 representative properties nationwide |
| Presenting the business to a bank | Your own ADR, OCC and RevPAR as the backbone; CPI as supporting evidence for the macro environment | Competitor levels in the same trade area; the trend on a 12-month moving basis rather than a single month |
| Explaining pay rises and better conditions | CPI all items (closest to lived cost of living). Lodging CPI belongs on the selling-price side of the argument | How selling-price growth maps to price inflation. July 2026: all items +1.9% / lodging +0.9% |
Source: compiled by the HotelBank Editorial Team
This is where the rebasing bites. Write “lodging rose 3.1% year on year (June 2026)” in a document submitted on or after 21 August 2026, and the recipient checking the current published value will find 1.5%. Beyond swapping the numbers, the safer move is to switch to a practice of writing “2025 base” explicitly. Conversely, for periods up to December 2025 the rates of change agree across bases, so there is no need to go back and correct older materials.
There is one more practical implication. Lodging’s weight rising from 81 to 118 means that, statistically, hotel pricing now carries more influence over national consumer prices than it used to. In the Bureau’s retroactive-results document, lodging was named as one of four items with a notable contribution gap. The frequency with which lodging prices feature in inflation coverage may well rise from here. If the number of occasions on which pricing decisions have to be publicly justified increases, there is real value in having settled in advance on what you compare your own rate revisions against, and under what definition.
The margin to allow when reading your own prevailing rate off the CPI
Everything so far argues that these are two different metrics — but in practice there are moments when only one of them is at hand. If your trade-area data is not ready when a quarterly deck is due, you end up inferring the prevailing rate from the published CPI. How wide a margin to allow is answered directly by the observed divergence between the two. Below, the divergence figures already presented in this article are simply re-arranged as a re-reading margin. No new assumptions are introduced.
| Scenario | Month observed | Divergence (CPI − estimated settled ADR) | How it looks if you cite the CPI |
|---|---|---|---|
| Pessimistic (CPI looks stronger than the market) | June 2024 | +11.0pt | Presenting the CPI YoY as your own rate increase overstates the market by up to 11 points |
| Central (most recent divergence) | July 2026 | +4.0pt | CPI +0.9% against estimated settled ADR -3.1%. Some months the direction does not even agree |
| Optimistic (market runs above the CPI) | November 2025 | -8.0pt | Citing the CPI understates your own rate growth by 8 points |
Source: Statistics Bureau of Japan, “Consumer Price Index (2025 base)” (e-Stat) / MetroEngines Research; compiled by the HotelBank Editorial Team. The divergences are observed values read off the 31-month overlay shown above and do not forecast future divergence. Estimated settled ADR is the median across 12 major prefectures (July 2026 N = 8,049).
Placing those three levels as columns and the 2026 lodging CPI (published values on the 2025 base) as rows gives an indicative YoY for the prevailing ADR implied by the CPI. Every cell is simply “published CPI value − divergence”; no new estimate enters.
| Lodging CPI (2025 base) | -8.0pt Estimated settled ADR above the CPI (observed, November 2025) | 0.0pt No divergence (reference column) | +4.0pt Most recent divergence (observed, July 2026) | +11.0pt CPI far above the market (observed, June 2024) |
|---|---|---|---|---|
| January 2026 (5.5%) | +13.5% | +5.5% | +1.5% | -5.5% |
| March 2026 (4.5%) | +12.5% | +4.5% | +0.5% | -6.5% |
| May 2026 (3.6%) | +11.6% | +3.6% | -0.4% | -7.4% |
| June 2026 (1.5%) | +9.5% | +1.5% | -2.5% | -9.5% |
| July 2026 (0.9%) | +8.9% | +0.9% | -3.1% | -10.1% |
Source: rows are the 2025-base published values from Table 2; columns are the observed divergences from Table 6. Cell = row value − column divergence (arithmetic by the HotelBank Editorial Team). Red marks territory below the prior year. The bold column applies the most recent divergence, from July 2026.
Two things stand out. First, applying the most recent divergence (+4.0pt), CPI levels from May 2026 onward put the prevailing rate into negative territory. A combination in which the CPI holds a small positive while your own property is below the prior year is entirely plausible. Second, assuming the widest observed divergence (+11.0pt), even January 2026 — where the CPI showed 5.5% — implies a prevailing rate of -5.5%. If you are going to use CPI YoY as a proxy for your own rate revisions, you need to assume a re-reading margin on the order of ten points in either direction.
Summary
From the July 2026 release, the Consumer Price Index moved to the 2025 base. The effect on the headline index was a modest 0.1 point, but the Statistics Bureau singled out lodging as an item with a large contribution gap, and its June 2026 YoY was revised down by 1.6 points, from 3.1% to 1.5%. The weight rose 45.7%, from 81 to 118 — a weight set by pandemic-era household spending returning to a normal-times level.
Lodging CPI and your own ADR differ in properties covered, plans covered, when the price is captured, and how outliers are treated. Across 31 months the correlation is 0.755 and the direction aligns, but the level gap opens to as much as 11 points and its sign reverses. Neither is the correct one: one measures household prices, the other the selling-rate level at properties. The practical approach is to divide the roles — official statistics as the shared language for external explanation, your own data as the input to decisions.
The immediate to-do list is simple. Update the figures in any internal or external material citing lodging CPI from January 2026 onward, and from here on state “2025 base” explicitly. And build in the expectation that a single national number and your own trade area’s number will disagree. Behind the national +0.9% for July 2026 sits a spread running from Okinawa at +7.1% to Osaka at -30.7%.
Frequently asked questions
Q. Since when has the 2025-base Consumer Price Index been published?
The “2025-base Consumer Price Index, Japan, July 2026,” released on 21 August 2026, is the first monthly publication on the new base. Ahead of that, retroactive results were released on 7 August 2026, converting past index levels to 2025 = 100. Monthly publication on the 2020 base ended with the June 2026 release.
Q. How are previously published YoY figures treated after the rebasing?
The Statistics Bureau links the old and new indices so they can be compared as a time series, but stipulates that rates of change — month-on-month, year-on-year and annual — are not recomputed from the linked index; the values published under each base are used as-is. Rates of change through December 2025 therefore agree across bases, and the difference arises from January 2026 onward.
Q. How much did the lodging YoY change as a result of the rebasing?
For June 2026 the figure was 3.1% on the 2020 base and 1.5% on the 2025 base — a 1.6-point difference. That is large relative to the 0.1-point difference in the headline index for the same month, and the Statistics Bureau lists lodging as one of the “main items whose contribution differs between the old and new bases.” Lodging for July 2026 is 0.9% on the 2025 base.
Q. How did the weight of lodging in the CPI change?
It rose 45.7%, from 81 to 118 per 10,000. The 2020-base weight was built from a two-year average of 2019 and 2020 to account for the pandemic, and so reflected household spending during a period of depressed travel demand. The 2025 base rests on the 2025 Family Income and Expenditure Survey (two-or-more-person households).
Q. Why doesn’t the CPI for lodging match my property’s ADR?
Because they measure different things. The CPI covers only “Japanese-style room, one night with two meals” plans at ryokan and “Western-style room, one night with breakfast” plans at hotels, uses as a rule the price collected at the beginning of the month two months before the stay date, and excludes prices beyond three standard deviations of the log price as outliers. It also covers roughly 400 properties nationwide. Our estimated settled ADR, by contrast, starts from the lowest plan level including room-only, applies no outlier exclusion, and is calculated per room (double occupancy) on a tax-excluded-equivalent basis.
Q. Which figure should I use for external explanations?
It depends on the purpose. Where third-party verifiability matters — municipal subsidy and grant applications, explaining pay rises — use the CPI as an official statistic, stating the base year and publication month. Where you are explaining your own revenue structure, such as presenting the business to a bank, your own results are the backbone and the CPI serves as supporting evidence for the macro environment.
Related reading
- H1 2026 ADR YoY: 16 Prefectures Aligned, 31 Split Across 4 Categories
- When Do Hotels Raise Rates? 12,821 Hotels: Hikes Win Only LT30-15
- Japan FY2025 Travel Spend ¥8.39tn: Growth Went Outside the Room Bill
- Do Hotel Prices Stall at Round Numbers? 29.2M Listed Rates Say No
- Listed vs Settled ADR Gap: Japan’s 46-Prefecture Upside Map 2026
References and sources
■ Data sources
Official statistics: Statistics Bureau of Japan, “Consumer Price Index” (2025 base and 2020 base; item “lodging,” national monthly series; e-Stat table IDs 0004052037 and 0003427113), together with “Explanation of the 2025-base Consumer Price Index” (July 2026) and “Retroactive Results of the 2025 Base Revision of the Consumer Price Index” (7 August 2026). Internal data: MetroEngines Research estimated settled ADR by area (12 major prefectures, January 2023 – July 2026, settled months only, N = 7,131-8,109 properties per month; July 2026 N = 8,049), and listed-price trajectories by stay date for Tokyo (four dates: 13 June, 24 June, 8 July and 18 July 2026; 1,169-1,285 properties observed).
■ Calculation assumptions
YoY comparisons restrict the estimated settled ADR side to verified-history (settled) months on both sides, excluding forward months on a listing-snapshot basis. Prefecture-level values are medians of the properties in each area, and the 12-prefecture representative value is the median of those. The correlation coefficient is calculated across the 31 monthly YoY pairs from January 2024 to July 2026. The divergence scenarios in Tables 6 and 7 use the observed divergences presented in the body text as-is (June 2024 +11.0pt / July 2026 +4.0pt / November 2025 -8.0pt), and the cells in Table 7 are the arithmetic “published CPI value − divergence.” No new forward-looking assumptions are introduced.
■ Limitations and caveats
Lodging CPI and estimated settled ADR are distinct metrics differing in properties covered, plans covered, when prices are captured, outlier handling and tax treatment; neither is the correct answer for the other. They are not intended for level comparison on a single axis. Index levels on the 2020 and 2025 bases likewise cannot be spliced into a single series (rates of change are, by rule, the values published under each base). Table 4 is illustrative, covering four dates in Tokyo only, and does not represent all dates or the country as a whole. The ranges in Tables 6 and 7 are the observed range over the past 31 months and do not guarantee future divergence. Estimated settled ADR covers booking-site listings only and excludes group, corporate-contract, negotiated and direct bookings.
■ Government statistics and primary sources
- Ministry of Internal Affairs and Communications, press release: “2025-base Consumer Price Index, Japan, July 2026” (21 August 2026)
- Statistics Bureau of Japan, “Consumer Price Index (CPI), Japan — summary of the latest monthly results”
- Statistics Bureau of Japan, “Retroactive Results of the 2025 Base Revision of the Consumer Price Index” (7 August 2026, PDF)
- Statistics Bureau of Japan, “About the 2025 base revision” (retroactive results and linked indices)
- Statistics Bureau of Japan, “Explanation of the 2025-base Consumer Price Index” (July 2026) — Part II Overview of the base revision / Part III-1 Calculation of comparison-period prices / Appendix 3 Method for calculating item-level price indices / Part IV-1 Item information list (weights)
- Statistics Bureau of Japan, “Explanation of the 2020-base Consumer Price Index” (July 2021) — used to confirm old-base weights and item counts
- Statistics Bureau of Japan, “Plan for the 2025 Base Revision of the Consumer Price Index” (14 November 2025, PDF)
- e-Stat, “Consumer Price Index (2025 base)” table ID 0004052037 / “Consumer Price Index (2020 base)” table ID 0003427113 — national monthly series for the item “lodging” (index levels and YoY) retrieved
- Ministry of Internal Affairs and Communications, “Publication of the Plan for the 2025 Base Revision of the Consumer Price Index”
■ Internal data
- MetroEngines Research — estimated settled ADR by area (12 major prefectures, January 2023 – July 2026, settled months only, N = 7,131-8,109 properties per month)
- MetroEngines Research — listed-price trajectories by stay date for Tokyo (four dates: 13 June, 24 June, 8 July and 18 July 2026; 1,169-1,285 properties observed)