

Exhibitions are one of the few sources of corporate demand that lands on a weekday, which makes them unusually valuable to hotels. Yet trade coverage almost always treats them one show at a time. Very little published work takes the exhibition venue itself as the unit of comparison and asks, side by side, how many guest rooms actually sit at each venue’s feet and how much demand really moves when a show opens.
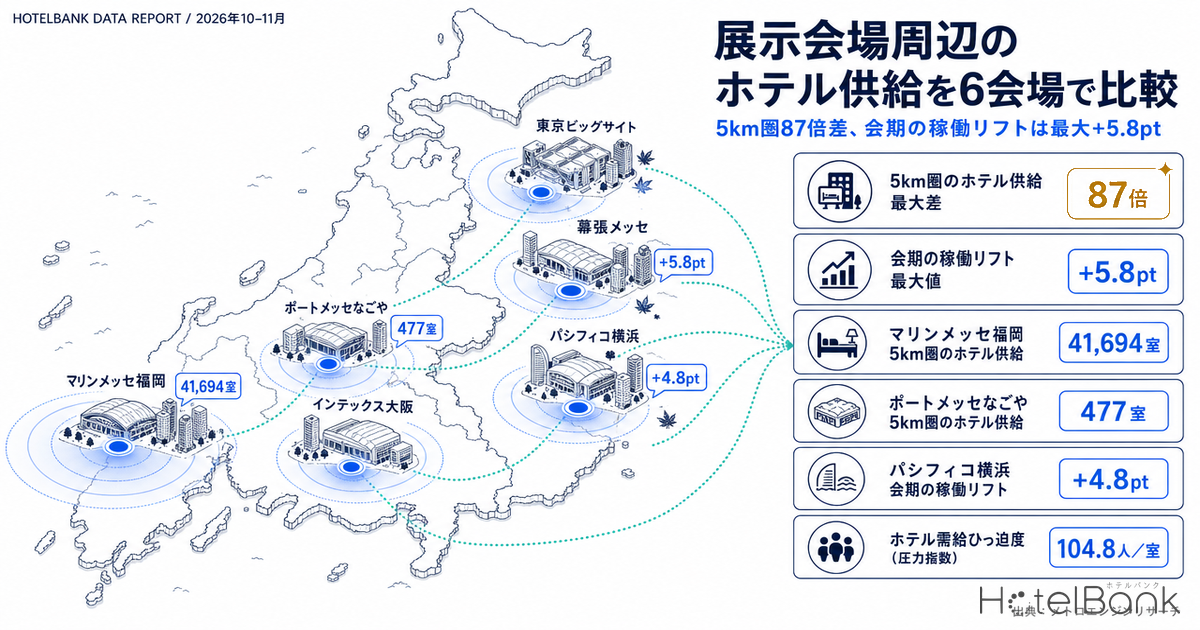
This article covers six of Japan’s major exhibition venues — Tokyo Big Sight, Makuhari Messe, Pacifico Yokohama, Port Messe Nagoya, Intex Osaka and Marine Messe Fukuoka. For each, we aggregated room supply within a 3 km and 5 km radius, then took the October–November 2026 shows whose dates we could confirm on the organiser’s own website and compared occupancy and listed prices on show-related nights against non-show weekdays (Tuesday–Thursday). The headline finding: room counts within 5 km range from 477 to 41,694 — an 87-fold spread — and a clear occupancy lift on show nights was observed at only two of the six venues.
Metric Definitions Used in This Article
- Occupancy (OCC): the share of rooms sold against total rooms in the area (an estimate based on inventory listed for sale on OTAs). Because it is derived from how listed OTA inventory is absorbed, it differs from a property’s true operating occupancy. The aggregation unit is the municipality (ward/city) in which the venue is located.
- Listed price: the average selling price each property publishes on OTAs and similar channels (per room, double occupancy, tax included, averaged across all plans). For properties inside the radius from each venue, we take each property’s daily average and then the median across properties.
- ADR (average daily rate): an estimated settled rate (tax-excluded equivalent) calculated by applying a category-specific adjustment factor to the lowest plan level each property publishes on OTAs. Cross-checked against per-property results disclosed by listed hotel REITs, the median error is 6.6% (verified categories: business, city, resort, ryokan and capsule). It is an estimate and differs from each property’s actual transacted rates and accounting figures. In this article it is used only as a monthly-granularity reference, never for day-level comparisons.
- LT (lead time): days remaining until check-in. LT0 = same day. This article uses observations taken at LT75 (75 days out) and LT90 (90 days out).
- Data source: MetroEngines Research
- — 87.4x — rooms within 5 km of the six venues range from 477 (Port Messe Nagoya) to 41,694 (Marine Messe Fukuoka). Within 3 km the gap widens to 144.8x.
- — All nine shows open on a Wednesday. A Wednesday open and a Friday close is the de facto standard for B2B exhibitions in Japan, so the first night of lodging demand falls on Tuesday — the night when leisure demand is at its thinnest.
- — +5.8pt — a clear occupancy lift on show nights appeared at only two venues, Makuhari Messe and Pacifico Yokohama. Listed prices moved with it, +15.9% and +11.2% respectively.
- — The other four venues sat at −2.0 to −3.5pt. The reasons differ by venue and fall into three distinct patterns: shows as the normal state, a room base too large to move, and demand flowing to the city centre.
- — 104.8 visitors per room — Messe Nagoya 2026’s expected attendance stands far above the room stock at its feet. Whether a lift appears is decided less by the size of the show than by its size relative to the rooms available to absorb it.
Room supply at the venues’ feet — an 87-fold gap within 5 km
We first fixed the latitude and longitude of each of the six venues and extracted lodging properties within a 3 km and 5 km radius. The population is limited to properties tracked by MetroEngines Research whose prices have been listed on OTAs or similar channels within the past 120 days — in other words, properties that can be confirmed as trading. This screen removes properties that have closed but still linger in the database.
Within 5 km of the six venues there were 897 trading properties holding 100,715 rooms in total. The distribution, however, is extremely uneven.
| Venue | Properties within 3 km | Rooms within 3 km | Properties within 5 km | Rooms within 5 km | Median listed price within 5 km |
|---|---|---|---|---|---|
| Tokyo Big Sight | 17 | 6,817 | 159 | 26,552 | ¥24,800 |
| Makuhari Messe | 14 | 4,532 | 22 | 4,933 | ¥20,000 |
| Pacifico Yokohama | 128 | 19,634 | 132 | 19,882 | ¥18,800 |
| Port Messe Nagoya | 1 | 252 | 2 | 477 | ¥50,500 |
| Intex Osaka | 23 | 3,203 | 43 | 7,177 | ¥25,400 |
| Marine Messe Fukuoka | 438 | 36,502 | 539 | 41,694 | ¥23,500 |
Source: MetroEngines Research; compiled by the HotelBank Editorial Team (N=897 properties, limited to properties with confirmed OTA listings in the past 120 days. Listed price is the median of per-property averages for check-ins 1 June – 15 August 2026, double occupancy, tax included. Port Messe Nagoya’s 5 km figure is a reference value, N=2 properties.)
The largest is Marine Messe Fukuoka with 41,694 rooms, because the venue sits almost in the middle of Hakata Station, Nakasu and Tenjin — Kyushu’s largest concentration of lodging. The smallest is Port Messe Nagoya with 477. The gap between the two is 87.4x. Narrow the radius to 3 km and it widens further: 36,502 rooms for Marine Messe Fukuoka against 252 for Port Messe Nagoya, a factor of 144.8. Proximity to a venue is itself a component of how a lodging property is valued, and the weight of that component varies sharply by area.
Within 3 km of Port Messe Nagoya, only one trading property was found: Legoland Japan Hotel (252 rooms). It is a family resort attached to a theme park, and its price level (roughly ¥80,000 on a property-average basis) is optimised for leisure demand. In other words, the Kinjo Futo waterfront has almost no room stock structurally suited to absorbing weekday business visitors.
Source: MetroEngines Research; compiled by the HotelBank Editorial Team
Supply differs by venue not only in quantity but in character. Assigning each property a price tier from its average listed price and looking at the room mix within 5 km, 71.9% of the stock around Makuhari Messe sits in the economy tier (property average ¥15,000–24,999), while 71.0% around Intex Osaka is mid-tier (¥25,000–49,999). Around Tokyo Big Sight, upper-mid and above accounts for 24.3% — the broadest price range of the six.
Source: MetroEngines Research; compiled by the HotelBank Editorial Team (price tiers assigned from each property’s average listed price, check-ins 1 June – 15 August 2026)
Plotting the six venues together with the properties of 100 rooms or more within 5 km (359 properties) makes the difference in how supply clusters around each venue immediately visible. Circle size corresponds to room count.
Source: MetroEngines Research; compiled by the HotelBank Editorial Team
The October–November 2026 show calendar — all nine confirmed shows open on a Wednesday
Next, we checked the October and November 2026 dates one show at a time on each exhibition’s official website. Only shows whose dates could be confirmed on the organiser’s own page — not merely on the venue’s event calendar — are included; shows whose dates could not be confirmed are excluded from this article.
| Venue | Exhibition | Dates | Scale / hall information |
|---|---|---|---|
| Tokyo Big Sight | H.C.R. 2026 — 53rd International Home Care & Rehabilitation Exhibition & Forum | Wed 7 – Fri 9 October 2026 | East Halls 1, 2, 3, 7 and 8 |
| Tokyo Big Sight | TOKYO PACK 2026 — Tokyo International Packaging Exhibition | Wed 14 – Fri 16 October 2026 | East Halls |
| Makuhari Messe | 9th Medical Japan Tokyo [Medical, Nursing Care & Pharmacy Week Tokyo] | Wed 7 – Fri 9 October 2026 | International Exhibition Hall 1–3 |
| Makuhari Messe | NexTech Week 2026 [Autumn] | Wed 11 – Fri 13 November 2026 | International Exhibition Hall 1–3 / 10,000 visitors expected |
| Pacifico Yokohama | BioJapan 2026 (co-located with Regenerative Medicine JAPAN / healthTECH JAPAN) | Wed 7 – Fri 9 October 2026 | 40th edition; the previous show drew 22,167 visitors over three days |
| Port Messe Nagoya | Messe Nagoya 2026 | Wed 11 – Fri 13 November 2026 | Exhibition Hall 1 / 800 exhibitors, 950 booths, 50,000 visitors expected |
| Intex Osaka | 29th Manufacturing World [Osaka] | Wed 7 – Fri 9 October 2026 | Halls 1–6 / 1,100 exhibitors, 31,000 visitors expected |
| Intex Osaka | Japan IT Week / Japan DX & AX Week [Kansai] | Wed 18 – Fri 20 November 2026 | Halls 4 and 5 |
| Marine Messe Fukuoka | 8th Kyushu-Okinawa Hotel, Restaurant & Foodservice Show / 2nd Asia Food Export Show | Wed 28 – Thu 29 October 2026 | Hall B / approx. 350 exhibitors, 6,000 visitors expected |
Source: each exhibition’s official website (checked 18 August 2026); compiled by the HotelBank Editorial Team
What stands out here is that all nine confirmed shows open on a Wednesday. A three-day run opening Wednesday and closing Friday has become near-standard for B2B exhibitions in Japan, which means lodging demand first rises on the night before day one — Tuesday night. From a hotel’s point of view, this Wednesday-open convention creates one of the few demand sources capable of filling Tuesday and Wednesday inventory, the nights when leisure demand is thinnest. Academic conferences generate weekday demand on a similar pattern; their calendar and booking pace are analysed city by city in 493 Medical Conferences in Japan: 75.7% of Nights Fall Wed–Fri.
For that reason, the unit of analysis in this article is not the show itself but the nights of lodging that accompany it — from the night before opening day through the night before the final day. For a show running Wednesday 7 to Friday 9 October, lodging demand arises across three nights: Tuesday 6, Wednesday 7 and Thursday 8 October.
Measuring the show lift — only Makuhari Messe and Pacifico Yokohama show one clearly
We compared show-related lodging nights against non-show weekdays (Tue–Thu) around the same venue, observed at an identical lead time. Comparison days were drawn from within 17 days either side, excluding days on which a venue event could be confirmed nearby, the nights preceding them, and public holidays. October shows use LT75 (75 days out); November shows use LT90 (90 days out) because of the observation window available.
| Venue (occupancy aggregation ward) | Show dates | Observed LT | OCC, show nights | Non-show weekday | Diff. | Listed price, show nights | Non-show weekday | Diff. |
|---|---|---|---|---|---|---|---|---|
| Makuhari Messe Mihama-ku, Chiba — 12 properties, 4,139 rooms | 10/07-09 | 75 | 26.2% | 20.4% | +5.8pt | ¥25,300 | ¥21,800 | +15.9% |
| Makuhari Messe Mihama-ku, Chiba — 12 properties, 4,139 rooms | 11/11-13 | 90 | 20.6% | 15.8% | +4.8pt | ¥23,400 | ¥21,100 | +10.5% |
| Pacifico Yokohama Nishi-ku, Yokohama — 17 properties, 4,222 rooms | 10/07-09 | 75 | 77.5% | 72.7% | +4.8pt | ¥22,100 | ¥19,900 | +11.2% |
| Port Messe Nagoya Minato-ku, Nagoya — 3 properties, 347 rooms | 11/11-13 | 90 | 45.0% | 47.0% | -2.0pt | ¥40,700 | ¥40,800 | -0.2% |
| Marine Messe Fukuoka Hakata-ku, Fukuoka — 217 properties, 22,962 rooms | 10/28-29 | 75 | 68.7% | 71.6% | -2.9pt | ¥24,900 | ¥26,200 | -5.1% |
| Intex Osaka Suminoe-ku, Osaka — 8 properties, 1,966 rooms | 10/07-09 | 75 | 53.8% | 56.8% | -3.0pt | ¥24,700 | ¥25,800 | -4.4% |
| Tokyo Big Sight Koto-ku, Tokyo — 44 properties, 10,319 rooms | 10/14-16 | 75 | 78.6% | 82.1% | -3.5pt | ¥33,900 | ¥34,700 | -2.3% |
Source: MetroEngines Research; compiled by the HotelBank Editorial Team (occupancy is aggregated at the municipality/ward containing the venue. Listed price is the per-property median within 5 km of the venue, or within 3 km for Pacifico Yokohama and Marine Messe Fukuoka. Show nights N=2–3 nights; non-show weekdays N=3–6 days.)
The result is clear. A positive occupancy lift appeared at only two venues: Makuhari Messe (9th Medical Japan Tokyo, +5.8pt) and Pacifico Yokohama (BioJapan 2026, +4.8pt). The same two venues also stand out on listed price, at +15.9% and +11.2%, with occupancy and price moving in the same direction. At Makuhari Messe the pattern repeated in November for NexTech Week 2026 [Autumn], at +4.8pt and +10.5%.
At the remaining four venues, the gap between show nights and non-show weekdays fell within a range of −2.0pt to −3.5pt, and no show-driven boost to inventory absorption could be detected. That does not mean exhibitions generate no lodging demand. As the next section shows, the reason differs entirely from venue to venue.
Source: MetroEngines Research; compiled by the HotelBank Editorial Team
Tracking how the lift emerges along the lead-time axis sharpens the contrast further. Lining up occupancy for show nights and non-show weekdays from LT90 (90 days out) to LT65 (65 days out), the gap at Makuhari Messe widens from 4.6pt at 90 days to 8.3pt at 65 days. Pacifico Yokohama also opens up, from 4.3pt to 6.4pt. Around Tokyo Big Sight (Koto-ku), by contrast, the two lines run almost parallel: 0.5pt at 90 days and 0.5pt at 65 days.
Source: MetroEngines Research; compiled by the HotelBank Editorial Team (solid lines = show-related lodging nights, dashed lines = non-show Tue–Thu. Both cover the 7–9 October 2026 show dates.)
Why four venues show no lift — three different reasons
First, Tokyo Big Sight has almost no “non-show weekdays” left. Listing the event days around the venue, only four of the thirteen Tuesdays, Wednesdays and Thursdays in October 2026 (1, 27, 28 and 29 October) did not qualify as a lodging night attached to a venue event. Where shows have become the normal state, the “ordinary” baseline against which to compare barely exists. Occupancy around Koto-ku running as high as 82.1% even on non-show weekdays reflects exactly this: the comparison days are themselves filled by other demand.
Second, at Marine Messe Fukuoka the show’s demand is buried in the room base. The 8th Kyushu-Okinawa Hotel, Restaurant & Foodservice Show expects 6,000 visitors. Against that, there are 41,694 rooms within 5 km of the venue, so even if every visitor took a room to themselves it would amount to roughly 14% of inventory. Hakata-ku, Fukuoka is a base of 217 properties and 22,962 rooms; a two-day, 6,000-visitor trade event does not surface as a statistical difference.
Third, at Port Messe Nagoya and Intex Osaka the demand does not stay at the venue’s feet. Looking only at the ward containing the venue misses it. So we applied the same method to the city-centre catchment areas, comparing show nights against non-show weekdays there as well.
| Venue / show | Venue’s own ward | Occupancy diff. | City-centre catchment area | Occupancy diff. |
|---|---|---|---|---|
| Pacifico Yokohama / BioJapan 2026 (7–9 Oct) | Nishi-ku, Yokohama (17 properties, 4,222 rooms) | +4.8pt | Naka-ku, Yokohama (62 properties, 11,948 rooms) | +6.9pt |
| Port Messe Nagoya/Messe Nagoya 2026(11/11-13) | Minato-ku, Nagoya (3 properties, 347 rooms) | -2.0pt | Nakamura-ku, Nagoya (66 properties, 11,465 rooms) | +2.8pt |
| Intex Osaka / Manufacturing World [Osaka] (7–9 Oct) | Suminoe-ku, Osaka (8 properties, 1,966 rooms) | -3.0pt | Chuo-ku, Osaka (211 properties, 34,049 rooms) | -2.7pt |
Source: MetroEngines Research; compiled by the HotelBank Editorial Team (Pacifico Yokohama and Intex Osaka at LT75, Port Messe Nagoya at LT90)
At Port Messe Nagoya, the venue’s own Minato-ku came in at −2.0pt, while Nakamura-ku — which contains the area in front of Nagoya Station — turned positive at +2.8pt. The demand from the venue’s largest show of the year, with 50,000 visitors expected, is picked up not at its feet but by central Nagoya, and the numbers show it. The same holds at Pacifico Yokohama, where the lift in Naka-ku (+6.9pt), covering Kannai and Isezakicho, exceeds that in the venue’s own Nishi-ku (+4.8pt) — suggesting that once the Minato Mirai rooms fill, demand is pushed out into adjacent areas. Demand peaking away from a venue rather than at its feet is not unique to exhibitions; the same structure is confirmed from booking curves in SHINE UP FES 2026: Tottori’s Demand Peak Sat 100km From the Venue.
Intex Osaka, on the other hand, came in at −2.7pt even in Chuo-ku, Osaka, so no show effect could be detected on the city-centre side either. With 211 properties and 34,049 rooms, Chuo-ku is a large base, and against 31,000 expected visitors (only a portion of whom travel far enough to need a room) the difference most likely washed out, as it did in Fukuoka.
Reducing “how thin the absorbing supply is” to a single indicator makes the picture simpler still. For the four shows that publish an expected attendance figure, we divided expected visitors by the number of rooms within 5 km. This is not a forecast of lodging demand but an indicator of how much pressure a show places on the surrounding room stock (most visitors are day-trippers, so actual overnight numbers are far lower).
Expected attendance from each exhibition’s official website; room counts from MetroEngines Research; compiled by the HotelBank Editorial Team
Messe Nagoya 2026 stands far out at 104.8 expected visitors per room within 5 km. Manufacturing World [Osaka] comes in at 4.3, NexTech Week 2026 [Autumn] at 2.0, and the Kyushu-Okinawa Hotel, Restaurant & Foodservice Show at 0.14. Whether a show lift is observable is decided less by the size of the show than by its size relative to how many rooms sit at the venue’s feet.
What this means for hotels — rate design built around the show calendar
For hotels operating around exhibition venues, the findings above carry four practical implications.
1. Establish first whether your property is on the “lift” side or the “buried” side. Where room stock is limited relative to the venue and weekday demand is thin without a show — as around Makuhari Messe (4,933 rooms within 5 km) or Minato Mirai (Nishi-ku, Yokohama, 4,222 rooms) — a show emerges as a clear revenue opportunity. Around Makuhari Messe in particular, non-show weekday occupancy sits at 20.4% (estimated, at LT75), so three show nights can shape the month’s revenue. Conversely, in areas with a base of tens of thousands of rooms such as Hakata or Osaka’s Minami district, judging by the overlap of multiple shows and the mix with other demand fits reality better than a large rate adjustment timed to a single show.
2. There is room to bring rate-setting forward, to earlier than 90 days out. At the two venues where a lift was observed, occupancy was already 4pt apart at LT90 and the gap widened toward 65 days out. Because show dates are published more than a year in advance, areas where no price differential has appeared by the 90-day mark have room to bring show-calendar-driven rate design forward. Listed prices tell the same story: where a lift occurs, a differential of +10–16% is already priced into show nights.
3. Design Tuesday-night inventory around the Wednesday open. All nine shows examined here open on a Wednesday. The first night of lodging demand is Tuesday, which is also the thinnest night of the year for leisure demand. How Tuesday-night inventory is handled feeds directly into annual RevPAR for hotels in an exhibition catchment. Beyond room-only pricing, service design matched to the visitor’s morning routine — an earlier breakfast service, luggage holding — can be an opportunity on both occupancy and rate.
4. City-centre catchment areas, not just the venue’s immediate surroundings, belong in rate design. As Port Messe Nagoya and Pacifico Yokohama show, show demand spills into adjacent areas and the city centre when it cannot be absorbed locally. Hotels a few kilometres from a venue but well connected by transport — around Nagoya Station or in Kannai — are affected by the show calendar even if they do not count the venue as part of their own catchment. Folding nearby venues’ annual calendars into your own rate calendar is worthwhile in these areas too.
⚠ A note on forward-dated data: October and November 2026, the period covered here, fall after the date of this research (18 August 2026). Occupancy and listed prices are therefore estimates based on the inventory and selling prices published on OTAs and similar channels as of that date. As check-in approaches, plans are added, prices revised and further inventory released, so these figures will change. Show dates are also subject to change by their organisers.
Methodology and sources
The venue coordinates used were Tokyo Big Sight (35.62982, 139.79424), Makuhari Messe (35.64678, 140.03449), Pacifico Yokohama (35.45917, 139.63612), Port Messe Nagoya (35.04871, 136.84339), Intex Osaka (34.63730, 135.41800) and Marine Messe Fukuoka (33.60677, 130.40231). Surrounding properties were extracted by straight-line distance from each coordinate.
On the supply side, the population comprises the 897 properties tracked by MetroEngines Research whose prices were confirmed as listed on OTAs or similar channels within the past 120 days; properties with no confirmed listing (including those temporarily or permanently closed) are excluded. Price tiers are assigned from each property’s average listed price for check-ins between 1 June and 15 August 2026 (double occupancy, tax included).
Occupancy is aggregated at the level of the municipality or ward containing the venue. This is because the daily, lead-time-level aggregate data uses the municipality as its smallest unit, so the coverage does not coincide with the radius. Only listed price is aggregated by radius (3 km for Marine Messe Fukuoka and Pacifico Yokohama, 5 km for the others). Readers should note that the two coverages differ.
Estimated settled ADR is provided at monthly granularity and is therefore not used for the day-level show comparison. In addition, each month from August 2026 onward is an estimate based on selling prices listed as of the research date rather than confirmed results, so the calculation basis differs from past months settled on an actuals basis. For this reason, no year-on-year comparison is presented here. As a reference, estimated settled ADR for October 2026 is ¥18,600 for Tokyo (N=1,066 properties), ¥12,100 for Chiba (N=381), ¥15,700 for Kanagawa (N=528), ¥13,200 for Aichi (N=460), ¥11,500 for Osaka (N=620) and ¥14,500 for Fukuoka (N=452).
Show dates were confirmed against the content published on each exhibition organiser’s official website as of 18 August 2026. Exhibitions listed only on a venue’s event calendar, without confirmation on the organiser’s official site, are not included in this analysis.
Related reading
References and sources
■ Exhibition dates (organiser and venue official websites, checked 18 August 2026)
- International Home Care & Rehabilitation Exhibition (H.C.R.), “Show outline”
- TOKYO PACK 2026 official website (Japan Packaging Institute)
- Medical Japan Tokyo, “Show outline”
- NexTech Week 2026 Autumn, “Show outline”
- BioJapan 2026 official website
- Messe Nagoya 2026, “Show outline”
- Manufacturing World [Osaka] 2026, “Show outline”
- Japan IT Week / Japan DX & AX Week [Kansai] official website
- 8th Kyushu-Okinawa Hotel, Restaurant & Foodservice Show / 2nd Asia Food Export Show official website (Japan Management Association)
- Tokyo Big Sight, “Event information”
- Intex Osaka, “Event information”
- Port Messe Nagoya, “Event information”
- Pacifico Yokohama, “Event information”
- Fukuoka Convention Center (Marine Messe Fukuoka), “Event information”
■ Data sources
Starting from the coordinates of the six venues, lodging properties within a 3 km and 5 km radius were extracted, and the 897 properties holding 100,715 rooms whose prices were confirmed as listed on OTAs or similar channels within the past 120 days form the supply-side population. Occupancy is the daily, lead-time-level absorption of inventory (an estimate based on listed OTA inventory) aggregated at the municipality or ward containing the venue; listed price is the median of per-property daily averages within the radius (double occupancy, tax included, averaged across all plans). Show dates were confirmed against the content published on each exhibition organiser’s official website as of 18 August 2026.
■ Calculation assumptions
The unit of analysis is not the show itself but the “lodging nights that accompany it” (from the night before opening day through the night before the final day). Comparison non-show weekdays were selected from Tuesdays to Thursdays around the same venue within 17 days either side, excluding days on which a venue event could be confirmed nearby, the nights preceding them, and public holidays. Observations are taken at LT75 for October shows and, because of the observation window available, at LT90 for November shows. Expected visitors per room is the officially published expected attendance divided by the number of rooms within 5 km; it is not a forecast of lodging demand but a relative indicator of the pressure a show places on room stock.
■ Limitations and caveats
The period covered, October–November 2026, falls after the research date (18 August 2026), so occupancy and listed prices are estimates based on the inventory and selling prices published as of that date. The figures will move as check-in approaches, and show dates may be changed by their organisers. The aggregation unit for occupancy (municipality/ward) does not coincide with that for listed price (radius). Port Messe Nagoya’s 5 km radius (N=2 properties) and Minato-ku, Nagoya (N=3 properties) have small populations and should be treated as reference values. Estimated settled ADR is monthly in granularity and is therefore not used for the day-level show comparison. Exhibitions whose dates could not be confirmed are not included in the analysis, so complete coverage of show days is not guaranteed.
■ Market data
- MetroEngines Research — surrounding properties and room counts (N=897 properties), listed prices, occupancy (estimated from listed OTA inventory), estimated settled ADR