

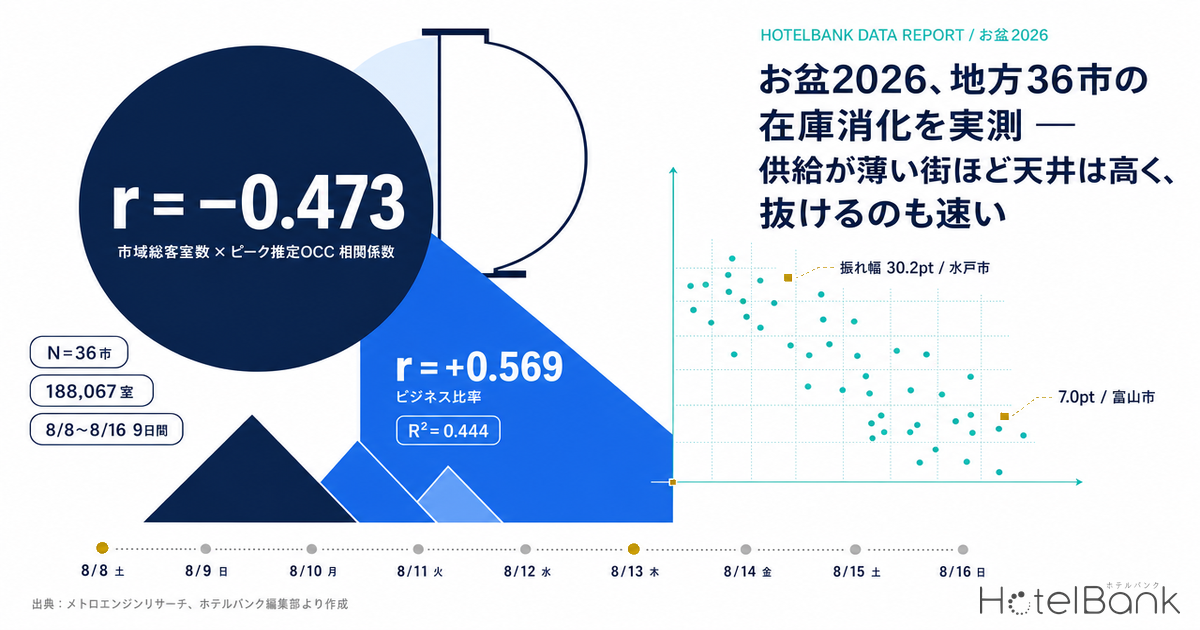
Obon 2026 (August 8–16) is over. One question revenue managers in Japan’s regional core cities face every year is this: how does the depth of your city’s room stock actually shape the way peak season fills? The received wisdom on the ground is that cities with fewer rooms hit the ceiling sooner, while larger markets are still holding inventory to the last day. This article tests that hypothesis across 36 regional core cities and roughly 188,000 rooms of actual Obon performance. The short answer up front: the hypothesis is only half right.
Metric Definitions Used in This Article
- OCC (occupancy): the share of rooms sold against total rooms in the area (an estimate based on OTA-listed inventory). Calculated as (total rooms − remaining rooms) ÷ total rooms. This is an estimate based on how listed OTA inventory is absorbed, and is defined differently from a property’s true house-level occupancy. Direct bookings, group business and travel-agent allotments are not reflected, so the figure runs higher than actual in-house occupancy. In this article it is used only as a macro aggregate at the city level; no individual property OCC is calculated.
- Peak occupancy (the ceiling): the highest estimated OCC recorded in that city on any single day within the nine days from August 8 to 16.
- Days at ceiling: the number of those nine days on which estimated OCC was 95% or above.
- Swing: the gap (in points) between the highest and lowest estimated OCC across those nine days. It expresses how evenly daily inventory absorption is spread.
- Total city room stock: the combined room count of properties confirmed as listed on OTAs within that city. Ryokan, guesthouses and simple lodgings not listed on OTAs are excluded.
- Data source: MetroEngines Research
- — r = −0.473: total city room stock (log scale) and Obon peak occupancy show a moderate negative correlation. The hypothesis that thinner room stock produces a higher ceiling is supported (N=36 cities).
- — r = −0.178: by contrast, there is almost no correlation with “days at ceiling” — the count of days in the Obon nine (August 8–16, 2026) with estimated OCC at 95% or above. The generalisation that smaller cities stay sold out longer does not hold.
- — Swing r = −0.444: what size actually explained was the daily swing. The small-stock group falls from 97.9% on August 8 to 78.0% on August 16.
- — Business-hotel share r = +0.569: the swing was explained more strongly by the share of business hotels within the city’s room stock. Combined with size, the two variables give R² = 0.444.
- — Period average by property type: ryokan 94.6% > city hotels 92.5% > resorts 92.0% > business hotels 90.9%. That said, business hotels account for roughly 70% of all inventory across the 36 cities.
The sample: 36 regional core cities, roughly 188,000 rooms, nine days of Obon
The scope is 36 regional core cities excluding the government-designated major cities. Designated cities were left out because their municipal areas are split into administrative wards, which makes it hard to treat the city’s room stock as a single number. As of August 13, the 36 cities comprised 2,504–2,535 properties and 188,067 rooms. The period runs nine days from Saturday August 8 to Sunday August 16, 2026 — all past dates with confirmed actuals.
The 2026 Obon calendar had a distinctive shape. The weekend of Saturday August 8 and Sunday August 9 was followed by Mountain Day on Tuesday August 11. Taking Monday August 10 off created a four-day break; adding August 12–14 extended it to nine consecutive days from August 8 to 16. In other words, these nine days contain two separate peaks — an early long-weekend block and the Obon period proper.
To eliminate drift in the observed population (daily fluctuation in the number of listed properties), days with observation coverage below 90%, and days where the listed property count deviated by 10% or more from the period median, were excluded from the aggregation. Only three cells out of 324 (36 cities × 9 days) were dropped — Morioka on August 8 (coverage 87.8%), Matsue on August 13 (86.2%) and Mito on August 13 (87.5%). The median coverage across the remaining 321 cells was 97.5%.
Half the hypothesis holds — thinner room stock does mean a higher ceiling
Start with the relationship between total city room stock (log axis) and estimated OCC on the Obon peak day. The correlation coefficient is r = −0.473 (rank correlation ρ = −0.344, N=36). There is a moderate negative correlation, so the hypothesis that thinner room stock produces higher peak estimated OCC is supported — as far as the height of the ceiling goes.
Source: MetroEngines Research; compiled by the HotelBank Editorial Team
Smoothing by size quartile makes the structure clearer still. Q1 (2,079–2,842 rooms) averaged 98.5% at peak, Q2 (2,861–4,142 rooms) 98.1% and Q3 (4,371–5,771 rooms) 98.2% — essentially flat, all pinned in the 98% range. Only Q4, at 6,292 rooms and above, drops to 94.5%. So rather than a straight-line “thinner means higher” relationship, this looks closer to a step: only markets past a certain depth stop short of the ceiling.
What matters here is that this estimated OCC is based on OTA-listed inventory. In small and mid-sized markets the OTA allocation per property is relatively small, and once that allocation sells through, the figure approaches 100%. Actual in-house occupancy has not necessarily reached the same level. Even so, the fact that “the rooms you can buy on an OTA have disappeared” accurately reflects what demand-side users experience, and it loses none of its value as an input to pricing decisions.
The other half fails — time spent at the ceiling is not explained by size
Next, look at the number of days with estimated OCC at 95% or above (days at ceiling). Its correlation with total city room stock is r = −0.178 — essentially none. For days at 98% or above it falls to r = −0.048, losing explanatory power entirely.
Concrete examples make this easier to see. Matsumoto (5,411 rooms) was at 95% or above on eight of the nine days, averaging 98.3% for the period. Oita (4,658 rooms), a comparable size, cleared 95% on just one day and averaged 88.5%. Maebashi (2,079 rooms), smaller still, also managed only one day. Conversely, Otsu with 2,456 rooms hit 95% or above on seven days and recorded a period average of 96.0%. Room-stock depth alone cannot predict how many days a city will stay pinned at the ceiling — that is the first conclusion of this analysis. The part of the hypothesis that failed is presented here as it stands.
So what is size explaining? The answer is the swing.
What size really drives is the daily swing — r = −0.444
The gap between the highest and lowest estimated OCC across the nine days — the swing — correlates with total city room stock at r = −0.444. The deeper a city’s room stock, the gentler its daily absorption; the thinner it is, the more violently the numbers move day to day. Overlaying the daily trend by size band makes the difference visible.
Source: MetroEngines Research; compiled by the HotelBank Editorial Team
The small group (12 cities, 2,079–3,383 rooms) posts the highest ceiling at 97.9% on August 8, but falls to 78.0% by August 16. The mid group (12 cities, 3,521–5,205 rooms) runs 96.4% → 80.2%. The large group (12 cities, 5,300–21,528 rooms) runs 93.5% → 81.9%, with the lowest ceiling but the shallowest floor. On August 8 the small group is 4.4pt above the large group; by August 16 it is 3.9pt below it. Thin cities have a high ceiling, but they also empty out fast. Deep cities never reach the ceiling, but their inventory does not suddenly pile up when demand recedes.
This can be explained as a diversification effect. A market with deep room stock holds a variety of properties side by side, each with a slightly different demand peak. The bumps in individual properties even out across the market as a whole, and the daily curve flattens. In markets with a limited number of properties, by contrast, a group booking at a handful of hotels or the presence of a local event is enough to move the citywide figure.
Incidentally, the trough clustered on Sunday August 16 in 34 of the 36 cities (the remaining two were August 15 and August 10). On the final Sunday of Obon, inventory returns nationwide. Peak days, meanwhile, were most often Saturday August 8, with 14 cities, followed by Monday August 10 with nine and Thursday August 13 with four. That is consistent with the prefecture-level peak distribution we mapped at the T-1 observation point for Obon 2026, where the peaks fell on August 8 and August 13 rather than August 15 — and it confirms that even when you drill down to the city level, the peak leans toward the early long-weekend block.
Property mix explains the swing best — business-hotel share gives r = +0.569
There is a variable that explains the swing more strongly than size does: the share of business-hotel rooms within the city’s room stock. The correlation is r = +0.569, above that of size (r = −0.444). The higher the business-hotel share, the more sharply daily absorption moves during Obon.
Source: MetroEngines Research; compiled by the HotelBank Editorial Team
The two variables correlate with each other at only r = −0.181, so size and property mix operate largely independently. Checking with partial correlations: holding property mix constant, the effect of size is −0.422; holding size constant, the effect of business-hotel share is +0.554. A two-variable multiple regression yields a coefficient of determination of R² = 0.444, meaning these two account for a little over 40% of the variance in the swing.
The intuitive reason is straightforward. A market centred on business hotels normally has a stable floor of weekday corporate demand. During Obon that corporate demand disappears and the market stands on leisure demand alone. On the core days of the holiday, demand concentrates and reaches the ceiling; on the days off that peak, there is nothing to hold it up. The largest swings are Mito at 30.2pt (business share 82.4%), Gifu at 29.1pt (73.0%) and Yamaguchi at 25.8pt (77.4%) — all markets with a high business-hotel share.
At the other end, the smallest swings are Toyama at 7.0pt, Otsu at 8.4pt, Matsumoto at 8.5pt, Naha at 8.8pt and Matsuyama at 9.9pt. Otsu’s business share is 34.7% and Matsuyama’s 42.4% — mixes spread across ryokan, resort and city hotels. Matsumoto carries a combined 27.8% in ryokan and resorts. The pattern that emerges is that markets holding several property types with different demand characteristics absorb inventory more smoothly through peak season.
The ceiling by property type — ryokan highest, business hotels lowest
Breaking the 36 cities down by property type and taking the room-weighted period-average estimated OCC gives the following.
Source: MetroEngines Research; compiled by the HotelBank Editorial Team
Ryokan are highest at 94.6% (13,864 rooms), followed by city hotels at 92.5% (30,022 rooms) and resorts at 92.0% (9,418 rooms), with business hotels lowest at 90.9% (125,626 rooms). As the room counts make clear, however, business hotels hold 70% of the inventory across the 36 cities. Citywide figures are therefore pulled along almost entirely by the movement of business hotels, so before using a market-average curve as an input for your own property, you need to establish how far your property type diverges from that market average.
Looked at individually, the gaps by property type are wider still. Matsuyama runs ryokan at 98.0% and city hotels at 97.3% against business hotels at 91.0% — a spread of around 7pt. Nara has business hotels at 86.2% against ryokan at 93.0% and resorts at 94.8%. Reading the citywide average of 88.8% on its own and concluding “we failed to capture the demand” would mean overlooking the property mix.
The full 36-city ranking
The table below lists the cities in descending order of room stock. Setting days at ceiling alongside the swing reveals a dispersion that size alone cannot explain.
| City | Rooms | Properties | Peak OCC | Peak day | Period avg. | Days at ceiling | Swing | Aug 16 | Business share |
|---|---|---|---|---|---|---|---|---|---|
| Naha | 21,528 | 232 | 91.6 | Aug 15 | 87.9 | 0 | 8.8 | 88.6 | 58.2 |
| Kanazawa | 13,303 | 201 | 98.4 | Aug 10 | 93.3 | 6 | 20.7 | 77.7 | 78.2 |
| Hakodate | 9,481 | 126 | 97.7 | Aug 13 | 93.4 | 6 | 16.0 | 81.7 | 55.2 |
| Kagoshima | 9,331 | 95 | 84.4 | Aug 8 | 77.4 | 0 | 14.9 | 69.5 | 79.7 |
| Matsuyama | 7,459 | 115 | 97.5 | Aug 11 | 94.8 | 6 | 9.9 | 87.6 | 42.4 |
| Miyazaki | 7,291 | 78 | 91.2 | Aug 8 | 86.6 | 0 | 18.5 | 72.7 | 57.3 |
| Nagasaki | 7,062 | 89 | 92.4 | Aug 9 | 88.9 | 0 | 16.1 | 76.3 | 57.0 |
| Takamatsu | 6,483 | 111 | 98.5 | Aug 13 | 91.8 | 3 | 18.9 | 79.6 | 76.1 |
| Toyama | 6,292 | 61 | 98.9 | Aug 10 | 97.3 | 7 | 7.0 | 91.9 | 68.1 |
| Utsunomiya | 5,771 | 52 | 97.7 | Aug 8 | 91.8 | 3 | 18.6 | 79.1 | 77.4 |
| Matsumoto | 5,411 | 139 | 99.7 | Aug 9 | 98.3 | 8 | 8.5 | 91.2 | 60.7 |
| Kochi | 5,300 | 64 | 99.9 | Aug 13 | 96.7 | 7 | 15.7 | 84.2 | 78.7 |
| Morioka | 5,205 | 41 | 98.4 | Aug 10 | 93.7 | 5 | 14.8 | 83.6 | 71.3 |
| Himeji | 4,791 | 42 | 97.7 | Aug 8 | 92.8 | 3 | 16.5 | 81.2 | 71.9 |
| Nagano | 4,758 | 93 | 99.7 | Aug 10 | 97.2 | 7 | 10.3 | 89.4 | 60.2 |
| Oita | 4,658 | 42 | 96.0 | Aug 8 | 88.5 | 1 | 19.6 | 76.4 | 77.2 |
| Nara | 4,515 | 84 | 96.3 | Aug 10 | 88.8 | 1 | 25.3 | 71.0 | 54.9 |
| Koriyama | 4,371 | 55 | 98.6 | Aug 8 | 94.8 | 7 | 15.5 | 83.1 | 71.9 |
| Aomori | 4,142 | 40 | 100.0 | Aug 11 | 96.2 | 7 | 13.1 | 86.9 | 73.2 |
| Matsue | 4,098 | 66 | 99.2 | Aug 10 | 93.8 | 5 | 15.0 | 84.5 | 60.5 |
| Akita | 4,068 | 31 | 98.1 | Aug 8 | 93.3 | 6 | 15.1 | 83.0 | 67.0 |
| Kurashiki | 3,936 | 65 | 94.1 | Aug 8 | 89.1 | 0 | 21.4 | 72.7 | 68.5 |
| Mito | 3,759 | 40 | 96.0 | Aug 8 | 82.7 | 1 | 30.2 | 65.8 | 82.4 |
| Yamagata | 3,521 | 56 | 97.1 | Aug 9 | 93.2 | 3 | 15.6 | 81.5 | 58.5 |
| Fukui | 3,383 | 50 | 99.9 | Aug 10 | 97.8 | 7 | 11.0 | 88.9 | 46.2 |
| Tokushima | 3,084 | 47 | 99.8 | Aug 14 | 96.3 | 8 | 20.8 | 79.0 | 69.2 |
| Kofu | 2,861 | 40 | 98.4 | Aug 10 | 93.9 | 7 | 21.8 | 76.6 | 86.9 |
| Wakayama | 2,842 | 46 | 99.3 | Aug 8 | 93.2 | 7 | 25.6 | 73.7 | 74.7 |
| Fukuyama | 2,717 | 40 | 97.8 | Aug 15 | 92.7 | 4 | 19.7 | 78.1 | 86.1 |
| Shimonoseki | 2,646 | 50 | 99.2 | Aug 13 | 93.2 | 6 | 20.2 | 79.0 | 70.3 |
| Gifu | 2,635 | 33 | 98.8 | Aug 8 | 90.1 | 1 | 29.1 | 69.7 | 73.0 |
| Yamaguchi | 2,632 | 29 | 98.9 | Aug 8 | 90.7 | 1 | 25.8 | 73.1 | 77.4 |
| Tottori | 2,463 | 36 | 99.5 | Aug 8 | 94.1 | 7 | 25.0 | 74.5 | 78.1 |
| Otsu | 2,456 | 46 | 98.5 | Aug 11 | 96.0 | 7 | 8.4 | 90.1 | 34.7 |
| Saga | 2,100 | 48 | 95.9 | Aug 10 | 89.1 | 3 | 20.4 | 75.5 | 72.5 |
| Maebashi | 2,079 | 36 | 98.5 | Aug 8 | 88.8 | 1 | 23.7 | 74.8 | 73.7 |
Estimated OCC and swing are expressed in % and pt respectively. Days at ceiling is the number of days with estimated OCC at 95% or above (maximum nine). N=36 cities, 2,504–2,535 properties, 188,067 rooms (as of August 13, 2026). Three cells with coverage below 90% or a listed-property count deviating 10% or more from the period median (Morioka Aug 8, Matsue Aug 13, Mito Aug 13) were excluded from the aggregation. Source: MetroEngines Research; compiled by the HotelBank Editorial Team
What operators can take from this
Translating the analysis into revenue practice gives three points.
First, the assumption that “our city is small, so it fills up early” is correct about the height of the ceiling, but provides no basis for how long you stay there. Both Maebashi and Oita reached the ceiling, yet each held 95% or above on only one of the nine days. Generalising a single sold-out peak day into “Obon fills itself” leaves room to miss revenue opportunity on the surrounding dates. If anything, markets with fewer days at ceiling have more upside in how they build the weekdays either side of the peak.
Second, in markets with a high business-hotel share, the daily Obon curve is a different animal from the normal-season curve. Because the weekday floor drops away, carrying normal-season day-of-week pricing straight across makes it easy to end up with high prices in the demand trough and low prices at the peak. In markets with swings above 25pt — Mito, Gifu, Yamaguchi, Wakayama, Nara and Tottori — there is particular room to build step changes into daily pricing.
Third, the relationship that markets with a more diversified property mix absorb inventory more stably also applies at the single-property level. The same structure that produced smooth curves in markets like Otsu and Matsuyama, where ryokan, city hotels and resorts coexist, applies to running family, business and inbound plans in parallel within one hotel. Holding several segments with different demand characteristics is what makes the peak-season trough shallower.
Note that this article is a macro aggregate at the city level and does not address the occupancy of individual properties. To establish where your own property stands, compare how far ahead of or behind the market-average curve your inventory absorption runs — with property type held constant. On lead-time decomposition by property type, see our comparison of Hiroshima booking curves across three property types; on reversals in the final week, see Miyagi Obon Aug 15: ryokan from 68.6% at T-45 to 92.2%.
Summary
The answer to “do cities with thinner room stock hit the ceiling sooner?” is a qualified yes. For the level reached on the peak day, a moderate negative correlation with total city room stock is confirmed (r = −0.473) and the hypothesis is supported. But the correlation with the number of days spent pinned at the ceiling is r = −0.178, essentially zero, and on that count the hypothesis does not hold.
What size really explained was not the height of the ceiling but the swing in daily absorption (r = −0.444). And that swing was explained more strongly by the business-hotel share of the city’s room stock (r = +0.569). Size and property mix together give R² = 0.444. Obon demand in Japan’s regional core cities is governed less by how big the city is than by what kind of demand its hotels live on.
The practical implication heading into Obon 2027 is simple. Establish your own market’s swing first, then separate whether that swing comes from size or from property mix. If it is the former, gentle daily price differentials will do; if it is the latter, you need a design that deliberately targets the trough days.
How to read this data: the estimated OCC in this article is an estimate based on how inventory listed on OTAs is absorbed, and is defined differently from a property’s true house-level occupancy (it excludes direct bookings, group business and travel-agent allotments, so it runs higher than actual occupancy). It is used only as a macro aggregate at the city level and does not represent the occupancy of any individual property. The analysis covers confirmed actuals for August 8–16, 2026, and is not a forecast of future dates.
Related reading
- Hiroshima Booking Curves: 26.2pt Gap at T-45, Ryokan +10.9pt
- Miyagi Obon Aug 15: Ryokan 68.6% at T-45 to 92.2%, 20.6pt Gap
- Japan’s Last Summer Weekends: 82.8% on Aug 22, 81.0% on Aug 29
- Kyoto Day-of-Week OCC: Thursday 90.4% Edges Friday, May–Jul 2026
- Do Big Hotels Fill Last? 200+ Rooms Lead by 25.8pt at LT90
- Obon T-7: Kyushu’s 31.7pt Gap — Fukuoka 73.0%, Kagoshima 41.3%
- Supply Absorption Capacity in 8 Regional Core Cities — GW2026
References and sources
- MetroEngines Research — daily estimated OCC, remaining rooms and listed property counts for 36 regional core cities (August 8–16, 2026; N=2,504–2,535 properties, 188,067 rooms), plus room stock by property type
- Japan Tourism Agency, “Accommodation Survey” — macro reference values for actual occupancy
- Cabinet Office, “National Holidays” — calendar confirmation for Mountain Day, August 11, 2026
- JTB Tourism Research & Consulting — general trends in summer 2026 travel
■ Data source
Daily observations of OTA-listed inventory collected by MetroEngines Research. The scope is 36 regional core cities excluding government-designated major cities, over the nine days from August 8 to 16, 2026. The population comprises 2,504–2,535 properties and 188,067 rooms (as of August 13, 2026). Room stock by property type was aggregated by splitting the same population into business hotels, city hotels, ryokan and resorts.
■ Calculation assumptions
Estimated OCC = (total rooms − remaining rooms listed on OTAs) ÷ total rooms. Days at ceiling is defined as the number of days with estimated OCC at 95% or above (maximum nine), and the swing as the gap in points between the highest and lowest estimated OCC across those nine days. Correlations are reported both as Pearson’s product-moment coefficient r (with total city room stock log-transformed) and as rank correlation ρ, in both cases with N=36 cities. The multiple regression uses two variables: total city room stock (log) and business-hotel room share.
■ Limitations and caveats
Estimated OCC is based on OTA-listed inventory and excludes direct bookings, group business and travel-agent allotments, so it runs higher than actual occupancy. Ryokan, guesthouses and simple lodgings not listed on OTAs are not part of the population. Three cells with observation coverage below 90%, or a listed-property count deviating 10% or more from the period median (Morioka August 8, Matsue August 13, Mito August 13), were excluded from the aggregation; the median coverage across the remaining 321 cells is 97.5%. This article is a macro aggregate at the city level and does not represent the occupancy of individual properties; correlations describe association and do not demonstrate causation.