

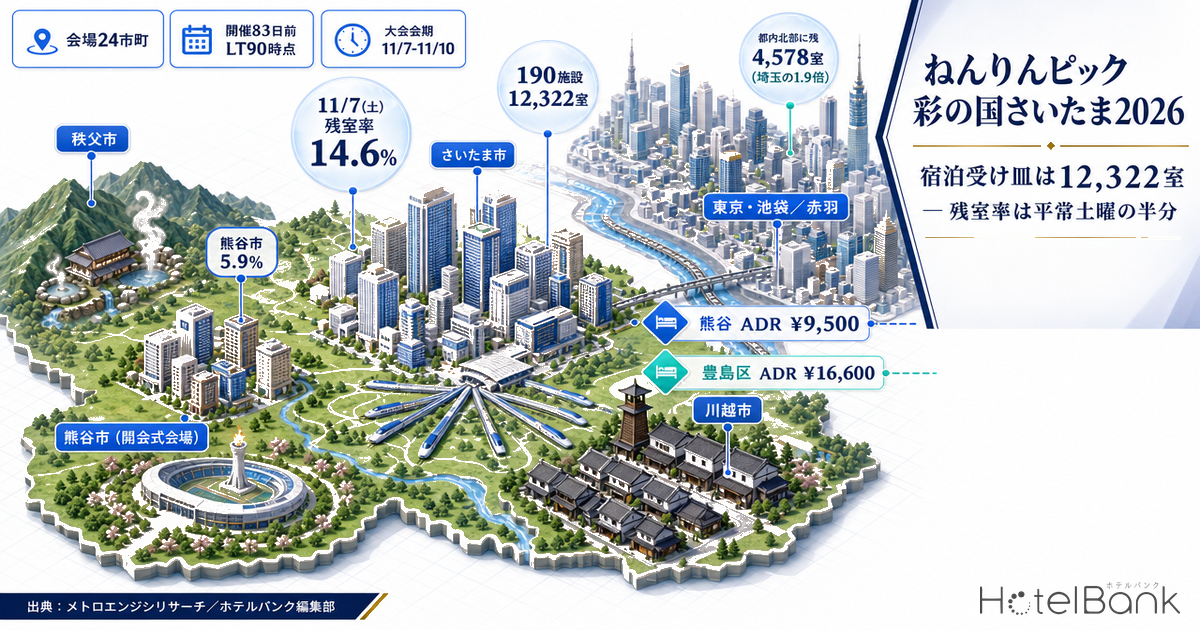
From Saturday, November 7 to Tuesday, November 10, 2026, the 38th National Health and Welfare Festival — “Nenrinpic Sai-no-Kuni Saitama 2026” — will be held across 24 municipalities in Saitama Prefecture. It is organized by the Ministry of Health, Labour and Welfare, Saitama Prefecture, the City of Saitama and the Foundation for Social Development for Senior Citizens, and co-hosted by the Japan Sports Agency. Thirty events will be staged — 26 sporting and four cultural — and Saitama Prefecture has announced an expected turnout of roughly 600,000 people on a cumulative basis, including spectators. Delegations of participants aged 60 and over will gather from across Japan for four days: how much of that can the host prefecture’s room stock absorb? This article builds up the room inventory of the 24 host municipalities and, at a survey point 83 days before the opening, compares booking pace against a normal autumn weekend.
Metric Definitions Used in This Article
- LT (lead time): the number of days until the check-in date. LT0 is same-day. Every inventory comparison in this article is aligned at LT90 (90 days before the stay date).
- Availability rate: the number of rooms still listed on OTAs at each observation point, divided by the total room count of the properties covered (room basis). It is an estimate based on how far listed OTA inventory has sold through, and differs from a property’s actual occupancy rate.
- ADR (average daily rate): an estimated settled rate (tax-excluded equivalent), calculated by applying a segment-specific adjustment factor to the lowest published plan level each property lists on OTAs (double occupancy, per-room rate, tax included). Cross-checked against property-level results disclosed by listed hotel REITs (184 property-months, April–May 2026), the median error is 7.5% (6.0% for business and city hotels). It is an estimate and differs from the actual transacted prices or accounting figures of individual properties. Area-level ADR is the median of the properties covered (the level of a typical property in that area).
- Listed price: the per-room rate for double occupancy (tax included), averaged across all plans. The basis differs from ADR.
- Data source: MetroEngines Research
- — The room stock of the 24 host municipalities is 190 properties and 12,322 rooms. While 79.9% of all rooms in Saitama Prefecture sit on the host side, nine municipalities have fewer than 200 rooms and Okegawa has none at all — locally self-contained lodging assignment is not feasible.
- — On the opening day, Saturday November 7, the availability rate at LT90 is 14.6% (2,405 rooms). That is roughly half the 27.7% median for October Saturdays: about 2,380 more rooms have already disappeared than in a normal week.
- — Demand peaks not on the competition days but on the day-before arrivals of Friday November 6 and Saturday November 7. The closing day, Tuesday November 10, sits at 33.7% — a normal level — so effective lodging demand is confined to the four nights of November 6–9.
- — The closer to a venue, the faster the pace: Kumagaya is at an availability rate of 5.9%, Kawagoe 10.5%, and Omiya Ward in Saitama City 14.0%. Chichibu and Kawaguchi hold around 30%, making them among the few host municipalities with capacity left.
- — Tokyo, by contrast, remains at a normal 31.9% even on November 7. Toshima (Ikebukuro) and Kita (Akabane) wards alone still hold 4,578 rooms — 1.9 times the 2,405 rooms left across the whole of Saitama Prefecture.
The 24 host municipalities hold 190 properties and 12,322 rooms — 80% of the prefecture’s stock sits on the venue side
Start by measuring the actual size of the capacity. Within the scope MetroEngines Research covers, 252 properties with 15,413 rooms in Saitama Prefecture can be confirmed as active on OTAs. Of these, 190 properties with 12,322 rooms are located in the 24 host municipalities, accounting for 79.9% of the prefecture’s rooms. Only 62 properties and 3,091 rooms sit outside the host municipalities.
Those 12,322 rooms are far from evenly spread, however. The top three — Saitama City (3,451 rooms), Kumagaya (1,715 rooms) and Kawagoe (889 rooms) — account for 49.1% of the host-municipality stock on their own, with the remaining 21 municipalities splitting the other half. That Kumagaya, home to the Kumagaya Sports & Culture Park where the opening ceremony will be held, is the prefecture’s second-largest concentration of rooms works in its favour as a host — yet even Kumagaya has only 1,715 rooms.
At the other end, some municipalities host events while having virtually no room stock at all. Okegawa, venue for the indiaca exchange tournament, has zero rooms at accommodation facilities that can be confirmed as active on OTAs within our coverage. Gyoda has two properties and 30 rooms, Kasukabe two properties and 61 rooms, and Ogano Town seven properties and 97 rooms. Together those four municipalities total just 188 rooms, so lodging demand cannot be absorbed on site even where a competition venue is located. Organisers’ lodging assignment must inevitably be designed around staying outside the host municipalities and travelling in on the day.
Source: MetroEngines Research; compiled by the HotelBank Editorial Team (N=190 properties, 12,322 rooms, 24 host municipalities)
Room stock by host municipality — nine have fewer than 200 rooms
Ranking the 24 municipalities by room count, nine have fewer than 200 rooms. Given that some events draw several hundred people once delegations and accompanying staff are counted, it is natural to assume these municipalities are not planning on lodging assignment that can be completed locally.
| Host municipality | Properties | Rooms | Host municipality | Properties | Rooms |
|---|---|---|---|---|---|
| Saitama City | 38 | 3,451 | Niiza | 3 | 267 |
| Kumagaya | 14 | 1,715 | Kazo | 3 | 227 |
| Kawagoe | 14 | 889 | Konosu | 2 | 225 |
| Fukaya | 14 | 816 | Asaka | 2 | 198 |
| Chichibu | 29 | 650 | Kuki | 3 | 197 |
| Kawaguchi | 12 | 616 | Toda | 1 | 166 |
| Soka | 5 | 604 | Satte | 3 | 151 |
| Honjo | 11 | 514 | Misato | 1 | 114 |
| Ageo | 5 | 397 | Ogano Town | 7 | 97 |
| Tokorozawa | 10 | 386 | Kasukabe | 2 | 61 |
| Koshigaya | 6 | 281 | Gyoda | 2 | 30 |
| Warabi | 3 | 270 | Okegawa | 0 | 0 |
| 24 municipalities, total | 190 | 12,322 | Prefecture total | 252 | 15,413 |
Source: MetroEngines Research; compiled by the HotelBank Editorial Team (Saitama City figures aggregate its wards. Only facilities confirmed active on OTAs; unlisted simple lodgings and similar are excluded)
Source: MetroEngines Research; compiled by the HotelBank Editorial Team. Circle size represents the room count of each host municipality; position is the average coordinate of its accommodation facilities.
Booking pace at the 83-days-out cross-section — November 7 availability is 14.6%, about half a normal Saturday
Next, the demand side. The chart below plots the availability rate at LT90 (90 days before the stay date) by stay date, covering the 204 properties (16,491 rooms in total) in Saitama Prefecture for which inventory could be observed. Tokyo (1,275 properties, 178,976 rooms) at the same LT90 point is overlaid for comparison.
Saitama had been running at around 30–35% from late October into early November, then falls sharply — 22.1% on Friday November 6, 14.6% on Saturday November 7, 18.6% on Sunday November 8 and 25.5% on Monday November 9 — before returning to a normal level of 33.7% on the closing day, Tuesday November 10. The median availability rate across October’s four Saturdays (October 3, 10, 17 and 24) is 27.7%, so the 14.6% on November 7 is about half that. Translated into rooms, a normal Saturday would leave roughly 4,790 rooms available across the prefecture, whereas November 7 leaves only 2,405 — some 2,380 rooms have sold through earlier than usual.
The figure worth noting is the 22.1% on Friday November 6. That Friday, the day before the opening, is also running ahead of a normal pace. Because delegations travelling from afar generally arrive the day before, the peak of lodging demand falls not on the competition days themselves but on “the night before, plus the second night.” Conversely, the closing day of November 10 sits at a normal 33.7%, so essentially no Tuesday check-in demand is materialising. Effective lodging demand is confined to the four nights of November 6–9, with the peak concentrated in the two nights of the 6th and the 7th. Saitama in normal times has a day-of-week structure in which demand spikes on Saturday and then falls into back-to-back troughs on Sunday and Monday; that normal pattern is analysed in detail in Saitama Business Hotels: Sat 77.2% vs Sun 70.1%.
Source: MetroEngines Research; compiled by the HotelBank Editorial Team (Saitama N=204 properties, 16,491 rooms; Tokyo N=1,275 properties, 178,976 rooms. October 28, October 29, October 31 and November 14 are hidden because the number of observed properties was insufficient)
| Stay date | Saitama availability | Saitama rooms left | Saitama listed price | Tokyo availability | Tokyo rooms left |
|---|---|---|---|---|---|
| Nov 6 (Fri), eve of the festival | 22.1% | 3,653 rooms | ¥20,600 | 33.3% | 59,563 rooms |
| Nov 7 (Sat), day 1 | 14.6% | 2,405 rooms | ¥26,600 | 31.9% | 57,020 rooms |
| Nov 8 (Sun), day 2 | 18.6% | 3,071 rooms | ¥20,400 | 34.5% | 61,723 rooms |
| Nov 9 (Mon), day 3 | 25.5% | 4,210 rooms | ¥17,700 | 35.0% | 62,642 rooms |
| Nov 10 (Tue), closing day | 33.7% | 5,625 rooms | ¥16,500 | 35.0% | 62,616 rooms |
| Reference: October Saturdays (median) | 27.7% | approx. 4,790 rooms | ¥22,300 | 29.3% | — |
Source: MetroEngines Research; compiled by the HotelBank Editorial Team (all figures at LT90. Listed price is the all-plan average per room for double occupancy, tax included. October Saturdays are the median of October 3, 10, 17 and 24; October 10 falls on the first day of a three-day weekend)
Kumagaya is down to 5.9% — the closer to a venue, the faster the pace
Drilling down to the municipal level makes the skew in demand even clearer. Kumagaya, home to the opening ceremony venue, shows an availability rate of 5.9% at LT90 for November 7 (89 of 1,504 rooms). That is less than half its 12.9% median for October Saturdays and the fastest pace in the prefecture. Kawagoe is at 10.5% (88 of 835 rooms), 8.6 points below its October Saturday median of 19.1%. Omiya Ward in Saitama City is at 14.0% (362 of 2,593 rooms), down 11.0 points from 25.0%.
What is interesting is that Chichibu (29.0% against an October Saturday median of 43.6%) and Kawaguchi (29.6% against 46.2%) — host municipalities that normally carry ample inventory — show declines of 14 to 17 points versus normal, among the largest in the prefecture. In absolute terms just under 30% of rooms are still available, but demand is unmistakably flowing in. Put the other way round, these two cities are among the few host municipalities that still have capacity to take.
Source: MetroEngines Research; compiled by the HotelBank Editorial Team (at LT90. October Saturdays are the median of October 3, 10, 17 and 24. Kawagoe’s October median includes the Kawagoe Festival period of October 17–18)
One caveat at the municipal level: the set of observed properties varies somewhat by date. Kumagaya, for example, moves from 13 properties and 1,775 rooms at the October observation points to 10 properties and 1,504 rooms as of November 7. Although the availability rate is normalised as a ratio to the total room count at each point, small markets with property counts in the low double digits can be affected by shifts in the underlying sample. Here we treat the magnitude of the decline — 7 to 17 points — as the trend rather than the precise level.
Tokyo has not moved — the 4,578 rooms still open in Ikebukuro and Akabane
This is the central point of this article. While Saitama’s inventory has been squeezed to half its normal level, Tokyo shows an availability rate of 31.9% (57,020 rooms) at LT90 for November 7. That is actually 2.6 points above its October Saturday median of 29.3%: the festival has yet to show up in the capital’s inventory at all.
Looking individually at northern Tokyo, 20 to 30 minutes from Saitama by rail, Toshima Ward — which contains Ikebukuro — is at 37.6% on November 7 (3,696 of 9,827 rooms), 3.2 points above its October Saturday median of 34.4%. Kita Ward, which contains Akabane, is at 38.7% (882 of 2,277 rooms), down 5.0 points from 43.8%, so there is a slight hint of demand flowing in there. Even so, the two wards combined still hold 4,578 rooms on November 7 — 1.9 times the 2,405 rooms left across the whole of Saitama Prefecture at the same point.
In other words, the host prefecture’s inventory tightens first, while an area just across the prefectural border still holds nearly twice as much untouched. At this 83-days-out cross-section, participants and their companions can evidently still complete their accommodation search within Saitama. As the stay dates approach, demand that cannot be absorbed inside the prefecture is likely to spill outside it. Akabane, directly connected to Omiya on the JR Utsunomiya, Takasaki and Keihin-Tohoku lines, and Ikebukuro, linked to southern Saitama by the Shonan-Shinjuku and Saikyo lines, are the locations first in line to receive it.
Price gaps act as friction on the spillover — between Kumagaya at ¥9,500 and Ikebukuro at ¥16,600
How far the spillover goes also depends on price gaps. Estimated settled ADR for November 2026 by city and ward runs ¥9,500 in Kumagaya (N=13 properties), ¥11,100 in Kawagoe (N=11) and ¥12,600 in Omiya Ward, Saitama City (N=14), against ¥13,800 in Kita Ward, Tokyo (N=19) and ¥16,600 in Toshima Ward (N=56). Chichibu sits at a different level again, ¥15,300 (N=24), because hot-spring ryokan dominate its sample.
Moving from Kumagaya to Akabane therefore adds about ¥4,300 per room, and to Ikebukuro about ¥7,100. Given that participants are aged 60 and over and that many will be booked as groups through municipalities or organisations, that price gap works as friction that cannot be ignored. In practice, the sequence is likely to be that pressure builds first on mid-priced inventory within Saitama before prices there peak, and only once that fills does demand move outside the prefecture. The inventory for November 6 and 7, which has tightened inside the prefecture first, supports that reading.
Source: MetroEngines Research; compiled by the HotelBank Editorial Team (November 2026, estimated settled ADR; figures in parentheses are the number of properties covered)
The allocation posted to OTAs is thin — how to read effective capacity
One more point that cannot be overlooked in assessing capacity is how many rooms are actually posted to OTAs in the first place. For November 7, of the 157 properties in Saitama for which inventory could be observed, only 35 properties with 1,412 rooms had 30% or more of their total room count listed on OTAs. That is less than a tenth of the 16,491 rooms in the prefecture’s observed inventory.
It would not be accurate to read that figure as “the prefecture’s accommodation is sold out.” Several explanations are possible for a small OTA allocation: (1) operations built around channels other than OTAs — direct sales via official websites, call centres, travel agencies and group contracts; (2) inventory control in which rooms are not released to OTAs all at once but added in small tranches as the check-in date approaches; and (3) a contractually small allotment to OTAs in the first place. For demand of this kind, where group lodging assignment predominates, it is natural to assume a substantial volume has already been secured off-OTA. In addition, only seven days had elapsed since observation began for November 7 as of the survey date, so this sample is expected to grow as more inventory is added.
Effective capacity that an ordinary individual traveller can secure through OTAs is therefore considerably smaller than the headline total of 15,413 rooms in the prefecture. Where DMOs and local governments run initiatives to “get visitors touring the surrounding area alongside the festival,” they will need to secure an allocation for general visitors coming to watch and support, separate from the delegations’ lodging assignment.
Short-stay inventory deserves a mention too. Around Omiya Station, the centre of Saitama City (a 2 km radius centred on Palace Hotel Omiya), 14 hotels with 2,079 rooms sit alongside 15 short-term rental listings with a combined capacity of 75 guests — 3.6 guests of short-term rental capacity per 100 hotel rooms (listing cross-section for January 2027, surveyed August 16, 2026). Short-term rental inventory is thin compared with central Tokyo, so total capacity is determined almost entirely by hotel inventory. Note that “short-term rental” here is not limited to lodgings under the Private Lodging Business Act: it refers to listing-based short-stay inventory that also includes properties operating under the Hotel Business Act and the National Strategic Special Zone scheme. Because the cap on operating days and the permitting framework differ by scheme, listing counts and capacity should be read as a cross-scheme aggregate. Listing counts do not match the number of notifications filed with the authorities.
Implications for operators, DMOs and investors
For accommodation businesses within Saitama, November 6–9 are rare demand days in the annual calendar. The speed of the pace on Friday November 6 relative to normal, in particular, shows there is room to treat that Friday as something other than merely the day before a weekend. Because the dates generate day-before arrivals and multi-night stays, plan design premised on stays of two nights or more, together with early-morning meal service matched to competition schedules that start early, translates into revenue opportunity. In Kumagaya, Kawagoe and Omiya, where strong demand already shows in the numbers, combining that with staged pricing by lead time creates further opportunity to expand revenue.
Areas such as Chichibu and Kawaguchi — host municipalities that nonetheless hold availability rates around 30% — have clear headroom left. Chichibu is differentiated by its concentration of hot-spring ryokan, and Kawaguchi has transport connectivity close to both Akabane and Omiya. This is a moment where appeal aimed not only at participants but at accompanying family members and spectators can work effectively. Omiya and Saitama Shintoshin also function as a demand-generating hub for the northern gateway to the Tokyo metropolitan area, thanks to a rail junction where six Shinkansen directions converge.
For operators in northern Tokyo, the 4,578 rooms still open in Ikebukuro and Akabane on November 7 are inventory that comes into play as Saitama’s own inventory tightens. If the prefecture does fill up first, demand will inevitably cross the border. Communicating explicit travel times from southern Saitama, and accommodating multi-night stays across several dates, is the key to capturing that spillover.
From an investment and development perspective, the structure itself is telling: of the 24 host municipalities, nine have fewer than 200 rooms and one has effectively no room stock at all. Widely dispersed events such as Nenrinpic will continue to rotate among prefectures (for a comparable rotating event viewed through municipal-level inventory and prices, see Aomori’s First National Sports Games in 49 Years), but in a region like Saitama with a vast adjacent market in Tokyo, it is more rational to raise the utilisation of existing stock and design operations around combined use with the capital than to pile on large new supply within the prefecture. The fact that 80% of the prefecture’s rooms sit on the host-municipality side means less that supply is short than that this is a market where pricing and allocation design are what work against a concentration of demand days.
⚠ Note on forward-dated data: the availability rates, listed prices and estimated settled ADR in this article are estimates based on inventory and selling prices published on OTAs as of the survey date (August 2026), and will shift as the stay dates approach. Nenrinpic Sai-no-Kuni Saitama 2026 falls 83 days after the time of writing, and the figures here are a single cross-section of a booking situation still in progress. It is equally possible that additional inventory is released for dates that currently look tight, or that dates with room to spare fill rapidly. Nothing here should be taken as a determination of whether any individual property will sell out.
Related reading
- Saitama Business Hotels: Sat 77.2% vs Sun 70.1%, Gap Widens to 11pt
- Aomori’s First National Sports Games in 49 Years: Prices and Inventory
- Hakozakigu Hojoya 2026: Fukuoka Demand Peaks Opening Weekend +3.8pt
- Omagari Fireworks: Akita 97.8% OCC 45 Days Out, Only 2.2pt Headroom
- Hotel Investment in Japan’s “Second-Tier” Cities: ADR, Supply & Yield Across 5 Markets
- Japan’s Second Cities: 21 Prefectures Where the Capital Isn’t #1
- Intra-Prefecture ADR Gaps 2026: Median 2.74x, Okinawa Widest at 5.86x
References and sources
■ Official festival information
- Saitama Prefecture, “Nenrinpic Sai-no-Kuni Saitama 2026” official festival website (dates, 24 host municipalities, 30 events, expected turnout)
- Saitama Prefecture, “Nenrinpic Sai-no-Kuni Saitama 2026 will be held in fiscal 2026” (organisers, expected cumulative turnout of approximately 600,000)
- Foundation for Social Development for Senior Citizens, “38th Saitama Festival” list of host locations (host municipalities, venues by event)
- City of Okegawa, “Nenrinpic Sai-no-Kuni Saitama 2026 Indiaca Exchange Tournament”
- City of Kumagaya, “Nenrinpic Sai-no-Kuni Saitama 2026”
- City of Saitama, “Nenrinpic Sai-no-Kuni Saitama 2026”
■ Data sources
Room stock is the property and room count of facilities that can be confirmed as active on OTAs within our coverage (Saitama Prefecture: 252 properties, 15,413 rooms; the 24 host municipalities: 190 properties, 12,322 rooms). Availability rates and rooms remaining are calculated from observation series of listed OTA inventory by stay date, with all comparisons aligned at LT90, 90 days before the stay date (Saitama: 204 properties, 16,491 rooms; Tokyo: 1,275 properties, 178,976 rooms; municipal figures use the observed properties in each city or ward). Estimated settled ADR is the area median for November 2026. Festival dates, host municipalities, events and expected turnout are taken from materials published by the organisers and host local governments.
■ Calculation assumptions
The benchmark for normal-week comparison is the median of October’s four Saturdays (October 3, 10, 17 and 24); October 10 is the first day of a three-day weekend, and Kawagoe’s median includes the Kawagoe Festival period of October 17–18. Rooms remaining are approximations derived from the total room count at each point multiplied by the availability rate. Listed price is the all-plan average per room for double occupancy including tax, while estimated settled ADR is a tax-excluded-equivalent estimate with segment-specific adjustments applied; because the two use different bases, they are not compared directly. Short-stay inventory is a listing cross-section for January 2027 within a 2 km radius of Omiya Station (surveyed August 16, 2026); because its price and inventory definitions do not align with hotel inventory, only listing counts and total capacity are shown, and no rate or sell-through metric is placed in the same table or chart as the hotel figures.
■ Limitations and caveats
The figures in this article are a single cross-section of a booking situation still in progress, 83 days before the festival, and will shift as the stay dates approach. Availability rates are estimates based on how far listed OTA inventory has sold through; because they exclude direct, group-contract and travel-agency inventory, they differ from a property’s actual occupancy rate. At the municipal level the observed properties vary by date (for example, Kumagaya shows 13 properties and 1,775 rooms at the October points versus 10 properties and 1,504 rooms as of November 7), and small markets with property counts in the low double digits can be affected by shifts in the underlying sample. Dates observed for only a short period are expected to see their sample grow as more inventory is added, and nothing here determines whether any individual property will sell out.
■ Market data
- MetroEngines Research — room stock (Saitama Prefecture: 252 properties, 15,413 rooms), availability trend by lead time (Saitama: 204 properties; Tokyo: 1,275 properties), estimated settled ADR, and listing counts for short-stay inventory