

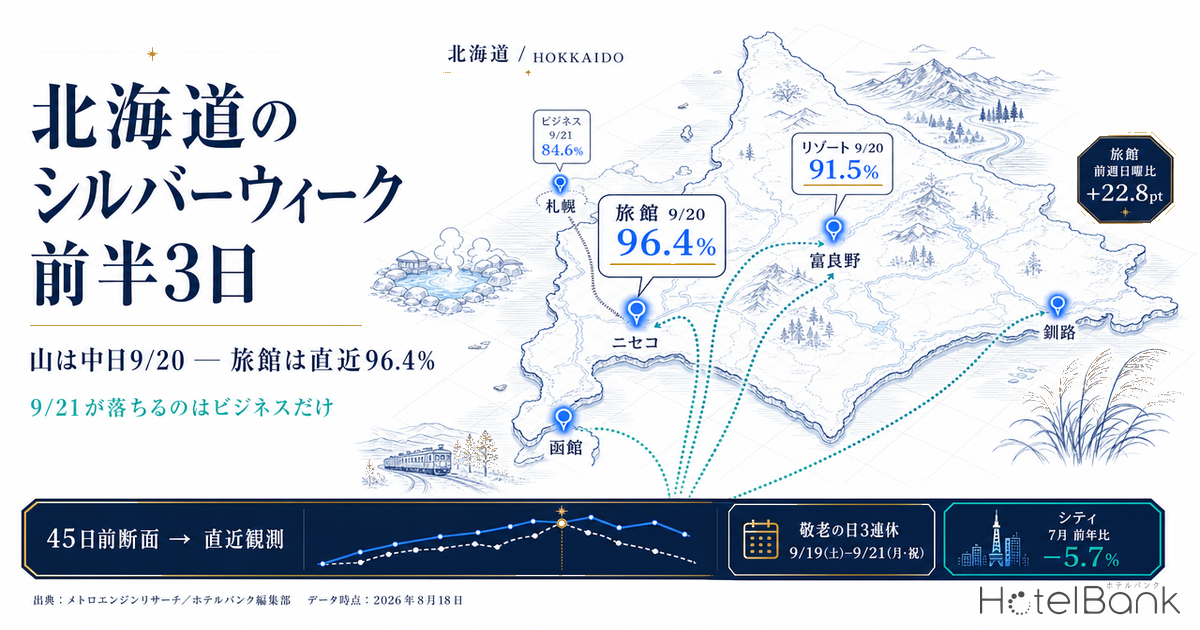
In 2026, Respect for the Aged Day falls on Monday, September 21. September 22 (Tue) is a Citizens’ Holiday and September 23 (Wed) is Autumnal Equinox Day, so Saturday September 19 through Wednesday September 23 forms a five-day holiday run — Silver Week. This article covers the first three days, where demand peaks; below, “the three-day weekend” refers to September 19-21. For Hokkaido, those three nights are already close to settled in demand terms. At the 45-days-out snapshot, estimated OCC (based on OTA-listed inventory) at resort hotels was 83.1% for 9/19, 91.5% for 9/20 and 88.8% for 9/21. Ryokan ran higher still — 93.8% for 9/20, reaching 96.4% at the latest observation (34 days before the stay date, as of August 17, 2026).
What deserves attention is where the peak sits. A three-day weekend is usually pictured as front-loaded, but in Hokkaido the opening day 9/19 is the weakest of the three and the middle day 9/20 the strongest. The other piece of conventional wisdom — that the back end of a holiday run falls away — does not hold this year either, at least not for ryokan, resort and city hotels in Hokkaido. Lined up at the same number of days remaining as the same weekday one week earlier, 9/21 (Mon, holiday) runs 14.0pt above the ordinary Monday of 9/14 at resorts and 19.3pt above at ryokan. Business hotels were the only segment where 9/21 came in relatively weak.
Scope: Hokkaido resort hotels (139 properties, 16,072 rooms), city hotels (74 properties, 15,884 rooms), business hotels (380 properties, approx. 43,200 rooms) and ryokan (268 properties, 11,623 rooms). The price metric in this article is estimated settled ADR (the transacted price level estimated from OTA and other sales data, tax-excluded equivalent); occupancy is an estimate based on OTA-listed inventory. Definitions for both appear at the end of the article. Data as of August 18, 2026.
- — Demand peaks not on the opening day but on the middle day, 9/20. At the 45-days-out snapshot, estimated OCC was 94.4% at city hotels, 93.8% at ryokan and 91.5% at resorts; the lowest of the three days is the opener, 9/19.
- — Ryokan on 9/20 reached 96.4% at the latest observation (34 days out, as of August 17, 2026), with 71.3% of properties showing no confirmable listed inventory.
- — 9/21 (Mon, holiday) runs +14.0pt at resorts and +19.3pt at ryokan versus the prior Monday. At the 45-days-out snapshot, business hotels are the only segment below 9/19 (−2.1pt).
- — The trough sits outside the holiday. Sunday 9/27, the weekend after, runs 71.6% at business hotels and 71.9% at ryokan — the lowest level across the eight days covered for business hotels.
- — The price yardstick is the finalized estimated settled ADR for July 2026: city hotels at ¥17,800, −5.7% year on year, with business hotels the only segment in positive territory at +4.1%.
The 45-days-out snapshot — the holiday premium shows up on the middle and final days, not the opener
When comparing booking curves across dates, the right comparison is not calendar date against calendar date but like-for-like on days remaining until the stay date. Here, each day of the three-day weekend is set against the same weekday one week earlier (Sat 9/12, Sun 9/13, Mon 9/14), all at the 45-days-out snapshot.
| Segment (N) | 9/19 (Sat) | 9/12 (Sat) | Diff | 9/20 (Sun) | 9/13 (Sun) | Diff | 9/21 (Mon, hol.) | 9/14 (Mon) | Diff |
|---|---|---|---|---|---|---|---|---|---|
| Resort hotels (139) | 83.1% | 76.9% | +6.2pt | 91.5% | 74.8% | +16.7pt | 88.8% | 74.8% | +14.0pt |
| City hotels (74) | 90.9% | 87.0% | +3.9pt | 94.4% | 79.9% | +14.5pt | 90.6% | 79.6% | +11.0pt |
| Business hotels (380) | 86.7% | 82.4% | +4.3pt | 88.6% | 74.5% | +14.1pt | 84.6% | 75.5% | +9.1pt |
| Ryokan (268) | 87.0% | 77.6% | +9.4pt | 93.8% | 71.0% | +22.8pt | 89.6% | 70.3% | +19.3pt |
Source: MetroEngines Research; compiled by the HotelBank Editorial Team
The uplift created by the holiday run — the three-day-weekend premium — is small on the opening Saturday. Saturdays in Hokkaido already draw demand: on the prior Saturday, 9/12, city hotels stood at 87.0% and business hotels at 82.4%, leaving gaps to 9/19 of just +3.9pt and +4.3pt respectively. How Hokkaido Saturdays build from 45 days out can also be seen in Hokkaido City Hotels: Only Aug 15 Trails at 78.7% OCC, 45 Days Out, which tracks August Saturdays on the same three-point frame. The premium is largest on Sunday 9/20, where ryokan run +22.8pt against the prior Sunday and resorts +16.7pt. Monday 9/21, a public holiday, is lifted to a similar degree — ryokan +19.3pt and resorts +14.0pt against an ordinary Monday.
In other words, Hokkaido’s Respect for the Aged Day weekend is not a case of “Saturday leads, Sunday and Monday tag along.” Sunday and Monday are the days that earn the gap against normal conditions. The opening Saturday sells with or without a holiday run; the incremental demand the holiday genuinely creates sits in the back two days.
Source: MetroEngines Research; compiled by the HotelBank Editorial Team
From 45 days out to the latest reading — up to +4.2pt added, with the headroom left on the opening day
Next, the same three days are tracked across three fixed points: 45 days out, 40 days out and the latest observation (as of August 17, 2026 — 33 days out for 9/19, 34 for 9/20 and 35 for 9/21). The largest gain from the 45-days-out level is ryokan on 9/19 at +4.2pt, followed by resorts on 9/19 at +3.5pt and business hotels on 9/20 at +3.2pt. City hotels on 9/20, by contrast, are flat at −0.1pt — a sign that there was already little room left to move 45 days out.
Source: MetroEngines Research; compiled by the HotelBank Editorial Team
| Segment / stay date | 45 days out | 40 days out | Latest observation | Gain | Sold-out property rate (45 days out → latest) |
|---|---|---|---|---|---|
| Resort 9/19 (Sat) | 83.1% | 84.7% | 86.6% | +3.5pt | 23.7% → 30.2% |
| Resort 9/20 (Sun) | 91.5% | 92.9% | 93.4% | +1.9pt | 48.2% → 55.4% |
| Resort 9/21 (Mon, hol.) | 88.8% | 89.9% | 91.4% | +2.6pt | 39.6% → 46.0% |
| City 9/19 (Sat) | 90.9% | 91.6% | 91.6% | +0.7pt | 28.4% → 28.4% |
| City 9/20 (Sun) | 94.4% | 94.9% | 94.3% | −0.1pt | 39.2% → 48.6% |
| City 9/21 (Mon, hol.) | 90.6% | 91.2% | 91.9% | +1.3pt | 24.3% → 32.4% |
| Business 9/19 (Sat) | 86.7% | 87.7% | 88.9% | +2.2pt | 40.8% → 40.5% |
| Business 9/20 (Sun) | 88.6% | 89.8% | 91.8% | +3.2pt | 43.4% → 49.5% |
| Business 9/21 (Mon, hol.) | 84.6% | 85.9% | 87.7% | +3.1pt | 29.7% → 34.7% |
| Ryokan 9/19 (Sat) | 87.0% | 88.5% | 91.2% | +4.2pt | 46.4% → 57.7% |
| Ryokan 9/20 (Sun) | 93.8% | 94.8% | 96.4% | +2.6pt | 64.9% → 71.3% |
| Ryokan 9/21 (Mon, hol.) | 89.6% | 91.3% | 92.9% | +3.3pt | 54.9% → 58.6% |
Source: MetroEngines Research; compiled by the HotelBank Editorial Team
The latest observation is the snapshot 33 days out for 9/19, 34 days out for 9/20 and 35 days out for 9/21. The share of properties with no confirmable listed inventory — the estimated sold-out property rate — is highest for ryokan on 9/20 at 71.3%, followed by resorts on 9/20 at 55.4% and business hotels on 9/20 at 49.5%. Inventory disappearing in concentrated fashion on the Sunday is common to every segment. The opening day 9/19, by contrast, sits at 30.2% for resorts and 28.4% for city hotels — roughly 20pt below the Sunday. As of the latest reading, the day with the most inventory still moving is the opener.
For reference, in the completed month of July 2026 — Hokkaido’s peak month — daily average estimated OCC was 88.4% at resorts, 93.6% at city hotels, 94.2% at business hotels and 87.6% at ryokan (31 days each; observed property counts of 129-138 for resorts, 68-74 for city, 368-394 for business and 248-271 for ryokan). July is a completed record for stay dates already passed, while the September three-day weekend is a mid-course reading still more than 30 days ahead — different in character. Even so, it is worth noting that ryokan at 96.4% and city hotels at 94.3% on 9/20 have already reached a level on par with the monthly average of Hokkaido’s peak season, more than a month in advance.
9/21 does not fall away — the weekend after the holiday does
The assumption that the final day of a holiday run is weak because it is the travel-home day does not carry over cleanly to Hokkaido this year. In 2026, 9/22 (Tue, holiday) and 9/23 (Wed, Autumnal Equinox Day) follow on, so 9/21 is not the return day but a middle day of the run. Booking progress for those back two days (9/22 and 9/23) is covered separately in Silver Week 2026 Back Half at T-47: Sep 23 Matches a Normal Wednesday. Comparing 9/21 with 9/19 at the 45-days-out snapshot, resorts run 5.7pt higher on 9/21 (88.8% vs. 83.1%) and ryokan 2.6pt higher (89.6% vs. 87.0%). City hotels are close to level (90.6% vs. 90.9%, −0.3pt). Business hotels are the only segment where 9/21 falls below 9/19, by −2.1pt (84.6% vs. 86.7%).
So where is the genuine weakness around this three-day weekend? Looking at the following weekend — Saturday 9/26 and Sunday 9/27 — at the 45-days-out snapshot, resorts stand at 77.2% and 74.6%, city hotels at 83.8% and 78.9%, business hotels at 80.5% and 71.6%, and ryokan at 76.6% and 71.9%. Sunday 9/27 is particularly low at 71.6% for business hotels and 71.9% for ryokan — the weakest level across the eight days examined here for business hotels (for ryokan, the prior week’s 9/13 at 71.0% and 9/14 at 70.3% run lower still). Part of the effort poured into the run-up to the three-day weekend is, in truth, better aimed not at the holiday itself but at the trough on the following weekend.
One further caveat on the observations. The closer the stay date, the fewer properties with confirmable inventory. For resorts on 9/20, for example, the observed property count falls from 137 at 45 days out to 84 at the latest observation. Thinner samples swing more, so it is safer to read the shape formed together with the 45-days-out and 40-days-out points rather than the latest single reading alone. That is why Table 2 includes the 40-days-out column.
A yardstick for price levels — Hokkaido estimated settled ADR, city hotels down 5.7% YoY in finalized July
Inventory depletion alone cannot settle whether pricing is right. Monthly estimated settled ADR (tax-excluded equivalent) gives the Hokkaido level. The most recent month comparable on a finalized-to-finalized basis is July 2026. City hotels came in at ¥17,800 (N=75 properties), down 5.7% against ¥18,900 (N=74 properties) a year earlier. Resort hotels were ¥18,100 (N=146 properties), down 4.0% from ¥18,800 (N=141 properties); ryokan were ¥9,800 (N=294 properties), down 3.3% from ¥10,100 (N=287 properties). Business hotels, at ¥11,200 (N=432 properties) versus ¥10,700 (N=421 properties), rose 4.1% — the only one of the four segments in positive territory. When this divergence between segments began is explored against finalized monthly data for the first half of the year in Hokkaido ADR H1 2026: City −5.7%, Business +4.1%, April the Turn.
Source: MetroEngines Research; compiled by the HotelBank Editorial Team
For September 2026 itself, the estimates based on current selling conditions are ¥16,500 for city hotels (N=75 properties), ¥17,000 for resort hotels (N=145 properties), ¥13,600 for business hotels (N=396 properties) and ¥12,800 for ryokan (N=278 properties). These are not finalized figures, however, and can move until the month closes. No year-on-year change is claimed by setting them directly alongside finalized September figures from last year; that comparison has to wait for the month-end close. Here they serve as a yardstick for checking where a property’s own September pricing sits within the market range.
What the shape shows is that Hokkaido city hotels build a peak across July and August and then step down through September and October — a seasonal curve drawn in common across both 2025 and 2026. The three-day weekend is a bump standing partway down that slope. How to reflect that structure — a handful of days running above 90% progress within a month whose average level is falling — in the pricing calendar is where practice divides.
For revenue managers running resorts, ryokan, city and business hotels in Hokkaido — implications and an action plan
1. Designing around “fill the opening day first” works backwards from the wrong point for a Hokkaido three-day weekend. At the 45-days-out snapshot the holiday premium is largest on Sunday 9/20 (ryokan +22.8pt, resorts +16.7pt), while the opener 9/19 stops at +9.4pt and +6.2pt. If a property’s own progress across the three days runs high on the opener and low on the middle day, it is pointing the opposite way from the market. The opening day sells whether or not there is a holiday run; the increment the run creates sits in the back two days, and that is the premise worth resetting.
2. Operations that discount 9/21 first deserve a second look this year. 9/21 (Mon, holiday) runs +14.0pt at resorts and +19.3pt at ryokan versus the prior Monday, and sits above 9/19 at the 45-days-out snapshot. Properties that have treated 9/21 as the day to loosen early are, this year at least, more likely to have inventory left on the opener 9/19. Business hotels are the exception — 9/21 is their lowest of the three days (84.6% at 45 days out) — so the position of 9/21 needs to be considered segment by segment.
3. The headroom sits on the days where the sold-out property rate is still low. At the latest observation, the share of properties with no confirmable listed inventory is 71.3% for ryokan on 9/20, against 30.2% for resorts on 9/19 and 28.4% for city hotels on 9/19. The market splits clearly between days where inventory is still moving and days where it has all but stopped. It is worth taking stock of a property’s remaining inventory — which day, how many rooms, at which price band — against that contrast.
4. The real problem in the run-up is the weekend after the holiday. At the 45-days-out snapshot, the days falling well below the three holiday nights are Sunday 9/27 at 71.6% for business hotels and 71.9% for ryokan, followed by Saturday 9/26 at 76.6% for ryokan and 77.2% for resorts. Precisely because the three-day weekend looks reassuring on high progress, 9/26-27 is where attention tends to thin out. The practical move is to settle promotion for the following weekend in the same meeting that handles holiday inventory.
| Timing | Action | Decision trigger | Objective |
|---|---|---|---|
| This week (passing T-30) | Take stock of remaining inventory across the three days by date and price band, and reset 9/20 as the reference day | If a property’s own 9/20 progress is flat or worse against the market shape that builds from 91.5% (resorts) and 93.8% (ryokan) at 45 days out through the 40-days-out and latest readings (Table 2) | Detect missed pickup on the highest-rate day while a month still remains |
| This week | Set September rates against the monthly market level | If a property’s September pricing remains well below the current September 2026 estimates (city ¥16,500, resort ¥17,000, business ¥13,600, ryokan ¥12,800) | Avoid releasing remaining inventory below the market range on days already running above 90% progress |
| Within two weeks (around T-20) | Consider promotion that steers inventory toward the opener 9/19 (exposure for multi-night plans anchored on it, re-cut price bands) | If a property’s remaining 9/19 inventory is the largest of the three days and the market sold-out property rate for 9/19 stays lowest at 30.2% (resorts) and 28.4% (city hotels) | Concentrate selling resources on the day where inventory is moving most across the three |
| Within two weeks | Design how minimum length of stay (MLOS) is relaxed date by date. Confine the two-night requirement to 9/19-20 and keep a channel open for single-night stays on 9/21 | Where a property’s 9/21 progress lags 9/19. The market, however, runs 88.8% (resorts) and 89.6% (ryokan) on 9/21 — above 9/19 — so relax only after confirming actual remaining inventory | Avoid mechanically shutting out single-night demand on 9/21 through multi-night conditions |
| Within two weeks | Prepare promotion for the following weekend (9/26 and 9/27) at the same time | If the market at the 45-days-out snapshot sits well below the three holiday nights — 71.6% for business hotels and 71.9% for ryokan on 9/27 — and the property shows the same trough | Keep the following weekend’s shortfall, hidden behind strong holiday progress, from carrying into the final stretch |
| Toward next month (planning October) | Once the three-day weekend closes, review the property’s own curve on the same three-point frame and feed it into revision timing from October onward | If, given that finalized July runs −5.7% YoY for city, −4.0% for resort, −3.3% for ryokan and +4.1% for business — directions that split by segment — the property’s own results diverge from the direction of its segment | Move to a revision calendar that follows the seasonal shape rather than single-month wins and losses |
Source: MetroEngines Research; compiled by the HotelBank Editorial Team
Summary — three yardsticks
Yardstick 1: the peak of the run is the middle day. At the 45-days-out snapshot, 9/20 is the highest of Hokkaido’s three holiday nights across every segment (ryokan 93.8%, city 94.4%, resort 91.5%, business 88.6%). The gap against the same weekday a week earlier is also largest on the Sunday (ryokan +22.8pt), so the net increment the holiday creates leans to the back end.
Yardstick 2: what 9/21 means differs by segment. At resorts, ryokan and city hotels, 9/21 matches or exceeds 9/19, running +11.0 to +19.3pt against an ordinary Monday. Business hotels (84.6%) are the only segment where 9/21 is the lowest of the three days. On top of that, 9/22 and 9/23 are also holidays in 2026, so 9/21 is not the final day of the run. Treating “the back end of a holiday run” as a uniform day to loosen is worth re-testing segment by segment.
Yardstick 3: the trough sits outside the holiday. Sunday 9/27, after the run, falls to 71.6% at business hotels and 71.9% at ryokan — the lowest level across the eight days for business hotels. Whether the meeting that debates holiday inventory also settles cover for the following weekend is what separates outcomes in the back half of September.
About the Data
– Definition of estimated OCC (based on OTA-listed inventory): occupancy on an OTA-listed-inventory basis = 100 − 100 × rooms remaining on OTA listings ÷ total rooms. It is an estimate based on how inventory offered for sale on OTAs is being taken up, and its definition differs from actual room occupancy (it reads higher). The months covered are September 2026 (stay dates 9/12-9/27) and, for reference, July 2026.
– Booking curve: based on observations from 45 days before the stay date through to the latest reading.
– Definition of estimated settled ADR: the transacted price level (tax-excluded equivalent) estimated from OTA and other sales data (lowest-plan level × segment-specific coefficient, ensembled across multiple channels). Past months are finalized values; the current and future months are estimates based on current selling conditions. Cross-checked against published operating results, the median error is 6.6%. All figures for August 2026 onward in this article are current estimates, not finalized values.
– Breakdown of N: the booking curve covers 139 resort hotels with 16,072 rooms, 74 city hotels with 15,884 rooms, 380 business hotels with approx. 43,200 rooms and 268 ryokan with 11,623 rooms (all Hokkaido, two-adult search conditions). Observed property counts at the 45-days-out snapshot were 127-138 for resorts, 69-74 for city, 356-374 for business and 227-264 for ryokan. Observed property counts fall as the snapshot approaches the stay date; for resorts on 9/20 the latest observation covers 84 properties. N for estimated settled ADR is 69-76 city hotels, 118-146 resort hotels, 344-441 business hotels and 200-297 ryokan (varying by month).
– The sold-out property rate refers to the estimated share of properties with no confirmable listed inventory on OTAs and similar channels.
– Data as of August 18, 2026. Selling conditions and inventory change daily, so the figures in this article are a snapshot at the time of collection.
■ Data Sources
Time-series data on listed inventory and listed prices collected from publicly available OTA information (MetroEngines Research). Hokkaido’s 139 resort hotels, 74 city hotels, 380 business hotels and 268 ryokan were aggregated by segment, and each stay date from 9/12 to 9/27 was observed from 45 days before the stay date through to the latest reading. Monthly estimated settled ADR uses the segment-level monthly series from the same data platform (January 2025 to December 2026). Calendar dates for the public holidays (Respect for the Aged Day, Citizens’ Holiday and Autumnal Equinox Day) follow the Cabinet Office publication “National Holidays” (https://www8.cao.go.jp/chosei/shukujitsu/gaiyou.html).
■ Calculation Assumptions
Estimated OCC is on an OTA-listed-inventory basis (100 − 100 × listed rooms remaining ÷ total rooms), with search conditions of two adults in one room. Comparisons between dates align on days remaining until the stay date (lead time) rather than calendar date, setting each day of the three-day weekend against the same weekday one week earlier, both at the 45-days-out snapshot. The three fixed points are 45 days out, 40 days out and the latest observation (33 days out for 9/19, 34 for 9/20 and 35 for 9/21). Estimated settled ADR is a tax-excluded equivalent; past months are finalized values, while August 2026 onward is treated as an estimate based on current selling conditions.
■ Limitations and Caveats
Estimated OCC is an estimate based on how inventory offered for sale on OTAs is being taken up, and its definition differs from actual room occupancy (it reads higher). The closer a snapshot is to the stay date, the fewer properties have confirmable listed inventory, so the latest observation rests on a thinner sample and swings more (resorts on 9/20 cover 137 properties at 45 days out against 84 at the latest reading). The shape therefore needs to be read together with the 45-days-out and 40-days-out points rather than from the latest single reading. Estimated settled ADR for September 2026 is not a finalized value, and no direct year-on-year comparison against finalized figures for the same month last year has been made. The figures are a snapshot as of August 18, 2026, and selling conditions and inventory change daily.
Related Reading
- Silver Week 2026 Back Half at T-47: Sep 23 Matches a Normal Wednesday
- Hokkaido ADR H1 2026: City −5.7%, Business +4.1%, April the Turn
- Hokkaido City Hotels: Only Aug 15 Trails at 78.7% OCC, 45 Days Out
- Osaka Sep 2026 Holiday: Demand Peaks First 2 Nights, Sep 23 at 58.0%
- Chuseok Sep 24-27: Only Fukuoka, Saga, Kyoto Hold After Silver Week
- Nagano Late-Summer Booking Curve 2026: Ryokan -11.8pt at 45 Days Out
- Silver Week 2026: First in 11 Years — ADR & Booking Curve Analysis