

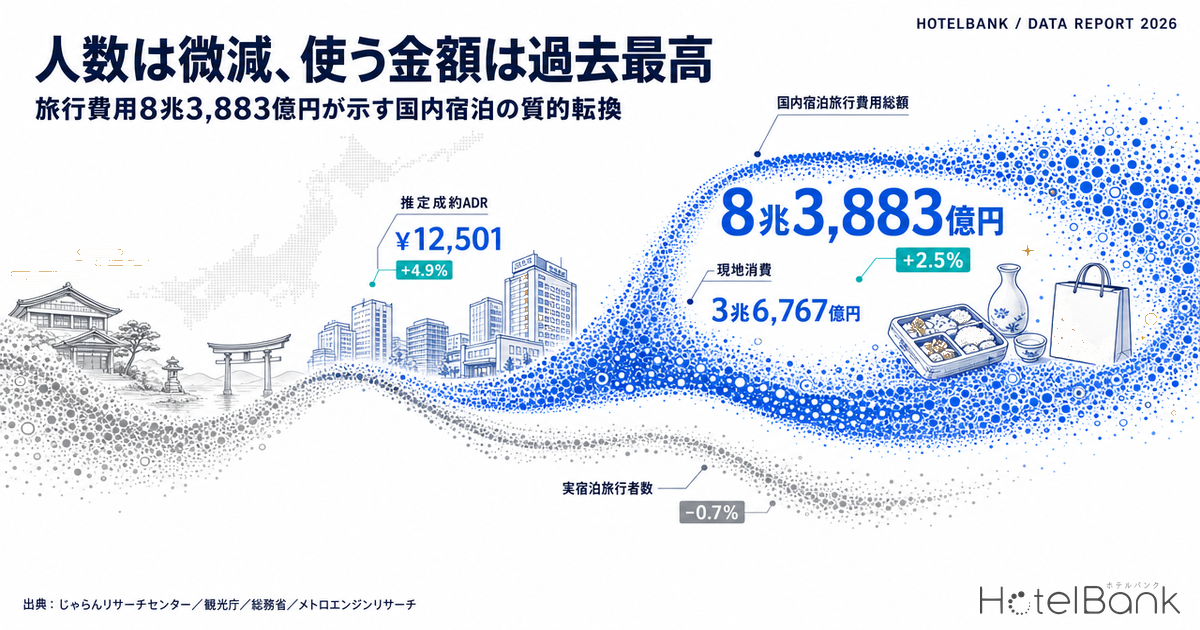
Total spending on domestic overnight leisure travel in Japan reached ¥8.3883tn in FY2025 (April 2025–March 2026), up 2.5% year on year and a second straight year of expansion from ¥7.9172tn in FY2023. Yet the same survey shows the overnight-trip participation rate slipping 0.4 points to 48.9%, and the number of unique overnight travelers falling 0.7% to 45.89 million. Fewer people travelled, and the market still grew. To understand what sits inside that apparent contradiction, we lay official statistics alongside our own settled ADR estimates and check the picture across three layers.
Metric Definitions Used in This Article
- ADR (average daily rate): an estimated settled rate (tax-exclusive equivalent), calculated by applying a segment-specific adjustment coefficient to the lowest publicly listed plan level each property posts on OTAs and similar channels (double occupancy, per-room rate, tax-inclusive). Against property-level results disclosed by listed hotel REITs (184 property-months, disclosures for April–May 2026), the median error is about 7.5%. These are estimates and differ from each property’s actual transacted rates and accounting figures. Area-level ADR is derived from the median of the properties covered; the nationwide figures in this article are composite values, weighting prefecture × segment values by the number of properties covered.
- OCC (occupancy rate): every OCC figure used in this article is a published value from the Japan Tourism Agency’s Accommodation Survey (properties with 10 or more employees, the series prior to the January 2026 change in stratification criteria). These are not our own estimates.
- Spend per trip and the breakdown by category: expenditure per overnight trip per adult, per the Jalan Research Center survey and its definitions.
- Data sources: Jalan Research Center, Japan Tourism Agency, Ministry of Internal Affairs and Communications, MetroEngines Research
- — ¥8.3883tn (+2.5%) — FY2025 total domestic overnight travel spending expanded for a second consecutive year from ¥7.9172tn in FY2023. Over the same period the traveler base shrank: 45.89 million unique overnight travelers (-0.7%) and a participation rate of 48.9% (-0.4pt).
- — Nearly all of the ¥1,600 increase went to on-site spending — spend per trip rose from ¥64,100 to ¥65,700. Lodging plus transport was essentially flat at ¥36,900, while on-site spending grew ¥1,700, from ¥27,100 to ¥28,800.
- — The largest line item is not lodging — on-site spending of ¥3.6767tn (43.8% of the total) is 1.65 times the ¥2.2243tn spent on accommodation. Barely more than a quarter of the travel wallet reaches the hotel.
- — Settled ADR rose 4.9% — the four-segment composite moved from ¥11,919 to ¥12,501 (FY2025, N=199,723 property-months). City hotels gained 10.3% against just 3.2% for ryokan — a gap of more than three times in growth rate.
- — The upside sits outside the folio — roughly ¥16,457 per night is being spent away from the property. Capturing 10% of it in-house would be equivalent to ADR +18.5% for business hotels and +10.8% for ryokan.
Macro: total spending up, traveler numbers down
The starting point is the Jalan Research Center’s “Jalan Domestic Overnight Travel Survey 2026 [Travel Market Trends Edition],” released on 15 July 2026. It covers domestic leisure overnight travel during FY2025 (April 2025–March 2026) and was conducted as an internet survey using Macromill panelists. The first wave distributed 1.081 million invitations and collected 69,854 responses (6.5% response rate), of which 20,000 were tabulated; the second wave collected 15,589 responses (55.7% response rate), yielding 15,548 valid responses and 30,139 individual trip records. Fieldwork ran from 1 to 21 April 2026.
Setting the headline figures against the prior year, the split is clean: totals and unit spend are up, while traveler counts and participation are down.
| Indicator | FY2024 | FY2025 | Change |
|---|---|---|---|
| Total domestic overnight travel spending | ¥8.1867tn | ¥8.3883tn | +2.5% |
| Overnight-trip participation rate | 49.3% | 48.9% | -0.4pt |
| Unique overnight travelers | 46.23mn | 45.89mn | -0.7% |
| Total overnight trips | — | 127.63mn person-trips | -0.1% |
| Total person-nights | 223.08mn | 223.72mn | +640,000 |
| Spend per trip (per adult) | ¥64,100 | ¥65,700 | +¥1,600 |
| of which lodging and transport | ¥37,000 | ¥36,900 | essentially flat |
| of which on-site spending | ¥27,100 | ¥28,800 | +¥1,700 |
| Trips per year | — | 2.78 | — |
| Nights per trip | — | 1.75 | slight increase |
Source: compiled by the HotelBank Editorial Team from the Jalan Research Center’s “Jalan Domestic Overnight Travel Survey 2026 [Travel Market Trends Edition]” (released 15 July 2026). The FY2024 lodging-and-transport figure of ¥37,000 is a published value from the same survey.
Two numbers near the bottom of that table deserve attention. Spend per trip rose ¥1,600. Break it down, and lodging plus transport barely moved, while the ¥1,700 increase in on-site spending accounts for essentially all of the gain. The travel wallet did get fatter — but the extra money is being spent outside the accommodation folio.
The largest line item is not lodging — it is ¥3.6767tn of on-site spending
Viewed as category totals, the structure becomes clearer still. The largest single category is on-site spending at ¥3.6767tn, or 43.8% of the total. Accommodation follows at ¥2.2243tn (26.5%), transport at ¥1.8044tn (21.5%) and package tours at ¥682.9bn (8.1%). On-site spending is 1.65 times the size of the accommodation pool.
Divided back down to a per-trip basis, that is roughly ¥28,800 of on-site spending, ¥17,400 on accommodation, ¥14,100 on transport and ¥5,400 on packages. Of everything a traveler pays “for the trip,” barely more than a quarter reaches the hotel.
Source: compiled by the HotelBank Editorial Team from the Jalan Research Center’s “Jalan Domestic Overnight Travel Survey 2026 [Travel Market Trends Edition]”
The second point worth holding onto is where this year’s increase actually landed. Spend per trip rose ¥1,600, from ¥64,100 to ¥65,700, but lodging and transport combined stayed at ¥36,900 and hardly moved at all. The growth came from on-site spending, up ¥1,700 from ¥27,100 to ¥28,800. Almost the entire increase can be explained by categories other than accommodation and travel.
Source: compiled by the HotelBank Editorial Team from the Jalan Research Center’s “Jalan Domestic Overnight Travel Survey 2026 [Travel Market Trends Edition]”. The FY2024 lodging-and-transport figure of ¥37,000 is a published value from the same survey.
By trip type, independent travel accounts for ¥7.3586tn (87.7%) and package travel ¥1.0297tn (12.3%). The dominance of self-arranged travel has not changed. A high share of independent booking also means that where money gets spent on the ground is not locked in by a package beforehand — much of it is decided in the moment, during the trip itself.
Cross-check: official statistics also show fewer travelers and higher rates
Everything above rests on a single survey. The next step is to test whether the same shape shows up in official statistics, on both the price side and the volume side.
Start with price. The Ministry of Internal Affairs and Communications’ Consumer Price Index for accommodation charges (nationwide, 2020 = 100) averaged 156.4 in FY2024 and 166.8 in FY2025, a rise of 6.6%. The level of accommodation pricing has clearly moved up. Monthly figures show pronounced seasonality, spiking into the 180s in August, and into 2026 the index has continued to run above the prior year: 159.1 in January, 164.7 in February, 167.2 in March, 170.0 in April and 172.3 in May.
Source: compiled by the HotelBank Editorial Team from the Ministry of Internal Affairs and Communications’ Consumer Price Index (accommodation charges, nationwide, 2020 = 100)
Now the volume side. According to the Japan Tourism Agency’s Accommodation Survey, Japanese person-nights totalled 481.18 million in calendar 2025, down 2.7% year on year. Foreign person-nights, by contrast, came to 179.92 million, up 9.4%, leaving the overall total at 661.11 million person-nights (+0.3%) — essentially flat. Domestic lodging volume fell, and inbound demand filled the hole.
On a fiscal-year basis the direction is the same: Japanese person-nights ran 496.51 million in FY2023, 489.12 million in FY2024 and 479.22 million in FY2025, declining for a second straight year. That is consistent with the Jalan survey’s -0.7% in unique overnight travelers and -0.4pt in participation rate.
Occupancy, however, moved the other way. In the same survey’s trend tables (properties with 10 or more employees, the series prior to the January 2026 change in stratification criteria), nationwide occupancy rose from 65.8% in 2023 to 69.4% in 2024 and 70.9% in 2025. (On an all-properties basis the published values are 57.0% in 2023, 59.6% in 2024 and 61.6% in 2025 — a different level, but the same upward direction.) Occupancy rising while Japanese lodging volume fell points to inbound growth, plus room supply expanding only gradually against demand.
Source: compiled by the HotelBank Editorial Team from the Japan Tourism Agency’s Accommodation Survey trend tables (properties with 10 or more employees, the series prior to the January 2026 change in stratification criteria)
Occupancy gains differ by segment. Between 2023 and 2025 the largest improvement came from business hotels, 72.0% to 77.2% (+5.2pt), while resort hotels lifted off a lower base, 54.3% to 59.0% (+4.7pt). Ryokan gained least, 50.2% to 53.5% (+3.3pt). City hotels held a high level throughout, 69.5% to 74.2% (+4.7pt).
| Property type | 2023 | 2024 | 2025 | Two-year change |
|---|---|---|---|---|
| All types | 65.8% | 69.4% | 70.9% | +5.1pt |
| Business hotels | 72.0% | 76.2% | 77.2% | +5.2pt |
| City hotels | 69.5% | 72.8% | 74.2% | +4.7pt |
| Resort hotels | 54.3% | 56.3% | 59.0% | +4.7pt |
| Ryokan | 50.2% | 52.7% | 53.5% | +3.3pt |
| Simple lodgings (guesthouses) | 44.1% | 46.9% | 48.7% | +4.6pt |
Source: compiled by the HotelBank Editorial Team from the Japan Tourism Agency’s Accommodation Survey trend tables (properties with 10 or more employees, the series prior to the January 2026 change in stratification criteria)
Note that from the January 2026 reporting month, the survey changed its stratification basis from employee count to room count. Monthly values from 2026 onward cannot be compared with the earlier series on the same yardstick, so the occupancy trends shown here are limited to the pre-change series.
Micro check: settled ADR up 4.9% for the year, with a threefold spread across segments
The final layer sits closest to the actual point of sale. We take MetroEngines Research’s settled ADR estimates, restricted to finalised months (months for which results are confirmed), by prefecture × segment, and weight them by the number of properties covered to build a nationwide composite. FY2025 covers 199,723 property-months in total, an average of roughly 16,600 properties per month.
The four-segment composite settled ADR was ¥11,919 in FY2024 and ¥12,501 in FY2025, up 4.9%. By segment, city hotels led with ¥12,707 → ¥14,019 (+10.3%), followed by business hotels at ¥8,242 → ¥8,897 (+7.9%). Resort hotels came in at ¥15,971 → ¥16,801 (+5.2%) and ryokan at ¥14,747 → ¥15,226 (+3.2%). The spread between the fastest and slowest growth rates is more than threefold.
| Segment | FY2024 ADR | FY2025 ADR | YoY | Coverage (property-months) |
|---|---|---|---|---|
| City hotels | ¥12,707 | ¥14,019 | +10.3% | 13,084 |
| Business hotels | ¥8,242 | ¥8,897 | +7.9% | 88,057 |
| Resort hotels | ¥15,971 | ¥16,801 | +5.2% | 18,330 |
| Ryokan | ¥14,747 | ¥15,226 | +3.2% | 80,252 |
| Four-segment composite | ¥11,919 | ¥12,501 | +4.9% | 199,723 |
Source: compiled from MetroEngines Research by the HotelBank Editorial Team. Nationwide values are composites, weighting prefecture × segment settled ADR by the number of properties covered.
Source: compiled from MetroEngines Research by the HotelBank Editorial Team (FY2025, N=199,723 property-months)
Tracked monthly, the seasonal outline is visible too. The four-segment composite settled ADR peaks in August and over the New Year period, and troughs in June. August 2025 reached ¥13,618 and December 2025 ¥13,721, the two annual highs. That shape closely matches the August spike in the CPI for accommodation charges.
Source: compiled from MetroEngines Research by the HotelBank Editorial Team (coverage of 15,788–17,066 properties per month)
Recent momentum, however, has softened. Year-on-year, the composite ran +11.7% in January 2026, +4.7% in February, +5.5% in March, +2.1% in April, +1.5% in May and -4.7% in June — the growth rate narrowing quarter by quarter. Japan Tourism Agency preliminary figures point the same way, with total person-nights down 7.2% year on year in April 2026 and down 4.8% in May. Price-side deceleration and volume-side decline are moving in the same direction. It is worth building in the possibility that the rate gains achieved in FY2025 will not repeat at the same tempo in FY2026.
How much of that slowdown you assume changes the picture for FY2026 rate levels considerably. Applying the year-on-year rates cited above mechanically to the FY2025 four-segment composite of ¥12,501 gives the following reference range.
| Scenario | Basis for the assumed growth rate | Annual growth | FY2026 ADR | vs FY2025 |
|---|---|---|---|---|
| Pessimistic | Average year-on-year change over the most recent three months (April–June 2026) | -0.4% | ¥12,455 | -¥46 |
| Central | Average year-on-year change for January–June 2026 | +3.5% | ¥12,934 | +¥433 |
| Optimistic | FY2025 growth rate continues | +4.9% | ¥13,114 | +¥613 |
Source: compiled from MetroEngines Research by the HotelBank Editorial Team. This is a reference range produced by mechanically annualising the year-on-year rates cited in the text; it is not a forecast of future rates.
The gap between pessimistic and optimistic is ¥658, or 5.3 percentage points. Whether the +4.9% achieved in FY2025 was a repeatable annual gain or a one-off level correction changes the assumptions underpinning next year’s business plan substantially. At minimum, actual results through the first half of 2026 have tracked at or below the central case rather than above it.
Reconciling the three layers — room rates rose, travelers’ lodging budgets did not
Lining up the three layers covered so far, each points to something distinct.
| Layer | Indicator | FY2025 (or calendar 2025) | What it shows |
|---|---|---|---|
| Macro Jalan survey | Total travel spending | ¥8.3883tn (+2.5%) | The market-wide wallet expanded |
| Macro | Unique overnight travelers | 45.89mn (-0.7%) | The traveler base shrank |
| Macro | Lodging and transport per trip | ¥36,900 (essentially flat) | Travelers’ lodging budgets did not move |
| Intermediate MIC | CPI, accommodation charges (FY average) | 166.8 (+6.6%) | Accommodation price levels rose |
| Intermediate JTA | Japanese person-nights (calendar year) | 481.18mn (-2.7%) | Domestic lodging volume declined |
| Intermediate | Occupancy rate (calendar year, properties with 10+ employees) | 70.9% (69.4% prior year) | Inbound demand supported volume |
| Micro our estimate | Settled ADR (four-segment composite) | ¥12,501 (+4.9%) | Per-room rates rose |
Source: compiled by the HotelBank Editorial Team from the Jalan Research Center, the Ministry of Internal Affairs and Communications, the Japan Tourism Agency and MetroEngines Research
The three layers do not contradict one another. Per-room rates rose (+4.9%) and accommodation price levels rose (+6.6%). That the lodging-and-transport budget per trip stayed essentially flat regardless is best read as travelers rearranging how they stay. Because the Jalan survey shows nights per trip edging up rather than down (1.75), spending per night was effectively held in check. Indeed, dividing total accommodation spending of ¥2.2243tn by 223.72 million person-nights gives roughly ¥9,900 of accommodation spend per person per night.
The direction of that rearrangement is hinted at in the segment data. Rate growth was slowest at ryokan (+3.2%), which also posted the smallest occupancy improvement of the five property types (+3.3pt). City hotels (ADR +10.3%) and business hotels (ADR +7.9%), meanwhile, are strong on both rate and occupancy. Urban formats, which more readily absorb inbound demand, led on price, while ryokan and resorts — the core of Japanese leisure demand — held rate growth comparatively in check.
The upside sits outside the folio — capturing the ¥3.7tn on-site spending pool
The opportunity this analysis points to is straightforward. Where travelers put their extra money was on-site spending, a pool worth ¥3.6767tn — 1.65 times the ¥2.2243tn spent on accommodation. How much of that enormous pool a property can pull inside its own walls is the next battleground in rate design.
Running the numbers shows the scale of the impact. Shifting 5% of on-site spending into in-house consumption would be worth ¥183.8bn, equivalent to 8.3% of total accommodation spending. At 10% it is ¥367.7bn, or 16.5%; at 15%, ¥551.5bn, or 24.8%. Against roughly ¥9,900 of accommodation spend per night, on-site spending runs ¥28,800 per trip — which works out to more than ¥16,000 a night being spent off-property.
| In-house capture rate | Market-wide value | Ratio to total accommodation spending | Possible capture mechanisms |
|---|---|---|---|
| 5% | ¥183.8bn | +8.3% | Stronger in-house F&B; retail of local products |
| 10% | ¥367.7bn | +16.5% | Experience programmes; spa and activities |
| 15% | ¥551.5bn | +24.8% | Comprehensive design that extends time on property (late check-out and similar) |
Source: estimated by the HotelBank Editorial Team from category totals in the Jalan Research Center’s “Jalan Domestic Overnight Travel Survey 2026 [Travel Market Trends Edition]”. Capture rates are assumptions and do not indicate feasibility.
Market-wide totals are useful for a sense of scale, but what actually moves pricing is one night at one property. Dividing on-site spending of ¥28,800 per trip by 1.75 nights per trip gives roughly ¥16,457 spent off-property per night. The table below sets out how much of a lift to settled ADR each segment would see for a given share of that amount captured in-house.
| Segment | FY2025 settled ADR |
ADR lift by in-house capture rate | ||||
|---|---|---|---|---|---|---|
| 5% | 10% | 15% | 20% | 25% | ||
| City hotels | ¥14,019 | +5.9% | +11.7% | +17.6% | +23.5% | +29.3% |
| Business hotels | ¥8,897 | +9.2% | +18.5% | +27.7% | +37.0% | +46.2% |
| Resort hotels | ¥16,801 | +4.9% | +9.8% | +14.7% | +19.6% | +24.5% |
| Ryokan | ¥15,226 | +5.4% | +10.8% | +16.2% | +21.6% | +27.0% |
| Four-segment composite | ¥12,501 | +6.6% | +13.2% | +19.7% | +26.3% | +32.9% |
Source: estimated by the HotelBank Editorial Team from the Jalan Research Center’s “Jalan Domestic Overnight Travel Survey 2026 [Travel Market Trends Edition]” and MetroEngines Research. Off-property spend per night is on-site spending of ¥28,800 per trip divided by 1.75 nights per trip. Capture rates are assumptions and do not indicate feasibility.
Two things stand out. First, the same capture rate works very differently by segment. Business hotels, with a low rate base, would see the equivalent of ADR +18.5% from a 10% capture, while resort hotels — starting from a high base — gain only +9.8%. Because the numerator, off-property spending, is broadly common across segments, the lower the denominator ADR, the larger the impact. Second, there is the position of ryokan. Ryokan posted the weakest rate growth of any segment at +3.2%, but on the in-house capture axis a 10% share is worth +10.8% — a more realistic band than trying to take it through rate increases alone. A format built around a night with dinner and breakfast is also advantaged in already owning the vessel for in-house consumption.
Three concrete directions follow.
First, designing in-house consumption. On-site spending includes food and drink, shopping and admissions to attractions, so for properties that have been sending guests out for dinner, redesigning the restaurant, bar and lounge is itself a rate-lifting tool. All-inclusive formats, which fold food and drink into the room rate, have the effect of raising the amount travelers register as “lodging and transport” spending (we examine how far this format lifts rates in All-Inclusive Japan 2026: Free Drinks, Lounges & the +40.7% Meal Lift).
Second, designing time on property. Within a short 1.75-night stay, travelers allocate limited hours between the property and everywhere else. Devices that keep guests on site before check-in and after check-out — early check-in, late check-out, day-use bathing slots, opening up workspace — directly expand the opportunity for in-house spending. Designed as paid options, they feed straight through to realised revenue per room.
Third, designing a pricing ladder. That settled ADR growth varies more than threefold across segments shows that properties are capturing different levels in the same market conditions. Ryokan and resorts in particular still have occupancy headroom (2025: ryokan 53.5%, resorts 59.0%), leaving room to grow on both occupancy and rate. Combining tiered pricing by day of week, lead time and inventory sell-through offers scope to leave less on the table in peak bands while filling the quieter ones.
What happened in FY2025 was not simply a numerical inversion in which the market grew while traveler numbers fell. It was a structural change: the amount one person commits to a single trip rose measurably, and that increase was spent somewhere other than the room rate. For hotels, the year ahead will turn not only on raising prices, but on how much of the ¥28,800 travelers are already spending can be invited inside the property.
A note on the data: the settled ADR figures in this article cover only months for which results have been finalised. They are composite values, weighting prefecture × segment figures by the number of properties covered, and will not match nationwide averages from other series with different segment mixes. In addition, the Japan Tourism Agency’s Accommodation Survey changed its stratification basis from employee count to room count starting with the January 2026 reporting month, so the occupancy figures here use the series for properties with 10 or more employees and are limited to values from before that change. To avoid mixing preliminary rounds, April 2026 is identified as second-round preliminary and May 2026 as first-round preliminary.
Related Reading
- Lodging Is 37% of Japan’s ¥2.51T Inbound Spend: ¥10,446 vs Real ADR
- All-Inclusive Japan 2026: Free Drinks, Lounges & the +40.7% Meal Lift
- Weekend Premium 2026: Tokyo Business 24% vs Hakone Ryokan 10%, N=659
References & Sources
■ Primary sources (releases by the surveying bodies)
- Jalan Research Center, “Press Letter [Travel Market Trends Edition]: Jalan Domestic Overnight Travel Survey 2026” (15 July 2026)
- Recruit Co., Ltd., “Jalan Domestic Overnight Travel Survey 2026 [Travel Market Trends Edition]” press release (15 July 2026)
- Jalan Research Center, “Jalan Domestic Overnight Travel Survey” methodology page
■ Government statistics
- Japan Tourism Agency, “Accommodation Survey (April 2026 second-round preliminary, May 2026 first-round preliminary, and calendar 2025 annual figures (final))”
- Japan Tourism Agency, “Accommodation Survey trend tables” (person-nights, Japanese person-nights and occupancy rate by prefecture)
- Ministry of Internal Affairs and Communications, “Consumer Price Index,” accommodation charges (nationwide, 2020 = 100, government statistics code 0003427113) / e-Stat
■ Data sources
The macro layer uses published values from the Jalan Research Center’s “Jalan Domestic Overnight Travel Survey 2026 [Travel Market Trends Edition]” (released 15 July 2026, covering FY2025). The intermediate layer uses the Ministry of Internal Affairs and Communications’ Consumer Price Index for accommodation charges (nationwide, 2020 = 100) and the Japan Tourism Agency’s Accommodation Survey (trend tables for properties with 10 or more employees, the series prior to the January 2026 change in stratification criteria, plus the April 2026 second-round and May 2026 first-round preliminary figures). The micro layer uses MetroEngines Research settled ADR — a nationwide composite of monthly prefecture × segment values weighted by the number of properties covered (April 2024–June 2026; FY2025 N=199,723 property-months, averaging roughly 16,600 properties per month).
■ Estimation assumptions
Settled ADR covers only months for which results have been finalised; months not yet finalised are excluded from the aggregation. For the in-house capture estimates, off-property spend per night is the Jalan survey’s on-site spending of ¥28,800 per trip divided by the same survey’s 1.75 nights per trip, giving approximately ¥16,457; capture rates of 5–25% are then assumed to derive the lift against settled ADR by segment. The FY2026 reference range mechanically annualises the January–June 2026 year-on-year rates cited in the text, with pessimistic = the average of the most recent three months, central = the January–June average, and optimistic = FY2025 performance continuing. Accommodation spend per person per night is total accommodation spending of ¥2.2243tn divided by 223.72 million person-nights.
■ Limitations and caveats
Settled ADR is an estimate derived by applying segment-specific adjustment coefficients to publicly listed lowest-plan levels, and differs from each property’s actual transacted rates and accounting figures (median error of about 7.5% against listed hotel REIT disclosures). It will not match nationwide averages from other series with different segment mixes. The Jalan survey is an internet panel survey, not a census. Because the Japan Tourism Agency’s Accommodation Survey changed its stratification basis from employee count to room count starting with the January 2026 reporting month, the occupancy figures here use the series for properties with 10 or more employees and are limited to values from before that change. Both the in-house capture rates and the FY2026 reference range are assumption-based estimates and indicate neither feasibility nor a forecast of future rates.
■ Market data
- MetroEngines Research — settled ADR (prefecture × segment, finalised months only, April 2024–June 2026; FY2025 N=199,723 property-months)
■ Press coverage