

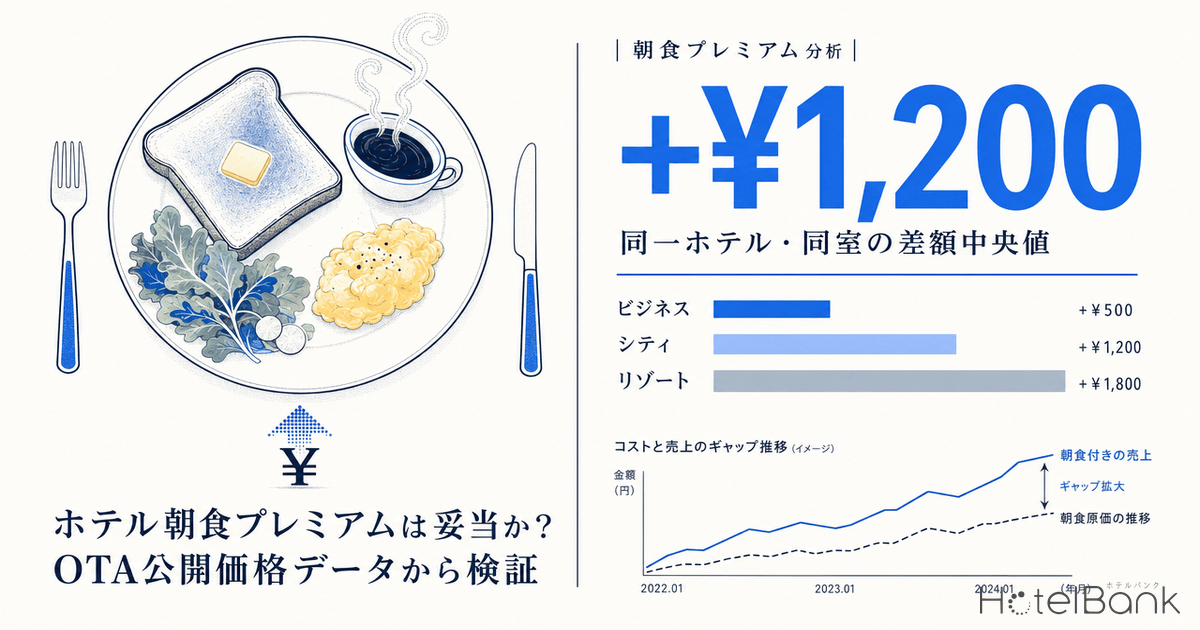
Soaring food and labor costs have pushed the cost ratio of hotel breakfast plans to “120% on a ¥2,200 plan,” according to industry reports. Meanwhile, has the “breakfast premium” paid by guests (the price gap between breakfast-included and room-only plans) been able to keep up with that cost surge? In this article, we extract 71,602 same-hotel, same-date, same-room-type pairs from public price data collected by MetroEngines Research, and verify the median “breakfast premium” and its distribution by hotel category and across four major cities.
Metric Definitions Used in This Article
- ADR (Average Daily Rate): The average of selling prices publicly listed on OTAs and similar channels. This differs from actual transacted prices. Per-room rate (tax included) for double occupancy, averaged across all plan types (room-only through meal-included).
- Data Source: MetroEngines Research
The 120% Cost Ratio Reality — Food Inflation and the Structure of the Breakfast Business
In the hotel industry, breakfast is not a standalone revenue source but rather a key component shaping the overall guest experience. From 2025 into 2026, however, the economic rationale for offering breakfast has been rapidly destabilized. In a case reported by Nobuaki Takizawa on Yahoo Expert, the head chef of a long-established Nagasaki hotel admitted that the cost ratio for its ¥2,200 breakfast plan was “indeed about 120 percent” — meaning the food cost exceeded the price charged to guests.
Historically, according to a Ryoken nationwide ryokan and hotel survey reported by Kanko Keizai Shimbun, the average per-guest breakfast food cost stood at ¥627, with buffet-style averaging ¥528 and individual-set service averaging ¥730. However, those figures predate the recent surge in food prices. As of early 2026, price hikes for roughly 3,600 food items — centered on frozen foods, egg products, rice, and alcoholic beverages — have already been announced, with average increases of around 15%. Reflecting this, current breakfast costs are estimated to have risen to the ¥700–¥900 range per person.
On top of this, rising labor and utility costs are striking breakfast operations directly. Labor shortages in lodging have become structural, and securing staff for the breakfast time slot (6:00–10:00) has been flagged as particularly severe in multiple industry publications. The question, then, is whether the breakfast premium guests pay can absorb these cost increases. This article verifies the answer quantitatively from public price data.
Distribution of Breakfast Premiums — Median ¥3,140, Modal Range ¥3,000s
The per-pair price-difference distribution calculated from 71,602 pairs shows a clear mountain-shaped curve peaking around ¥3,000. The modal range is ¥3,000–¥3,499 (12.8% of the total), followed by ¥2,500–¥2,999 (9.4%) and ¥2,000–¥2,499 (9.3%). Pairs with price differences exceeding ¥6,000 account for only about 11% of the total, indicating that hotel breakfast premiums are converging within an extremely narrow band.
Source: Compiled by HotelBank Editorial Team from MetroEngines Research (N=71,602 pairs, check-in May 12–18, 2026)
Aggregated at the hotel level (covering 1,135 properties with at least 3 pairs each), the median price differences are organized as follows. The bottom-decile hotels show differences of ¥1,400 or less, the median sits at ¥3,140, and the top-decile exceeds ¥6,000 — a more than fourfold spread between properties.
| Percentile | Breakfast Premium (¥, 2 persons) | Interpretation |
|---|---|---|
| Bottom 10% (P10) | ¥1,400 | Effectively free-breakfast level |
| Bottom 25% (P25) | ¥2,400 | Strategic price barely above cost |
| Median (P50) | ¥3,140 | Industry standard level |
| Top 25% (P75) | ¥3,990 | Cost plus secured gross margin |
| Top 10% (P90) | ¥6,000 | High value-add, gourmet appeal |
Source: Compiled by HotelBank Editorial Team from MetroEngines Research (N=1,135 properties, hotel-level median distribution)
An important point here is that the breakfast premium offered for double occupancy converts to half on a per-person basis. The median ¥3,140 equals ¥1,570 per person. Compared with the estimated post-inflation per-person food cost of ¥700–¥900 (i.e., the Ryoken survey baseline of ¥627 plus ~15% inflation), a per-person breakfast premium of ¥1,570 leaves a comfortable gross margin. On the other hand, at the bottom-25% level of ¥1,200 per person, factoring in food costs plus labor suggests a setting that is barely break-even.
Differences by Hotel Category — City Hotels Charge 1.5x What Business Hotels Do
Comparing medians across hotel categories reveals a clear hierarchical structure: business hotels at ¥2,938, resort hotels at ¥3,350, and city hotels at ¥4,410 — premiums rise stepwise as the category moves up. City hotels set premiums roughly 1.5x those of business hotels, reflecting differences in cuisine quality, service style (multi-item buffets, Japanese/Western/Chinese options, etc.), and overall service standards.
Source: Compiled by HotelBank Editorial Team from MetroEngines Research (Business N=833, City N=216, Resort N=86 properties; based on hotel-level medians)
The distribution width by category also has distinctive features. Business hotels stay within a relatively narrow range, from ¥1,210 (P10) to ¥5,040 (P90). City hotels span ¥2,529–¥7,696, and resort hotels stretch from ¥1,576 to ¥8,090. This suggests a polarization within resort hotels between properties that “make breakfast their main selling point” and those that “simplify breakfast to compete on overall price.”
The reason business hotels show a narrower distribution is that competitive price comparison is highly active in this segment, and breakfast premiums are effectively converging on the de facto industry standard band (¥2,000–¥4,000). Conversely, in city and resort hotels, where culinary concept allows greater differentiation, top-tier hotels are more likely to position breakfast as a core acquisition driver even at higher cost.
Comparison Across 4 Major Cities — Tokyo City Hotels Top at ¥5,800; Fukuoka Business at ¥2,600 Lowest
We compared the median breakfast premium by category across the four cities of Tokyo, Osaka, Fukuoka, and Sapporo (Hokkaido). The highest is Tokyo’s city hotels at ¥5,800; the lowest is Fukuoka’s business hotels at ¥2,600 — a 2.2x spread. Tokyo exceeds the other three cities across all categories, and city hotels in particular at ¥5,800 are 1.4–1.6x the level of other cities.
Source: Compiled by HotelBank Editorial Team from MetroEngines Research (hotel-level median, each segment N≥6 properties)
Organizing the trends across the four cities, business hotels cluster within a narrow ¥2,600–¥3,100 band: Sapporo ¥2,600, Osaka ¥2,900, Tokyo ¥3,100, Fukuoka ¥2,600. This is likely because the presence of nationwide chain hotels levels out regional differences. City hotels, in contrast, show notable Tokyo dominance: Sapporo ¥4,200, Osaka ¥3,600, Fukuoka ¥4,100, Tokyo ¥5,800. This suggests that Tokyo’s city hotel market captures premium domestic and international demand and has greater room to price breakfast as an “experiential value.”
| Area | Business | City | Resort | City / Business Ratio |
|---|---|---|---|---|
| Tokyo | ¥3,100 | ¥5,800 | ¥3,500 | 1.86x |
| Osaka | ¥2,900 | ¥3,600 | — (insufficient N) | 1.26x |
| Fukuoka | ¥2,600 | ¥4,100 | ¥4,200 | 1.57x |
| Hokkaido | ¥2,600 | ¥4,200 | ¥3,300 | 1.62x |
*Prices rounded to ¥100 units. Source: Compiled by HotelBank Editorial Team from MetroEngines Research
High-Premium Tier — The Strategy of Experience-Value Hotels
Properties charging breakfast premiums above ¥10,000 account for about 2.8% (32 properties) of the 1,135 hotels analyzed. Most of these are city and resort hotels, leveraging head-chef signature menus, Japanese-Western fusion buffets featuring local ingredients, and high-quality live-cooking stations to position breakfast itself as the core of the lodging experience. For example, at a leading Tokyo city hotel, the breakfast premium for two persons reaches the ¥12,000–¥13,000 range — over ¥6,000 per person — matching the price of the hotel’s external (non-guest) breakfast and effectively offered at a discount to guests.
These high-premium-tier hotels operate on a different economic rationale than the “120% cost ratio” debate suggests. Two reasons: first, “setting a high breakfast price screens out customers who choose room-only versus those who opt in to breakfast,” and second, “revenue from external dining patrons (local business gatherings, dining-destination diners) helps cover the cost.” In other words, the high-premium tier is a strategic price-setting that aligns B2C lodging prices with B2C external dining prices, and cannot be discussed by cost ratio alone.
Low-Premium Tier — Using Effectively Free Breakfast as a Booking Magnet
At the opposite end are hotels with breakfast premiums set below ¥500. At these properties, the price is virtually identical whether the guest selects “with breakfast” or “room-only” — meaning breakfast is effectively offered for free. This strategy is mainly adopted by national-chain business hotels, which target booking acquisition through “the perceived value of an all-in-with-breakfast price” for business travel demand.
According to past reporting by ITmedia and others, the per-person food cost for free breakfast at these chain hotels is held to ¥200–¥400, achieved through menu consolidation, strategic use of frozen foods, and self-service operations — making it possible to maintain sufficient profitability even when offered free. Our data confirms this: at one Hokkaido chain business hotel (N=64 pairs), the breakfast premium is consistently ¥200, evidence that systematized free-breakfast operations are functioning effectively.
An important implication emerges here. The mid-tier hotels with breakfast premiums around ¥3,000 are likely the most exposed to cost inflation. The high-premium tier covers costs through external demand and high prices; the low-premium tier suppresses costs through aggressive operational efficiency. The mid-tier, however, must keep “the room-only price gap at ¥3,000” while continuously absorbing cost surges.
Is the 120% Cost Ratio Real? — Validating from Public Price Data
Let us quantitatively examine the “120% cost ratio” figure circulated within the industry against our data. The case Mr. Takizawa highlighted involved a ¥2,200 plan (per person) with a 120% cost ratio — meaning a ¥2,640 cost. This is 3.6x the ¥730 average cost for individual-set high-quality breakfast in the Ryoken survey. In our data, the top 10% of city hotels reach ¥3,848 per person (¥7,696 for two), and the top 10% of resort hotels reach ¥4,045 per person (¥8,090 for two) — far exceeding Takizawa’s ¥2,200 case in premium setting.
In short, the upper-tier city and resort hotels have priced breakfast at levels that comfortably absorb a “¥2,640 cost.” Meanwhile, at the business hotel median of ¥2,938 (¥1,469 per person), if the offered breakfast cost has risen to ¥1,200–¥1,500 per person, the cost ratio reaches 80–100%. If quality is to be preserved, business hotels are structurally the segment most at risk of effectively reaching a “120% cost ratio.”
Source: Compiled by HotelBank Editorial Team from MetroEngines Research (breakfast premium) and Ryoken survey / Yahoo Expert article by Nobuaki Takizawa (cost levels)
That said, breakfast is not a standalone P&L unit in hotel management. As Mr. Takizawa also notes, “rather than the cost ratio, what matters is how many yen per guest it breaks down to” — a holistic perspective is essential. If breakfast is viewed as a customer-acquisition device, indirect effects such as ADR uplift, repeat-visit improvement, and review-score gains may yield returns exceeding the cost. This is why the “lose money to gain market share” management approach persists in the industry.
2026 Breakfast Strategy — Three Directions
From this analysis, three strategic directions emerge for hotel breakfast going into 2026 and beyond. The first is the “free breakfast model,” which uses thorough operational efficiency and unified menus to keep per-person costs at ¥300–¥500, leveraging “all-in-with-breakfast pricing” as a powerful competitive lever. Chain business hotels have already established this approach.
The second is the “mid-tier premium model,” the ¥2,500–¥4,000 strategy currently adopted by the majority of hotels. However, if cost inflation persists, hotels in this band are most likely to be forced to reconsider their breakfast operations. Specific options include shifting from buffet to individual-set service, narrowing menu items, and applying digital transformation to operations. Kanko Keizai Shimbun has reported that the shift from buffet to set-meal (gozen) format is an emerging industry trend.
The third is the “experience-value model,” the high-premium strategy of ¥6,000+ adopted by upper-tier city and resort hotels. In this band, breakfast itself becomes the booking decision driver and can also pull external (non-guest) demand. Differentiation requires head-chef-curated signature menus, locally sourced ingredients, and live cooking, so fixed-cost burdens are heavy — but pricing power can absorb cost inflation.
Conclusion — The Industry’s Position as Shown by the ¥3,140 Median Breakfast Premium
What the 71,602-pair dataset reveals is that Japan’s hotel breakfast premiums are converging within an extraordinarily narrow range (median ¥3,140, IQR ¥2,400–¥3,990). This reflects an industry structure dominated by national chains and a strong consumer reference point for breakfast prices. At the same time, a clear hierarchy exists by category and area, with a 2.2x spread from Tokyo’s city hotels at ¥5,800 to Fukuoka’s business hotels at ¥2,600.
As food and labor cost pressures continue structurally from 2026 onward, mid-tier hotels will face a moment of choice — either “shift to free breakfast,” “manage costs by switching to individual-set service,” or “raise to the experience-value tier.” Balanced against room-only versus breakfast-included demand, contribution to ADR, and brand strategy, quantitatively understanding “where your hotel’s breakfast premium sits relative to the industry median” will be a critical starting point for revenue management going forward.
Note on future-date ADR: ADR figures in this article reflect the average of selling prices publicly listed on OTAs at the time of survey, and they fluctuate as the check-in date approaches. Please note that prices currently set high may decline through last-minute discounting.
References:
•Nobuaki Takizawa, “Even 120% Cost Ratio!? [Business Hotel Breakfast Battle] Can Operations Sustain Lavish Breakfasts?” Yahoo! Expert
•Kanko Keizai Shimbun, “Ryokan and Hotel Breakfast: Average Cost ¥627 — Ryoken Survey”
•ITmedia, “What’s the Real Cost of a Business Hotel’s ‘Free Breakfast’?”
•Hotel Breakfast Project, “Hotel Breakfasts Will Change Like This in 2026”