

When hotel revenue is discussed, the conversation is almost entirely about guest rooms. ADR went up, occupancy recovered, RevPAR grew — every one of these is a story about money spent by people who stayed the night. But the restaurants and lounges inside a hotel also serve people who never check in: the office worker from next door on a lunch break, the day-trip onsen visitor eating before heading home, the local family celebrating an anniversary. This non-room revenue is booked to the F&B department and drops out of the room-rate conversation entirely.
This article identifies properties across Japan where “lunch service inside the hotel” surfaces as a topic within guest reviews, and quantifies what kind of property structure produces that outcome. The conclusion up front: whether in-house lunch shows up in reviews is explained almost entirely by structural factors — room count, property format, and grade — rather than by the quality of the cooking. We read that structure out of the distribution of 102 properties nationwide.
Metric Definitions Used in This Article
- Mention rate: The share of a property’s guest reviews posted in the past 24 months that refer to lunch service at an in-house restaurant or café. This is the frequency with which a topic appears, not a measure of how highly it was rated — it is neither a satisfaction score nor a sales figure.
- ADR (average daily rate): An estimated settled rate (tax-exclusive equivalent) derived by applying format-specific adjustment coefficients to the lowest published plan level each property posts on OTAs and elsewhere (double occupancy, per-room rate, tax-inclusive basis). Cross-checked against property-level actuals disclosed by listed hotel REITs, the median error is approximately 7%. These are estimates and differ from each property’s actual transacted prices and accounting figures. Area-level ADR is the median across the properties in scope (the level of a typical property in that area).
- Penetration (per 1,000 properties): How many properties out of every 1,000 in the same segment holding 20 or more reviews have in-house lunch appearing as a review topic.
- Data sources: Reviews — HotelBank Editorial Team research (NLP analysis of guest reviews, past 24 months) / Pricing — MetroEngines Research
How This Differs From Themes We Have Already Covered
We have previously covered unbundling meals from room rates as a revenue opportunity, the revenue opportunity opened up by all-inclusive formats, and the raise in the tax-exempt meal-subsidy allowance to ¥7,500 per month. All of those take meal design for staying guests as their subject. This article runs on a different axis: how guests who do not stay overnight — day-use visitors and walk-in lunch customers — move through the property. Because the underlying population of customers is different, the implications are different too.
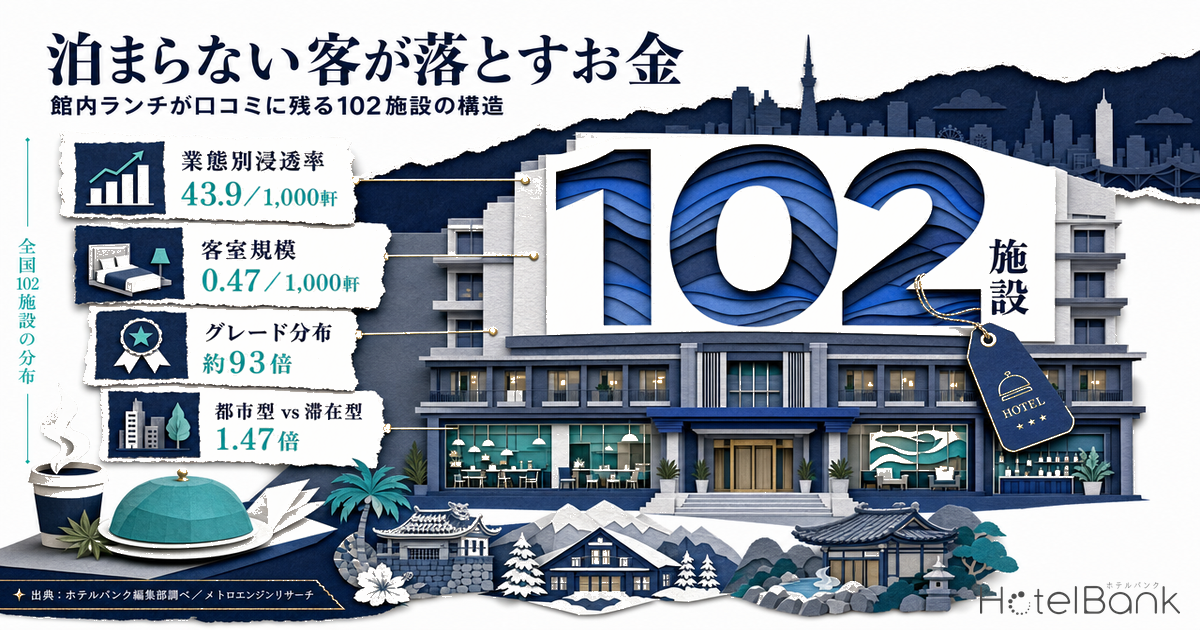
- — 102 properties — Nationwide, 102 properties have in-house lunch appearing in guest reviews. That is under 0.4% of the roughly 27,000 properties with confirmed OTA activity — a rare phenomenon.
- — Roughly 93× — Penetration is 43.9 per 1,000 for Deluxe hotels versus 0.47 for Business hotels. The gap reflects an operating-design choice: whether the in-house restaurant opens at midday at all.
- — Roughly 1,400× — The strongest explanatory variable is room count: 42.6 per 1,000 for properties with 400+ rooms versus 0.03 for those under 30 rooms. The median room count among qualifying properties is 216.
- — 79% — Of the 89 properties for which an estimated settled ADR could be obtained, 70 exceed the median for their own prefecture and format (median multiple 1.47×). This is correlation, not causation.
- — About 3% of room revenue — In an illustrative calculation for a 200-room city hotel, annual in-house lunch revenue works out to roughly ¥43 million. It uses idle hours on seats that already exist, and carries no OTA commission.
In-House Lunch Is Almost Never Discussed in Reviews
First, some context. Within reviews written by overnight guests, references to eating lunch on the property are extraordinarily rare. Of the 531,444 guest reviews for Tokyo compiled by the HotelBank Editorial Team, 121 mention lunch at an in-house restaurant or café — 0.023%. Hokkaido came in at 139 of 228,709 (0.061%), and Hyogo at 140 of 113,340 (0.124%).
That is only to be expected. Reviews are written by people who stayed the night, and their attention goes to the room, breakfast, the public bath, and the location. At midday they are usually out. In other words, in-house lunch is a topic that the structure of the review medium itself makes unlikely to be written about.
Even so, at a handful of properties the mention rate reaches several percent. Scanning all 47 prefectures and extracting properties with three or more positive references to in-house lunch over the past 24 months yields 105 properties. Excluding three properties whose continued listing could not be confirmed (including one that has closed), the 102 properties that remain form the basis of this analysis. Since roughly 27,000 properties in Japan show confirmed activity on OTAs, that is under 0.4% of the total. It is a rare phenomenon — which is precisely why “what kind of property is this happening at” can be explained structurally.
By Format, Ryokan and Business Hotels Are an Order of Magnitude Apart
We broke down the 100 properties whose format could be identified (excluding two that could not be classified) and divided by the number of same-format properties holding 20 or more reviews to derive a penetration rate. The result is unambiguous: there is a one-to-two order of magnitude gap between Deluxe, City, and Resort properties on one side and Ryokan and Business hotels on the other.
Source: Compiled from HotelBank Editorial Team research / MetroEngines Research (N=100 properties with an identifiable format; population is properties holding 20 or more reviews)
| Format | Qualifying properties | Population (20+ reviews) | Per 1,000 properties |
|---|---|---|---|
| Deluxe | 10 | 228 | 43.9 |
| City Hotel | 40 | 1,732 | 23.1 |
| Resort | 36 | 2,296 | 15.7 |
| Ryokan | 9 | 10,599 | 0.85 |
| Business Hotel | 5 | 10,545 | 0.47 |
Source: Compiled from HotelBank Editorial Team research / MetroEngines Research
Deluxe hotels come in at 43.9 per 1,000 properties and city hotels at 23.1. Ryokan, by contrast, sit at 0.85 and business hotels at 0.47 — a gap of roughly 93× between Deluxe and Business.
That gap maps onto a single distinction: whether the in-house restaurant is held as “a facility for staying guests” or as “an outlet that draws its own customers.” Most business hotels close the breakfast room at midday. Ryokan build their operation around dinner and use the middle of the day for prep. Deluxe, City, and Resort properties, by contrast, carry banquet halls, multiple outlets, and lounges, and keep them open through the lunch hours. Whether in-house lunch ends up in reviews is governed by the design of the operating hours themselves.
Room Count Is the Strongest Explanatory Variable — 400+ Rooms Is 1,400× Under-30 Rooms
Break it down one step further and an even sharper gradient appears — sharper than format. It is room count.
Source: Compiled from HotelBank Editorial Team research / MetroEngines Research (N=102 properties; population is properties holding 20 or more reviews)
Among properties with 400 or more rooms, 42.6 per 1,000 have in-house lunch as a review topic. That falls to 19.9 at 200–399 rooms, 6.3 at 100–199 rooms, 1.8 at 30–99 rooms, and 0.03 below 30 rooms. The gap between the top and bottom bands reaches roughly 1,400×. The median room count across the 102 qualifying properties is 216 — more than 13 times the nationwide median of 16 rooms among properties holding 20 or more reviews.
The reason is straightforward. Running a restaurant through lunch requires a certain level of seat utilization. Filling that with staying guests alone is difficult, so walk-in customers have to be captured. Drawing walk-in customers reliably requires parking, a separate circulation path, multiple restaurants, and the local awareness that “you can get lunch there” — all conditions that fall into place alongside scale. Put the other way: for a small property to make in-house lunch a revenue source, the design has to raise revenue per seat through scarcity or experience value rather than through volume.
Grade Distribution — Luxury Is Concentrated at 6× Its Share of the Population
Comparing the grade mix of the 102 qualifying properties against the population (all properties with 20 or more reviews) makes the skew even easier to see.
Source: Compiled from HotelBank Editorial Team research / MetroEngines Research (mix comparison between N=102 properties and the population of all properties holding 20 or more reviews)
Among the qualifying properties, the Luxury band accounts for 65 properties, or 63.7%. Since Luxury makes up 10.4% of the population, that is a concentration of roughly 6.1×. Upper-Mid comes in at 17.6% (population 8.1%), Mid at 13.7% (21.4%), and Economy and Budget combined at just 4.9% (60.0%).
One caution here: this is not a story about luxury hotels having better food. The mention rate is a topic-frequency measure, not a rating. The concentration in the Luxury band exists because hotels at that price point operate multiple restaurants that are open to non-guests and run them through the middle of the day. Facilities and operating design determine which topics appear in reviews. Where the ratings for hotel dining itself cluster by city and price band is treated separately in our ranking of hotel dining reviews across Tokyo, Osaka, and Nagoya.
Two Types — Urban and Stay-Based Are Two Faces of the Same Phenomenon
The 100 properties whose format could be identified split broadly into two types. The first is the urban type (55 properties), made up of City, Deluxe, and Business hotels. Located in office and commercial districts, they draw walk-in customers with weekday business lunches and weekend hotel buffets. The second is the stay-based type (45 properties), made up of Resorts and Ryokan. Day-trip onsen visitors, golfers, and guests in the window before or after check-in take their midday meal on the property.
| Metric | Urban (City, Deluxe, Business) | Stay-based (Resort, Ryokan) |
|---|---|---|
| Qualifying properties | 55 | 45 |
| Room count (median) | 224 rooms | 175 rooms |
| In-house lunch mention rate (median) | 0.35% | 0.48% |
| Estimated settled ADR (median) | ¥22,600 | ¥22,900 |
| Multiple vs. median ADR for same prefecture and format | 1.66× | 1.40× |
| Share also holding afternoon tea as a topic | 23% | 11% |
| Share also holding the in-house bar as a topic | 16% | 13% |
Source: Compiled from HotelBank Editorial Team research / MetroEngines Research
What is interesting is that the mention rate itself is slightly higher for the stay-based type (median 0.48% vs. 0.35%). Urban properties have more rooms and therefore a larger base of reviews, so the denominator pushes the ratio down. Stay-based properties, meanwhile, host stays that are completed on the premises — a welcome lunch before check-in, a poolside meal, a meal packaged with a day-trip bath — and those read naturally as part of the experience.
On co-occurrence with afternoon tea, the urban type leads at 23% against 11% for the stay-based type. Non-room revenue at urban properties is built as a multi-stage sequence across dayparts: lunch, then afternoon tea, then the bar. A design that turns seats over through the whole day around lounge operations is reflected directly in the topic mix of the reviews. That is the same demand segment we examined in our coverage of autumn afternoon tea and the mid-price demand from affluent travelers.
Mention Rate and Room Rate — 79% Sit Above Their Local Level
Properties where in-house lunch stays in the conversation also have a distinctive room-rate profile. For the 89 properties where 12 months of estimated settled ADR could be obtained (settled months from August 2025 through July 2026), we compared each against the median estimated settled ADR for its own prefecture and format. 70 properties (79%) came in above their local level, with a median multiple of 1.47×.
Source: Compiled from MetroEngines Research and the HotelBank Editorial Team (N=89 properties; estimated settled ADR covers settled months from August 2025 through July 2026)
What the scatter shows is that there is no simple proportional relationship between mention rate and ADR. The highest mention-rate band (3% and above) contains a property at ¥12,700 and one at ¥33,900 alike. What is doing the work is the level itself: properties where in-house lunch gets discussed tend to sit in the upper rate tier among same-format properties in their region.
It is worth being careful not to invert the causality here. It is not that running in-house lunch raises the room rate. Properties with the scale and facilities to run multiple restaurants through the middle of the day have higher-grade rooms to begin with. The right reading is a correlation mediated by a shared cause — the overall standard of the property’s build and fit-out. The same directional result appears in our analysis of how in-house restaurant reviews track with ADR lift.
Geographic Distribution — Depth in Okinawa, Hokkaido, and Hyogo
Source: HotelBank Editorial Team research (NLP analysis of guest reviews) (N=102 properties)
By prefecture, Okinawa leads with 14 properties, followed by Hokkaido with 11 and Hyogo with 11. Chiba and Kanagawa follow at 8 each, and Tokyo at 6. The ordering is clearly different from what population size would suggest.
Okinawa and Hokkaido are clusters of resort properties where spending the whole day on site is an established pattern. Hyogo is an unusual case that holds both types at once — the city hotels of Kobe and the ryokan of Arima Onsen — and its in-house lunch mention rate across prefecture-wide reviews, 0.124%, is more than five times Tokyo’s 0.023%. Chiba pairs golf resorts with the large hotels of the bay area, and Kanagawa pairs the resorts of Hakone and Odawara with the city hotels of Yokohama.
Source: Compiled from HotelBank Editorial Team research / MetroEngines Research
The Highest Mention Rates — Two Patterns: Scale and Experience
Looking at the properties with the highest mention rates, two patterns separate cleanly. Only properties whose continued listing could be confirmed are shown.
| Property | Location | Format | Rooms | Mention rate | Mentions / total reviews |
|---|---|---|---|---|---|
| Grandi Style Okinawa Yomitan Hotel & Resort (グランディスタイル 沖縄 読谷 ホテル&リゾート) | Okinawa | Resort | 54 | 8.57% | 3 / 35 |
| Nikko Kinugawa Hotel Mikazuki (日光きぬ川ホテル三日月) | Tochigi | Ryokan | 259 | 6.45% | 54 / 837 |
| Coco Garden Resort Okinawa (ココガーデンリゾートオキナワ) | Okinawa | Resort | 96 | 3.91% | 11 / 281 |
| Hilton Nagoya (ヒルトン名古屋) | Aichi | Deluxe | 460 | 3.90% | 30 / 770 |
| Shizunai Eclipse Hotel (静内エクリプスホテル) | Hokkaido | City | 64 | 3.80% | 10 / 263 |
| Renaissance Okinawa Resort (ルネッサンスリゾートオキナワ) | Okinawa | Resort | 377 | 2.29% | 5 / 218 |
| ANA Holiday Inn Sapporo Susukino (ANAホリデイ・イン札幌すすきの) | Hokkaido | Business | 178 | 2.22% | 9 / 406 |
| Hotel Agora Regency Osaka Sakai (ホテル アゴーラ リージェンシー 大阪堺) | Osaka | Deluxe | 241 | 2.13% | 36 / 1,691 |
| The Naha Terrace (ザ・ナハテラス) | Okinawa | Resort | 145 | 1.56% | 4 / 257 |
| Nakanobo Zuien (中の坊瑞苑) | Hyogo | Ryokan | 50 | 1.49% | 3 / 202 |
| Kobe Bay Sheraton Hotel & Towers (神戸ベイシェラトン ホテル&タワーズ) | Hyogo | Deluxe | 267 | 1.40% | 21 / 1,504 |
| Conrad Tokyo (コンラッド東京) | Tokyo | Deluxe | 291 | 1.26% | 3 / 239 |
| Nikko Kanaya Hotel (日光金谷ホテル) | Tochigi | City | 63 | 1.22% | 10 / 823 |
| Kawana Hotel (川奈ホテル) | Shizuoka | City | 100 | 1.12% | 3 / 268 |
Source: HotelBank Editorial Team research (N=102 properties, compiled from guest reviews over the past 24 months)
The reviews at the top-ranked properties show the lunch use case directly. At Hilton Nagoya (ヒルトン名古屋), multiple posts explicitly describe visits for the meal rather than for a stay — “came for the lunch buffet,” “we used the lunch buffet.” At Nikko Kinugawa Hotel Mikazuki (日光きぬ川ホテル三日月), one review — “we had the welcome lunch before check-in and enjoyed the pool” — shows pre-check-in hours being consumed on the property. At Renaissance Okinawa Resort (ルネッサンスリゾートオキナワ), comments such as “breakfast and lunch were all delicious” line up as descriptions of meals completed on site across the whole day.
It is worth noting that mention rates swing when the denominator is small. The 8.57% at Grandi Style Okinawa Yomitan (54 rooms) is 3 mentions out of 35, and the 1.49% at Nakanobo Zuien (50 rooms) is 3 out of 202. By contrast, the 6.45% at Nikko Kinugawa Hotel Mikazuki is 54 out of 837, and the 2.13% at Hotel Agora Regency Osaka Sakai is 36 out of 1,691 — substantial in absolute counts as well. This is a metric that should be judged on both the ratio and the raw count.
Sizing the Revenue — As a Calculation on Stated Assumptions
So far we have structured qualitative review data. So how large could non-room food and beverage revenue actually be? Actual figures are each company’s accounting data and cannot be obtained from public sources, so what follows should be read as a calculation on explicitly stated assumptions.
Suppose a 200-room city hotel runs lunch service at an average of 60 covers per day with an average spend of ¥2,000. That is ¥120,000 a day, ¥3.6 million a month, and roughly ¥43 million a year. Room revenue at the same hotel, calculated at an estimated settled ADR of ¥22,600 and 80% occupancy (year-round; an assumed value for the purposes of this calculation), comes to roughly ¥1.32 billion a year. Under these calculation assumptions, non-room lunch revenue amounts to about 3% of room revenue.
Whether 3% reads as small or large depends on how you view the cost structure. Sellable room nights are fixed unless rooms are added, but restaurant seats already exist, and at most properties they sit idle through the midday hours. In the sense that it uses idle hours on assets already in place, this is an area with high sensitivity to incremental investment. On top of that, walk-in customers do not come through booking sites, so no OTA commission applies. The same revenue leaves a different share in hand.
* Regarding the calculation above: Seat utilization, average spend, and occupancy are all assumptions set by this article, not actual figures from any real property. It does not present actual amounts; it is an illustration intended to convey relative scale against room revenue.
How to Read Non-Room Revenue as Headroom
What this analysis shows is that properties where in-house lunch appears in reviews are concentrated among those that already satisfy the preconditions of scale and facilities: large Deluxe, City, and Resort properties, the Luxury band, 200 rooms and up. For properties that meet those conditions, the midday hours are an area where headroom remains.
For properties that do not meet them — ryokan, business hotels, small properties — the same result reads differently. It also means the market is open. The ryokan penetration figure of 0.85 per 1,000 shows that only a very small number of ryokan nationwide have designed in-house lunch as a standalone product for day visitors. A day-bath-plus-lunch package, a kaiseki lunch aimed at local customers, a midday corporate function — all of these can be assembled from the kitchen and function space that already exist, and all draw customers through a channel separate from accommodation.
There is a corporate-demand tailwind as well. With the tax-exempt allowance for meal subsidies raised from ¥3,500 to ¥7,500 per month, it has become easier for companies to subsidize employees’ lunches. In-house restaurants at hotels located in office districts are well placed to absorb that policy change. The “lunch → afternoon tea → bar” multi-stage structure seen at the 55 urban properties can also be read as a design that offers both corporate and individual customers an entry point by daypart.
The day-use market itself is expanding. ANA InterContinental Tokyo (ANAインターコンチネンタルホテル東京) offers day-use plan customers a discount at participating in-house restaurants, and Keio Plaza Hotel (京王プラザホテル) runs plans with stays of up to 12 hours. The “stay without staying” — a room combined with in-house dining — is beginning to work as a product. In-house lunch is one of its entry points.
Summary
The results of analyzing the 102 properties nationwide where in-house lunch remains a topic within guest reviews are as follows.
| Point | Data |
|---|---|
| Rarity of the phenomenon | 121 of 531,444 guest reviews in Tokyo (0.023%). 102 qualifying properties nationwide |
| Effect of format | Deluxe 43.9 per 1,000 vs. Business 0.47 per 1,000 (roughly 93× gap) |
| Effect of scale | 400+ rooms 42.6 per 1,000 vs. under 30 rooms 0.03 per 1,000. Median room count of qualifying properties: 216 |
| Grade | Luxury band at 63.7% (a 6.1× concentration versus the population) |
| Two types | Urban: 55 properties (median 224 rooms, 1.66× local ADR) / Stay-based: 45 properties (175 rooms, 1.40×) |
| Relationship to room rate | 70 of 89 properties (79%) exceed the median estimated settled ADR for their prefecture and format. Median multiple 1.47× |
| Geographic distribution | Okinawa 14, Hokkaido 11, Hyogo 11, Chiba 8, Kanagawa 8, Tokyo 6 |
Source: Compiled from HotelBank Editorial Team research / MetroEngines Research
The room-revenue conversation is bounded by a ceiling: the room count. Unless a new wing goes up, there are no more rooms to sell. In-house F&B, by contrast, uses idle hours on seats that already exist. Money spent by people who do not stay is revenue of a kind that raises utilization on assets already owned. The 102 properties here can be read as leading cases that have made that headroom visible in the form of reviews.
Related Reading
- Unbundling Meals from Room Rates — Room-Only Stays Plus Local Dining to Cut Costs and Lift Rates
- The Revenue Opportunity in All-Inclusive 2026 — How Free-Flow Drinks and Complimentary Lounges Lift Rates
- Hotel Dining Chosen for Special Occasions — Dining Review Rankings for Luxury Hotels in Tokyo, Osaka, and Nagoya
References and Sources
■ Primary data for this article
- HotelBank Editorial Team research — NLP analysis of guest reviews (past 24 months, scanned prefecture by prefecture across all 47 prefectures, extracting properties with three or more positive references to in-house lunch and 20 or more reviews, N=102 properties)
- MetroEngines Research — Estimated settled ADR (settled months from August 2025 through July 2026; N=89 at property level, with area benchmarks computed by prefecture × format), and confirmation of continued listing status
■ Data sources
Using NLP analysis of guest reviews, all 47 prefectures were scanned prefecture by prefecture to extract properties with three or more positive references to in-house lunch service over the past 24 months (with properties holding 20 or more reviews as the population). Of the 105 properties identified, three whose continued listing could not be confirmed were excluded, leaving 102 properties in scope. Room rates are estimated settled rates derived by applying format-specific adjustment coefficients to the lowest published plan level each property posts on OTAs and elsewhere; the median error against property-level disclosures by listed hotel REITs is approximately 7%.
■ Calculation assumptions
The revenue calculation in the body assumes a 200-room city hotel whose in-house restaurant runs lunch service at an average of 60 covers per day with an average spend of ¥2,000 (¥120,000 per day → roughly ¥43 million per year). The room revenue used for comparison was derived as estimated settled ADR ¥22,600 × 80% occupancy (year-round, assumed) × 200 rooms × 365 days, for roughly ¥1.32 billion per year. Seat utilization, average spend, and occupancy are all assumptions set by this article and are not actual figures from any real property.
■ Limitations and caveats
(1) The mention rate is the frequency with which a topic appears in reviews; it is neither a satisfaction score nor a measure of F&B revenue. (2) At properties with few reviews the mention rate swings widely, so both the ratio and the raw count need to be considered (for example, 3 of 35 and 54 of 837 cannot be treated as equivalent). (3) The relationship between in-house lunch and room rate is correlation, not causation, and should be read as a relationship mediated by the shared factors of scale and facilities. (4) Actual non-room F&B revenue is each company’s accounting data and cannot be obtained from public sources.
■ Market and policy references
- Teikoku Databank, “Nationwide ‘Ryokan and Hotel Market’ Trend Survey (FY2025 Outlook)”
- ANA InterContinental Tokyo, “Day Use (Day-Trip Plans)”
- Keio Plaza Hotel, “Day Use — Up to a 12-Hour Stay, 12:00 Check-In to 24:00 Check-Out”
- Nikkei, “Utsunomiya Grand Hotel: Bankruptcy Proceedings Commenced” (August 2021) — basis for excluding delisted properties
■ Official information for featured properties
- Hilton Nagoya, “Restaurant Plans (Buffet)” — confirmation of room count and lunch buffet hours
- Shizunai Eclipse Hotel, “Lunch” — confirmation of non-guest lunch availability and seat count
- Grandi Style Okinawa Yomitan Hotel & Resort, “Hotel Overview” — confirmation of room count and year of opening