

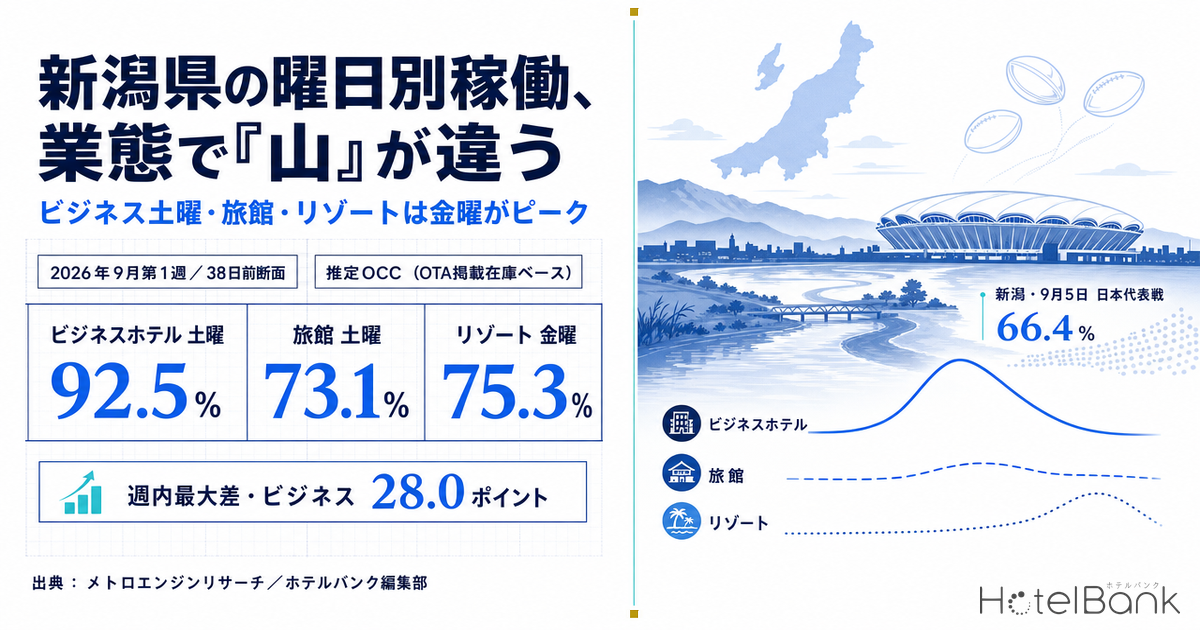
Slice Niigata’s lodging demand by day of the week and the peak sits in a completely different place depending on the property type. Looking at the first week of September 2026 (August 31 to September 6) through a single aligned snapshot in which every day of the week is measured 38 days before arrival, business hotels (N=108 properties) run 92.5% on Saturday and 82.6% on Sunday against 64.5% on Tuesday — a 28.0-point spread within the week. Ryokan (N=205 properties) sit at 73.1% on Saturday and 62.8% on Sunday, a spread of just 10.3 points. Resort hotels (N=31 properties) go further still: Friday 75.3% > Thursday 74.2% > Saturday 72.6%, so Saturday is not even the peak. Same prefecture, same week, same observation snapshot — and three entirely different day-of-week blueprints.
Scope: Niigata Prefecture, business hotels N=108 properties, ryokan N=205 properties, resort hotels N=31 properties. The only metric covered in this article is occupancy, expressed as estimated OCC (based on OTA-listed inventory), which is an estimate. Day-of-week price metrics are not covered. Definitions appear at the end of the article. Data as of August 1, 2026.
- — A 28.0-point spread within the week — In the aligned 38-days-out snapshot for the first week of September 2026, Niigata’s business hotels run 92.5% on Saturday against 64.5% on Tuesday. Weekdays and weekends behave almost like separate markets.
- — Ryokan are flat at 10.3 points — In the same snapshot the range runs from 73.1% on Saturday to 62.8% on Sunday. Tuesday (69.3%) actually beats Friday (68.3%), and the biggest gap is Sunday, not the weekend.
- — Resorts peak on Friday — Friday 75.3% > Thursday 74.2% > Saturday 72.6%. That ordering holds across all four snapshots (45, 42, 40 and 38 days out), so no weekend premium is forming.
- — September 5 is a date, not a day of the week — 94.0% in the 45-days-out snapshot, with 66.4% of properties showing no bookable listed inventory. It is the date of Japan’s first national rugby test in Niigata in 18 years, and it separates clearly from the other Saturdays in the same snapshot (76.2–85.5%).
- — Designing from the end point misleads — In the July 2026 actuals (measured close to arrival) the gap between Saturday at 95.5% and weekdays at 88.8–90.3% compresses to 5–7 points. Decisions should be made on a snapshot where action is still possible.
Start with the actuals — day-of-week estimated OCC for July 2026
Before moving to forward-looking snapshots, it is worth fixing the shape of the week using the most recently completed stay month. Averaging Niigata’s daily estimated OCC for July 2026 (observed close to arrival) by day of the week gives the following picture.
Source: compiled by the HotelBank Editorial Team from MetroEngines Research
| Property type | Mon | Tue | Wed | Thu | Fri | Sat | Sun | Monthly avg | Sat−Mon |
|---|---|---|---|---|---|---|---|---|---|
| Business hotels (median 108 properties) | 84.2 | 90.3 | 89.5 | 89.5 | 88.8 | 95.5 | 86.0 | 89.1 | +11.3 |
| Ryokan (median 184 properties) | 81.8 | 81.9 | 82.5 | 80.5 | 86.9 | 95.6 | 85.1 | 84.3 | +13.8 |
| Resort hotels (median 26 properties) | 65.7 | 68.9 | 68.5 | 67.6 | 73.5 | 79.7 | 72.7 | 70.7 | +14.0 |
Source: compiled by the HotelBank Editorial Team from MetroEngines Research (July 2026, %. After excluding days with thin observation coverage, the days used are 31 for business hotels, 28 for ryokan and 29 for resort hotels)
In actuals that ran all the way to the eve of arrival, all three property types peak on Saturday and bottom out on Monday. Business hotels at 95.5% on Saturday and ryokan at 95.6% are effectively level, and resort hotels also record their own weekly high at 79.7%. Judging from this alone, a single monolithic reading — “Saturday is strong in Niigata” — would seem to suffice.
These actuals, however, are the end point reached after inventory has moved right up to the stay date. For business hotels, weekdays land at 90.3% on Tuesday, 89.5% on Wednesday and 89.5% on Thursday — only 5–6 points below Saturday — and the Saturday-to-Monday gap stays within 11.3 points. July also contains Marine Day, which lifts the weekday baseline. What day-of-week design actually requires is not this end point but a snapshot taken while decisions can still be made. How the 45-days-out level and the subsequent build-up differ by property type is also examined in Tochigi Booking Curves by Type: Resort 81.1% at T-45, Only +2.6pt Left.
Re-cut on an aligned snapshot and the shape of the week splits by property type
For the seven days of the first week of September 2026 (Monday August 31 to Sunday September 6), we extracted snapshots in which every day of the week sits at the same number of days remaining. Because comparison breaks down when observation timing drifts between days, four snapshots — 45, 42, 40 and 38 days out — were aligned to the same days remaining, and the two at either end (45 and 38 days out) are shown below.
Source: compiled by the HotelBank Editorial Team from MetroEngines Research
| Property type / snapshot | Mon 8/31 | Tue 9/1 | Wed 9/2 | Thu 9/3 | Fri 9/4 | Sat 9/5 | Sun 9/6 | Max spread in week |
|---|---|---|---|---|---|---|---|---|
| Business, 45 days out | 65.0 | 66.4 | 67.4 | 69.0 | 79.7 | 94.0 | 82.4 | 29.0 |
| Business, 38 days out | 64.6 | 64.5 | 65.8 | 67.4 | 80.7 | 92.5 | 82.6 | 28.0 |
| Ryokan, 45 days out | 64.0 | 69.6 | 68.1 | 63.2 | 67.9 | 72.5 | 62.9 | 9.6 |
| Ryokan, 38 days out | 65.2 | 69.3 | 66.9 | 63.0 | 68.3 | 73.1 | 62.8 | 10.3 |
| Resort, 45 days out | 51.9 | 67.5 | 69.2 | 72.9 | 75.0 | 71.7 | 69.0 | 23.1 |
| Resort, 38 days out | 55.3 | 67.8 | 69.4 | 74.2 | 75.3 | 72.6 | 69.7 | 20.0 |
Source: compiled by the HotelBank Editorial Team from MetroEngines Research (%. Estimated OCC is based on OTA-listed inventory)
Three differences stand out.
First, business hotels show by far the largest drop within the week. In the 38-days-out snapshot, Saturday runs 92.5% against Tuesday at 64.5%, a gap of 28.0 points. The three days from Friday through Sunday — including Friday at 80.7% and Sunday at 82.6% — all sit in the 80s, while the four days from Monday to Thursday cluster in the 64–67% range. The 5–6 point weekday-to-Saturday gap visible in the July actuals is the result of compression from build-up right up to arrival; more than a month out, when decisions are still possible, weekdays and weekends move as completely separate markets.
Second, ryokan are flat across the week. In the 38-days-out snapshot the high is Saturday at 73.1% and the low is Sunday at 62.8%, a spread of 10.3 points. On top of that, Tuesday at 69.3% beats Friday at 68.3%, so the simple “weekdays are weak” framing does not hold. Ryokan in the prefecture include onsen-area stay demand, which suggests an independent weekday motivation to book. At the same time, Sunday being the weakest day of the week also holds in the 45-days-out snapshot (62.9%), and the 10.3-point drop from Saturday is the clearest weak point ryokan face.
Third, resort hotels show no weekend premium at all. The ordering Friday 75.3% > Thursday 74.2% > Saturday 72.6% was unchanged across all four snapshots at 45, 42, 40 and 38 days out. Because Friday keeps beating Saturday no matter when the observation is taken, this inversion does not stem from how the snapshot was cut. The trough is concentrated on a single day — Monday, at 55.3% in the 38-days-out snapshot — while Tuesday onward stays inside a narrow 67–75% band. For resort hotels, the days to defend are Thursday and Friday rather than Saturday, and the day to fill is Monday rather than Sunday.
For reference, the top three days for business hotels (Saturday, Sunday, Friday) held the same order across all four snapshots (fourth place is tied between Thursday and Wednesday at 67.0% in the 40-days-out snapshot only). For ryokan too, both ends — Saturday highest, Sunday lowest — were unchanged across all four snapshots. The ranking of days is itself stable even when the snapshot shifts. That said, even for business hotels the location of the trough changes from prefecture to prefecture: in Aichi and Hiroshima, for example, a different pattern has been observed, with Sunday as the trough and Thursday as the peak.
The 92.5% on Saturday September 5 is not a day-of-week effect — it is the first national test in 18 years
Treating the 92.5% Saturday figure for business hotels as an average picture of the day would lead to a wrong call. Lining up five consecutive Saturdays for Niigata business hotels in the 45-days-out snapshot gives August 15 at 76.2%, August 22 at 78.7%, August 29 at 85.5%, September 5 at 94.0% and September 12 at 87.8% — September 5 alone stands out. The share of properties with no confirmable listed inventory (estimated sold-out property share) also reached 66.4% on September 5 in the same snapshot, against 18.8% on August 15, 28.8% on August 22 and 35.8% on August 29.
Source: compiled by the HotelBank Editorial Team from MetroEngines Research
On that date, Denka Big Swan Stadium in Niigata City hosts the Lipovitan D Challenge Cup 2026 fixture between Japan’s men’s national rugby team and Canada. According to the Japan Rugby Football Union, this is the first men’s national team match held in Niigata Prefecture since 2008, an 18-year gap. Estimated OCC for business hotels on the following day, Sunday September 6, stands at 82.4% in the 45-days-out snapshot (retrieved August 1, 2026) — 12 to 15 points above the other Sundays in the same snapshot (August 23 at 70.0%, August 30 at 67.6% and September 13 at 68.3%) — consistent with a single-day event stretching demand into the nights before and after.
What matters is that this peak selects for property type. Lining up the same five Saturdays for ryokan gives August 15 at 68.7%, August 22 at 71.1%, August 29 at 74.3%, September 5 at 72.5% and September 12 at 72.8% — no spike on September 5. Demand is rising as urban lodging demand near the venue, not as a uniform prefecture-wide phenomenon. Saturday September 12 sitting somewhat higher at 87.8% falls in a week that also overlaps with the Katakai Festival (the grand fireworks dedication at the Asahara Shrine autumn festival) scheduled for September 11 and 12 in Ojiya City.
In other words, Saturdays in Niigata in September mix “Saturdays that are strong as a day of the week” with “Saturdays lifted by an event.” If day-of-week design averages the two into a single Saturday curve, it will overvalue Saturdays without events and undervalue those with them. How far inventory sell-through diverges between event dates and normal weekends is compared on the same 45-days-out snapshot in 94.5% Sold 45 Days Out: Omagari Fireworks vs a Normal Akita Weekend.
For revenue managers running business hotels, ryokan and resorts in Niigata — implications and an action plan
(1) Check whether your day-of-week calendar has been built on the shape of the July actuals. In the July actuals, the gap between Saturday at 95.5% and weekdays at 88.8–90.3% for business hotels was only 5–7 points, but in the 38-days-out snapshot for the first week of September, Saturday at 92.5% and Tuesday at 64.5% were 28.0 points apart. Weekdays build up late and land at a high final level, yet more than a month out they are wide open. Releasing inventory early on the assumption that “weekdays fill about as well as Saturdays,” without recognising this two-layer structure, means taking late weekday demand on cheap inventory.
(2) The days to defend and the days to create differ by property type. For business hotels, the three days from Friday to Sunday sit in the 80s (38-days-out snapshot: Friday 80.7, Saturday 92.5, Sunday 82.6), and the days to fill are Monday to Wednesday in the 64–66% range. For ryokan, Sunday at 62.8% is the weakest day of the week against Saturday at 73.1%, making the 10.3-point Sunday gap the largest opening. For resort hotels, Friday 75.3% > Thursday 74.2% > Saturday 72.6% means no weekend premium is forming, and only Monday at 55.3% is a deep trough. Which pattern your property type belongs to changes which days to address first.
(3) There is room to treat Saturday as a date rather than a day of the week. Saturdays in the 45-days-out snapshot range 17.8 points, from 76.2% on August 15 to 94.0% on September 5, and on September 5 the share of properties with no confirmable listed inventory reached 66.4%, clearly separated from the other Saturdays in the same snapshot (18.8–35.8%). Market depth differs entirely even within the same “Saturday,” so it is worth checking for events on a date-by-date basis first and then splitting inventory and minimum-stay design accordingly.
(4) Watch for single-day event effects bleeding into the nights before and after. Business hotels on Sunday September 6 stood at 82.4% in the 45-days-out snapshot, 12 to 15 points above the other three Sundays (67.6–70.0% in the same snapshot). If the Sunday after an event is handled exactly like an ordinary Sunday, growing demand goes uncaptured. Conversely, Sundays without events sit in the 67–70% range, and those are better separated out as a demand-generation problem.
Action plan
| Horizon | Action | Decision trigger (figures from this article) | Objective |
|---|---|---|---|
| Today to this week | Take stock of your September calendar date by date and label event dates separately from ordinary dates | Saturdays in the 45-days-out snapshot scatter across a 17.8-point range, from 76.2% on August 15 to 94.0% on September 5 | Stop running everything off a “Saturday” average and switch to a design matched to the depth of each date |
| Today to this week | Review the inventory release stage for Saturday September 5 and Sunday September 6 and re-examine how remaining allocation is put out | On September 5 the share of properties with no confirmable listed inventory is 66.4%, and estimated OCC on September 6 is 82.4% (both retrieved August 1, 2026, 45-days-out snapshot) | Preserve operating room by not selling out inventory early on the two days when the market is deep |
| Within two weeks | Stage weekday (Monday–Wednesday) inventory releases and consider a design that leaves depth for the late booking window | Business hotels run 64.5–65.8% Monday to Wednesday in the 38-days-out snapshot, versus 84.2–90.3% in the July actuals (close to arrival) | Avoid cannibalising late-building weekday demand with early inventory release |
| Within two weeks | For ryokan, build offers that connect the “Saturday night plus Sunday checkout” flow to multi-night stays, late checkout and next-morning experiences | Ryokan Sundays sit at 62.8% in the 38-days-out snapshot, the weakest day of the week, 10.3 points below Saturday at 73.1% | Create room to fill the deepest gap — Sunday — by extending the stay of Saturday guests |
| Looking to next month | For resorts, treat Thursday and Friday as the main battleground and consider building two- and three-night stays starting Thursday | The resort ordering Friday 75.3% > Thursday 74.2% > Saturday 72.6% is unchanged across all four snapshots | Drop the Saturday-centric assumption and shift product and allocation to the days that are genuinely deep |
| Looking to next month | Trial one demand-generation initiative for Monday (extending Sunday stays, capturing Monday-morning departure demand) | Resort Mondays sit at 55.3% in the 38-days-out snapshot, more than 10 points below the 67.8–75.3% recorded from Tuesday onward | Explore room to make the only deep trough in the week shallower by extending from adjacent days |
Note: this section offers considerations based solely on the figures presented in this article and does not guarantee results. Implementation requires judgement grounded in your own booking position and market conditions.
Conclusion — three yardsticks for reading Niigata’s week
Yardstick 1: measure the day-of-week drop on a snapshot. In the July actuals, which ran to the eve of arrival, the Saturday-to-Monday gap for business hotels was 11.3 points; in the 38-days-out snapshot, Saturday and Tuesday were 28.0 points apart. In the same market, the face of the week changes depending on when you cut it. What decisions should rest on is a snapshot taken while action is still possible.
Yardstick 2: peaks and troughs sit in different places by property type. In the 38-days-out snapshot, business hotels run in the 80s from Friday to Sunday and in the 64–66% range from Monday to Wednesday; ryokan have a flat week running from 73.1% on Saturday to 62.8% on Sunday, a spread of 10.3 points; and resorts top out at 75.3% on Friday with only Monday at 55.3% dropping away. The general claim that “weekends are strong” did not hold for Niigata’s resort hotels.
Yardstick 3: read Saturday as a date, not a day of the week. Saturdays in the 45-days-out snapshot scatter from 76.2% to 94.0%, and the September 5 spike coincided with the first national rugby test in Niigata in 18 years. That effect also selected for property type (ryokan on the same date showed no spike, at 72.5%) and extended into the following Sunday. Keeping event dates out of day-of-week averages will determine the precision of design from September onward.
About the data
■ Data sources
• Compiled by the HotelBank Editorial Team for Niigata Prefecture (prefecture level) by property type, based on MetroEngines Research (daily observation of OTA-listed inventory). Data as of August 1, 2026.
• Breakdown of N: for the first week of September 2026, the snapshots cover 107–109 business hotels (12,425–12,777 rooms), 203–206 ryokan (4,741–4,780 rooms) and 29–31 resort hotels (4,318–4,349 rooms) in Niigata Prefecture. The number of properties actually observed in each snapshot was 91–99 business hotels at 45 days out and 95–105 at 38 days out; 139–166 ryokan at 45 days out and 154–201 at 38 days out; and 19–23 resort hotels at 45 days out and 20–28 at 38 days out. The July 2026 actuals were compiled after excluding days with thin daily observation, giving 31 days used for business hotels (median 108 properties, 12,633 rooms), 28 days for ryokan (median 184 properties, 4,319 rooms) and 29 days for resort hotels (median 26 properties, 4,071 rooms).
■ Estimation assumptions
• Definition of estimated OCC (July 2026 actuals / 45-days-out and 38-days-out snapshots for the first week of September 2026): occupancy on an OTA-listed inventory basis = 100 − 100 × rooms still listed on OTAs ÷ total rooms. It is an estimate based on the sell-through of inventory offered on OTAs and is defined differently from actual room occupancy (it reads higher). This article uses the label “estimated OCC (based on OTA-listed inventory).”
• Booking curve: based on observations from 45 days before the stay date through the most recent reading. The “45-days-out snapshot” and “38-days-out snapshot” in this article are values extracted with all seven target days aligned to the same number of days remaining. Because comparison breaks down when observation timing drifts between days, the same verification was run on four snapshots — 45, 42, 40 and 38 days out — and the two at either end are shown.
• Exclusion criteria for the July 2026 actuals: days with markedly low daily observation coverage were excluded. Specifically, three days were excluded for ryokan (July 3, 4 and 19) and two for resort hotels (July 3 and 19), giving 28 and 29 days used respectively. No days were excluded for business hotels, so all 31 days are used.
• Target months and observation window: July 2026 (completed stay month, observed close to arrival) and August 31 to September 6, 2026 (snapshots from 45 to 38 days out). This article does not cover price metrics (estimated settled ADR). The day-of-week analysis is built on the occupancy axis alone.
■ Limitations and caveats
• Sold-out property share: an estimate of the share of properties for which no listed inventory can be confirmed on OTAs and similar channels; it does not indicate that a property is actually full. All figures are snapshots as of the relevant observation point.
• Resort hotels have a small population of 29–31 properties, and the number actually observed in each snapshot is only 19–28 (coverage of roughly 61–90%). Differences of 3 points or less within a property type (for example Thursday at 74.2% versus Saturday at 72.6%) can therefore be buried in observation-count variation. Where this article states that “the ordering is unchanged,” it refers only to the Friday > Thursday > Saturday sequence and the Monday trough, both of which reproduced identically across all four snapshots.
• No year-on-year same-day-of-week comparison of estimated OCC is made (less than two years of accumulated observation). Dates that coincide with an event, such as September 5, also cannot be treated as an average picture of the day of the week.
• Data as of August 1, 2026. Because sales conditions and inventory change daily, the figures in this article are a snapshot as of the time of retrieval.
References and sources
• Japan Rugby Football Union, “Announcement of the Lipovitan D Challenge Cup 2026 men’s national team match: Japan vs Canada” https://www.rugby-japan.jp/news/53814
• Japan Rugby Football Union, “Notice regarding the 2026 men’s national team domestic match schedule” https://www.rugby-japan.jp/news/53735
• Denka Big Swan Stadium, “Event information (September 2026)” https://www.denka-bigswan.com/event/index/year/2026/month/9
• Walkerplus, “Katakai Festival (grand fireworks dedication at the Asahara Shrine autumn festival): dates and event information” https://hanabi.walkerplus.com/detail/ar0415e00667/
• Niigata Visitors & Convention Bureau, “Niigata Fireworks Calendar 2026” https://niigata-kankou.or.jp/pickup/hanabi
Related reading
- Tochigi Booking Curves by Type: Resort 81.1% at T-45, Only +2.6pt Left
- Nagano Late-Summer Booking Curve 2026: Ryokan -11.8pt at 45 Days Out
- 94.5% Sold 45 Days Out: Omagari Fireworks vs a Normal Akita Weekend
- Awaodori 2026: 98.8% Sold 45 Days Out — 39.4pt Over Normal Weekends
- Nagasaki Kunchi vs. Kishiwada Danjiri: Weekday vs. Weekend Hotel Demand